---
title: ECS logging libraries
description: Centralized application logging with the Elastic stack made easy. 62682932 9cac3600 b9bd 11e9 9cc3 39e907280f8e Elastic Common Schema (ECS) defines a...
url: https://www.elastic.co/elastic/docs-builder/docs/3016/reference/ecs/logging/intro
products:
- ECS Logging
---
# ECS logging libraries
Centralized application logging with the Elastic stack made easy.
## What is ECS?
Elastic Common Schema (ECS) defines a common set of fields for ingesting data into Elasticsearch. For more information about ECS, visit the [ECS Reference Documentation](https://docs-v3-preview.elastic.dev/elastic/docs-builder/docs/3016/reference/ecs).
## What is ECS logging?
ECS loggers are plugins for your favorite logging library. They make it easy to format your logs into ECS-compatible JSON. For example:
```json
{"@timestamp":"2019-08-06T12:09:12.375Z", "log.level": "INFO", "message":"Tomcat started on port(s): 8080 (http) with context path ''", "service.name":"spring-petclinic","process.thread.name":"restartedMain","log.logger":"org.springframework.boot.web.embedded.tomcat.TomcatWebServer"}
{"@timestamp":"2019-08-06T12:09:12.379Z", "log.level": "INFO", "message":"Started PetClinicApplication in 7.095 seconds (JVM running for 9.082)", "service.name":"spring-petclinic","process.thread.name":"restartedMain","log.logger":"org.springframework.samples.petclinic.PetClinicApplication"}
{"@timestamp":"2019-08-06T14:08:40.199Z", "log.level":"DEBUG", "message":"init find form", "service.name":"spring-petclinic","process.thread.name":"http-nio-8080-exec-8","log.logger":"org.springframework.samples.petclinic.owner.OwnerController","transaction.id":"28b7fb8d5aba51f1","trace.id":"2869b25b5469590610fea49ac04af7da"}
```
## Get started
Refer to the installation instructions of the individual loggers:
- [.NET](https://docs-v3-preview.elastic.dev/elastic/docs-builder/docs/3016/reference/ecs/logging/dotnet/setup)
- Go: [zap](https://docs-v3-preview.elastic.dev/elastic/docs-builder/docs/3016/reference/ecs/logging/go-zap/setup), [logrus](https://docs-v3-preview.elastic.dev/elastic/docs-builder/docs/3016/reference/ecs/logging/go-logrus/setup), [zerolog](https://docs-v3-preview.elastic.dev/elastic/docs-builder/docs/3016/reference/ecs/logging/go-zerolog/setup)
- [Java](https://docs-v3-preview.elastic.dev/elastic/docs-builder/docs/3016/reference/ecs/logging/java/setup)
- Node.js: [morgan](https://docs-v3-preview.elastic.dev/elastic/docs-builder/docs/3016/reference/ecs/logging/nodejs/morgan), [pino](https://docs-v3-preview.elastic.dev/elastic/docs-builder/docs/3016/reference/ecs/logging/nodejs/pino), [winston](https://docs-v3-preview.elastic.dev/elastic/docs-builder/docs/3016/reference/ecs/logging/nodejs/winston)
- [PHP](https://docs-v3-preview.elastic.dev/elastic/docs-builder/docs/3016/reference/ecs/logging/php/setup)
- [Python](https://docs-v3-preview.elastic.dev/elastic/docs-builder/docs/3016/reference/ecs/logging/python/installation)
- [Ruby](https://docs-v3-preview.elastic.dev/elastic/docs-builder/docs/3016/reference/ecs/logging/ruby/setup)
## Why ECS logging?
Logs arrive pre-formatted, pre-enriched and ready to add value, making problems quicker and easier to identify. No more tedious grok parsing that has to be customized for every application.
The first three fields are `@timestamp`, `log.level` and `message`. This lets you easily read the logs in a terminal without needing a tool that converts the logs to plain-text.
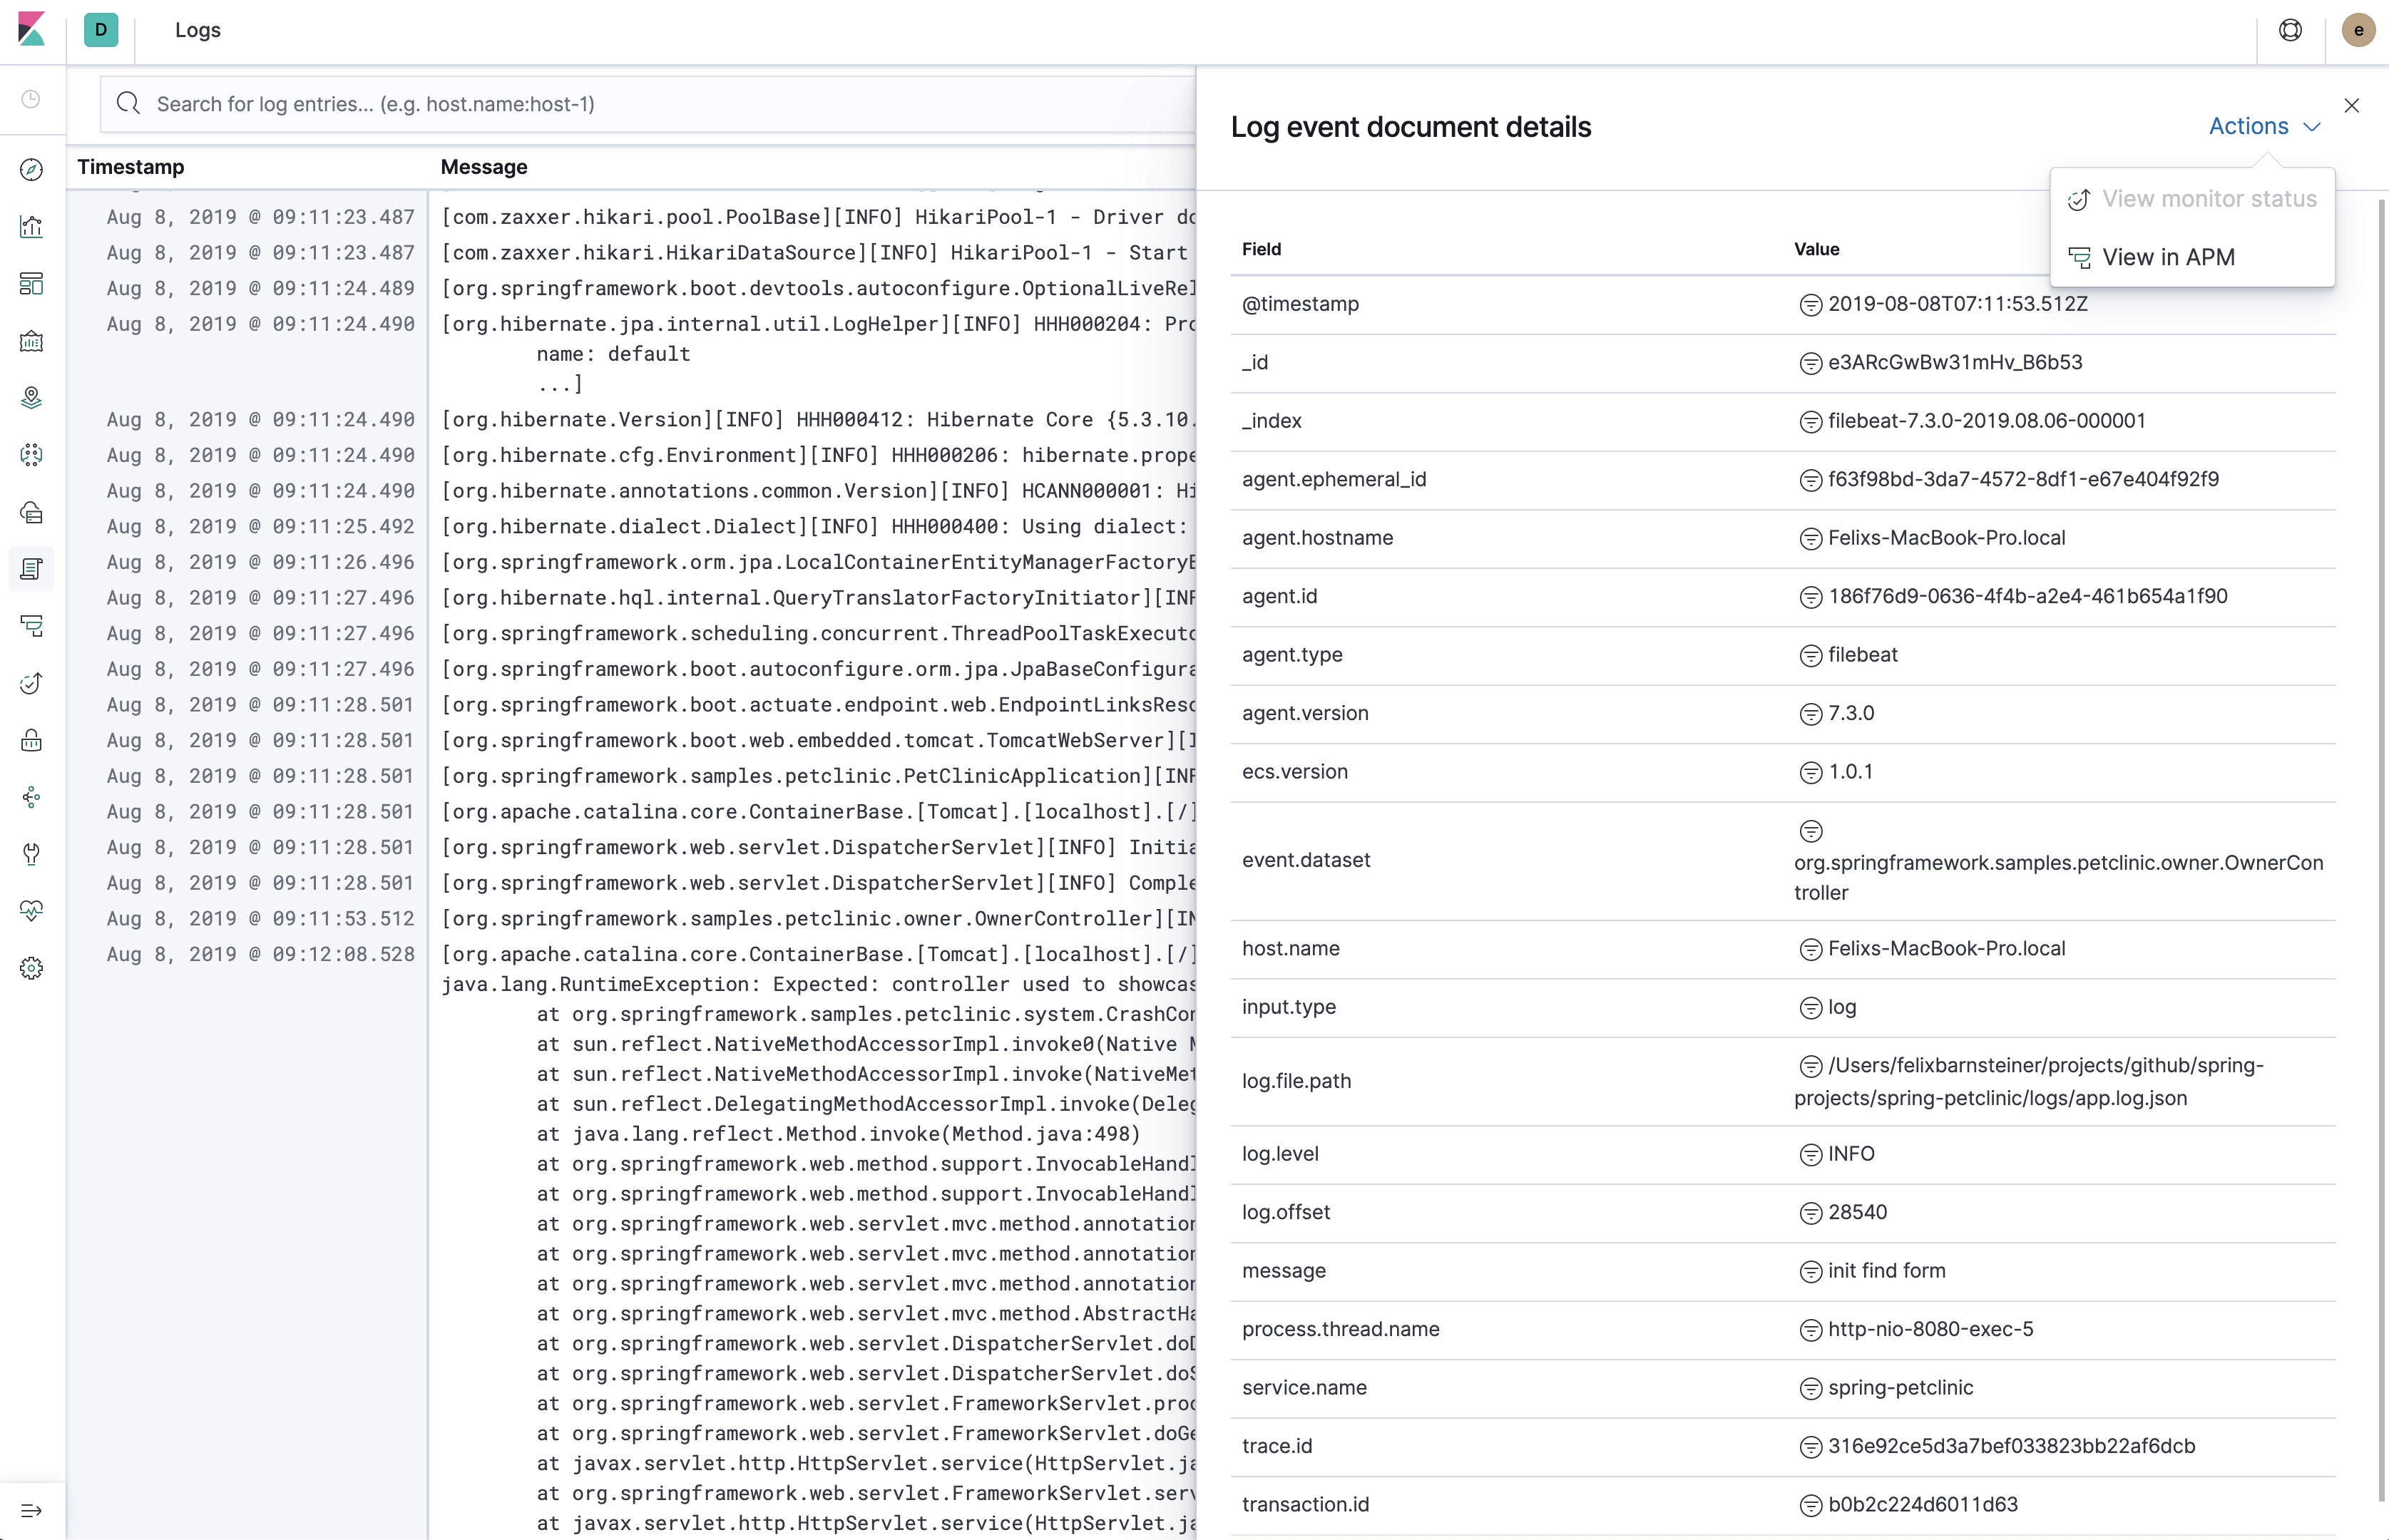
Use the Kibana [Logs app](https://docs-v3-preview.elastic.dev/elastic/docs-builder/docs/3016/solutions/observability/logs/explore-logs) without additional configuration.
Using a common schema across different services and teams makes it possible create reusable dashboards and avoids [mapping explosions](https://docs-v3-preview.elastic.dev/elastic/docs-builder/docs/3016/manage-data/data-store/mapping#mapping-limit-settings).
If you are using an [Elastic APM agent](https://docs-v3-preview.elastic.dev/elastic/docs-builder/docs/3016/reference/apm-agents), you can leverage the log correlation feature without any additional configuration. This lets you jump from the [Span timeline in the APM UI](https://docs-v3-preview.elastic.dev/elastic/docs-builder/docs/3016/solutions/observability/apm/trace-sample-timeline) to the [Logs app](https://docs-v3-preview.elastic.dev/elastic/docs-builder/docs/3016/solutions/observability/logs/explore-logs), showing only the logs which belong to the corresponding request. Vice versa, you can also jump from a log line in the Logs UI to the Span Timeline of the APM UI. For more information about the log correlation feature, refer to [Stream application logs](https://docs-v3-preview.elastic.dev/elastic/docs-builder/docs/3016/solutions/observability/logs/stream-application-logs).
### Additional advantages when using in combination with Filebeat
We recommend shipping the logs with Filebeat. Depending on the way the application is deployed, you may log to a log file or to stdout (for example in Kubernetes).
Here are a few benefits to this over directly sending logs from the application to Elasticsearch:
[Guaranteed at-least-once delivery](https://docs-v3-preview.elastic.dev/elastic/docs-builder/docs/3016/reference/beats/filebeat/how-filebeat-works#at-least-once-delivery) without buffering within the application, thus no risk of out of memory errors or lost events. There’s also the option to use either the JSON logs or plain-text logs as a fallback.
The application does not need to know the details of the logging backend (URI, credentials, etc.). You can also leverage alternative [Filebeat outputs](https://docs-v3-preview.elastic.dev/elastic/docs-builder/docs/3016/reference/beats/filebeat/configuring-output), like Logstash, Kafka or Redis.
Leverage Filebeat’s default [index lifecycle management settings](https://docs-v3-preview.elastic.dev/elastic/docs-builder/docs/3016/reference/beats/filebeat/ilm). This is much more efficient than using daily indices.
Leverage Filebeat’s default ECS-compatible [index template](https://docs-v3-preview.elastic.dev/elastic/docs-builder/docs/3016/reference/beats/filebeat/configuration-template).
## Field mapping
### Default fields
These fields are populated by the ECS loggers by default. Some of them, such as the `log.origin.*` fields, may have to be explicitly enabled. Others, such as `process.thread.name`, are not applicable to all languages. Refer to the documentation of the individual loggers for more information.
| ECS field | Description | Example |
|-----------------------------------------------------------------------------------------------------------------------|-----------------------------------------------------------------------------------------------------------------------------------|-------------------------------------------------------------------------------------------------------------|
| [`@timestamp`](https://docs-v3-preview.elastic.dev/elastic/docs-builder/docs/3016/reference/ecs/ecs-base) | The timestamp of the log event. | `"2019-08-06T12:09:12.375Z"` |
| [`log.level`](https://docs-v3-preview.elastic.dev/elastic/docs-builder/docs/3016/reference/ecs/ecs-log) | The level or severity of the log event. | `"INFO"` |
| [`log.logger`](https://docs-v3-preview.elastic.dev/elastic/docs-builder/docs/3016/reference/ecs/ecs-log) | The name of the logger inside an application. | `"org.example.MyClass"` |
| [`log.origin.file.name`](https://docs-v3-preview.elastic.dev/elastic/docs-builder/docs/3016/reference/ecs/ecs-log) | The name of the file containing the source code which originated the log event. | `"App.java"` |
| [`log.origin.file.line`](https://docs-v3-preview.elastic.dev/elastic/docs-builder/docs/3016/reference/ecs/ecs-log) | The line number of the file containing the source code which originated the log event. | `42` |
| [`log.origin.function`](https://docs-v3-preview.elastic.dev/elastic/docs-builder/docs/3016/reference/ecs/ecs-log) | The name of the function or method which originated the log event. | `"methodName"` |
| [`message`](https://docs-v3-preview.elastic.dev/elastic/docs-builder/docs/3016/reference/ecs/ecs-base) | The log message. | `"Hello World!"` |
| [`error.type`](https://docs-v3-preview.elastic.dev/elastic/docs-builder/docs/3016/reference/ecs/ecs-error) | Only present for logs that contain an exception or error. The type or class of the error if this log event contains an exception. | `"java.lang.NullPointerException"` |
| [`error.message`](https://docs-v3-preview.elastic.dev/elastic/docs-builder/docs/3016/reference/ecs/ecs-error) | Only present for logs that contain an exception or error. The message of the exception or error. | `"The argument cannot be null"` |
| [`error.stack_trace`](https://docs-v3-preview.elastic.dev/elastic/docs-builder/docs/3016/reference/ecs/ecs-error) | Only present for logs that contain an exception or error. The full stack trace of the exception or error as a raw string. | `"Exception in thread "main" java.lang.NullPointerException\n\tat org.example.App.methodName(App.java:42)"` |
| [`process.thread.name`](https://docs-v3-preview.elastic.dev/elastic/docs-builder/docs/3016/reference/ecs/ecs-process) | The name of the thread the event has been logged from. | `"main"` |
### Configurable fields
Refer to the documentation of the individual loggers on how to set these fields.
| ECS field | Description | Example |
|-----------------------------------------------------------------------------------------------------------------------|------------------------------------------------------------------------------------------------------------------------------------------------------------------|-------------------------|
| [`service.name`](https://docs-v3-preview.elastic.dev/elastic/docs-builder/docs/3016/reference/ecs/ecs-service) | Helps to filter the logs by service. | `"my-service"` |
| [`service.version`](https://docs-v3-preview.elastic.dev/elastic/docs-builder/docs/3016/reference/ecs/ecs-service) | Helps to filter the logs by service version. | `"1.0"` |
| [`service.environment`](https://docs-v3-preview.elastic.dev/elastic/docs-builder/docs/3016/reference/ecs/ecs-service) | Helps to filter the logs by environment. | `"production"` |
| [`service.node.name`](https://docs-v3-preview.elastic.dev/elastic/docs-builder/docs/3016/reference/ecs/ecs-service) | Allow for two nodes of the same service, on the same host to be differentiated. | `"instance-0000000016"` |
| [`event.dataset`](https://docs-v3-preview.elastic.dev/elastic/docs-builder/docs/3016/reference/ecs/ecs-event) | Enables the [log rate anomaly detection](https://docs-v3-preview.elastic.dev/elastic/docs-builder/docs/3016/solutions/observability/logs/inspect-log-anomalies). | `"my-service"` |
### Custom fields
Most loggers allow you to add additional custom fields. This includes both, static and dynamic ones. Examples for dynamic fields are logging structured objects, or fields from a thread local context, such as `MDC` or `ThreadContext`.
When adding custom fields, we recommend using existing [ECS fields](https://docs-v3-preview.elastic.dev/elastic/docs-builder/docs/3016/reference/ecs/ecs-field-reference) for these custom values. If there is no appropriate ECS field, consider prefixing your fields with `labels.`, as in `labels.foo`, for simple key/value pairs. For nested structures, consider prefixing with `custom.`. This approach protects against conflicts in case ECS later adds the same fields but with a different mapping.