---
title: Tutorial 1: Install a self-managed Elastic Stack
description: This tutorial demonstrates how to install and configure the latest 9.3.2 version of the Elastic Stack in a self-managed environment. Following these steps...
url: https://docs-v3-preview.elastic.dev/elastic/docs-content/pull/5659/deploy-manage/deploy/self-managed/tutorial-self-managed-install
products:
- Elastic Stack
- Elasticsearch
- Kibana
applies_to:
- Self-managed Elastic deployments: Generally available
---
# Tutorial 1: Install a self-managed Elastic Stack
This tutorial demonstrates how to install and configure the latest 9.3.2 version of the Elastic Stack in a self-managed environment. Following these steps sets up a three node Elasticsearch cluster, with Kibana, Fleet Server, and Elastic Agent, each on separate hosts. The Elastic Agent is configured with the System integration, enabling it to gather local system logs and metrics and deliver them into the Elasticsearch cluster. Finally, the tutorial shows how to view the system data in Kibana.
This installation flow relies on the Elasticsearch [automatic security setup](https://docs-v3-preview.elastic.dev/elastic/docs-content/pull/5659/deploy-manage/security/self-auto-setup), which secures Elasticsearch by default during the initial installation.If you plan to use custom certificates (for example, corporate-provided or publicly trusted certificates), or if you need to configure HTTPS for browser-to-Kibana communication, you can follow this tutorial in combination with [Tutorial 2: Customize certificates for a self-managed Elastic Stack](https://docs-v3-preview.elastic.dev/elastic/docs-content/pull/5659/deploy-manage/deploy/self-managed/tutorial-self-managed-secure) at the appropriate stage of the installation.For more details, refer to [Security overview](#security-overview).
It should take between one and two hours to complete these steps.
- [Prerequisites and assumptions](#install-stack-self-prereqs)
- [Elastic Stack overview](#install-stack-self-overview)
- [Security overview](#security-overview)
- [Step 1: Set up the first Elasticsearch node](#install-stack-self-elasticsearch-first)
- [Step 2: Configure the first Elasticsearch node for connectivity](#install-stack-self-elasticsearch-config)
- [Step 3: Start Elasticsearch](#install-stack-self-elasticsearch-start)
- [Step 4: Set up a second Elasticsearch node](#install-stack-self-elasticsearch-second)
- [Step 5: Set up additional Elasticsearch nodes](#install-stack-self-elasticsearch-third)
- [Step 6: Install Kibana](#install-stack-self-kibana)
- [Step 7: Install Fleet Server](#install-stack-self-fleet-server)
- [Step 8: Install Elastic Agent](#install-stack-self-elastic-agent)
- [Step 9: View your system data](#install-stack-self-view-data)
- [Next steps](#install-stack-self-next-steps)
## Prerequisites and assumptions
To get started, you need the following:
- A set of virtual or physical hosts on which to install each stack component.
- On each host, a super user account with `sudo` privileges.
The examples in this guide use RPM Package Manager (RPM) packages to install the Elastic Stack 9.3.2 components on hosts running Red Hat Enterprise Linux 8. The steps for other install methods and operating systems are similar, and can be found in the documentation linked from each section. The packages to install are:
- [[https://artifacts.elastic.co/downloads/elasticsearch/elasticsearch-9.3.2-x86_64.rpm](https://artifacts.elastic.co/downloads/elasticsearch/elasticsearch-9.3.2-x86_64.rpm)](https://artifacts.elastic.co/downloads/elasticsearch/elasticsearch-9.3.2-x86_64.rpm)
- [[https://artifacts.elastic.co/downloads/kibana/kibana-9.3.2-x86_64.rpm](https://artifacts.elastic.co/downloads/kibana/kibana-9.3.2-x86_64.rpm)](https://artifacts.elastic.co/downloads/kibana/kibana-9.3.2-x86_64.rpm)
- [[https://artifacts.elastic.co/downloads/beats/elastic-agent/elastic-agent-9.3.2-linux-x86_64.tar.gz](https://artifacts.elastic.co/downloads/beats/elastic-agent/elastic-agent-9.3.2-linux-x86_64.tar.gz)](https://artifacts.elastic.co/downloads/beats/elastic-agent/elastic-agent-9.3.2-linux-x86_64.tar.gz)
For Elastic Agent and Fleet Server (both of which use the elastic-agent-9.3.2-linux-x86_64.tar.gz package) we recommend using TAR/ZIP packages over RPM/DEB system packages, since only the former support upgrading using Fleet.
Special considerations such as firewalls and proxy servers are not covered here.
For the basic ports and protocols required for the installation to work, refer to the following overview section.
## Elastic Stack overview
Before starting, take a moment to familiarize yourself with the Elastic Stack components.
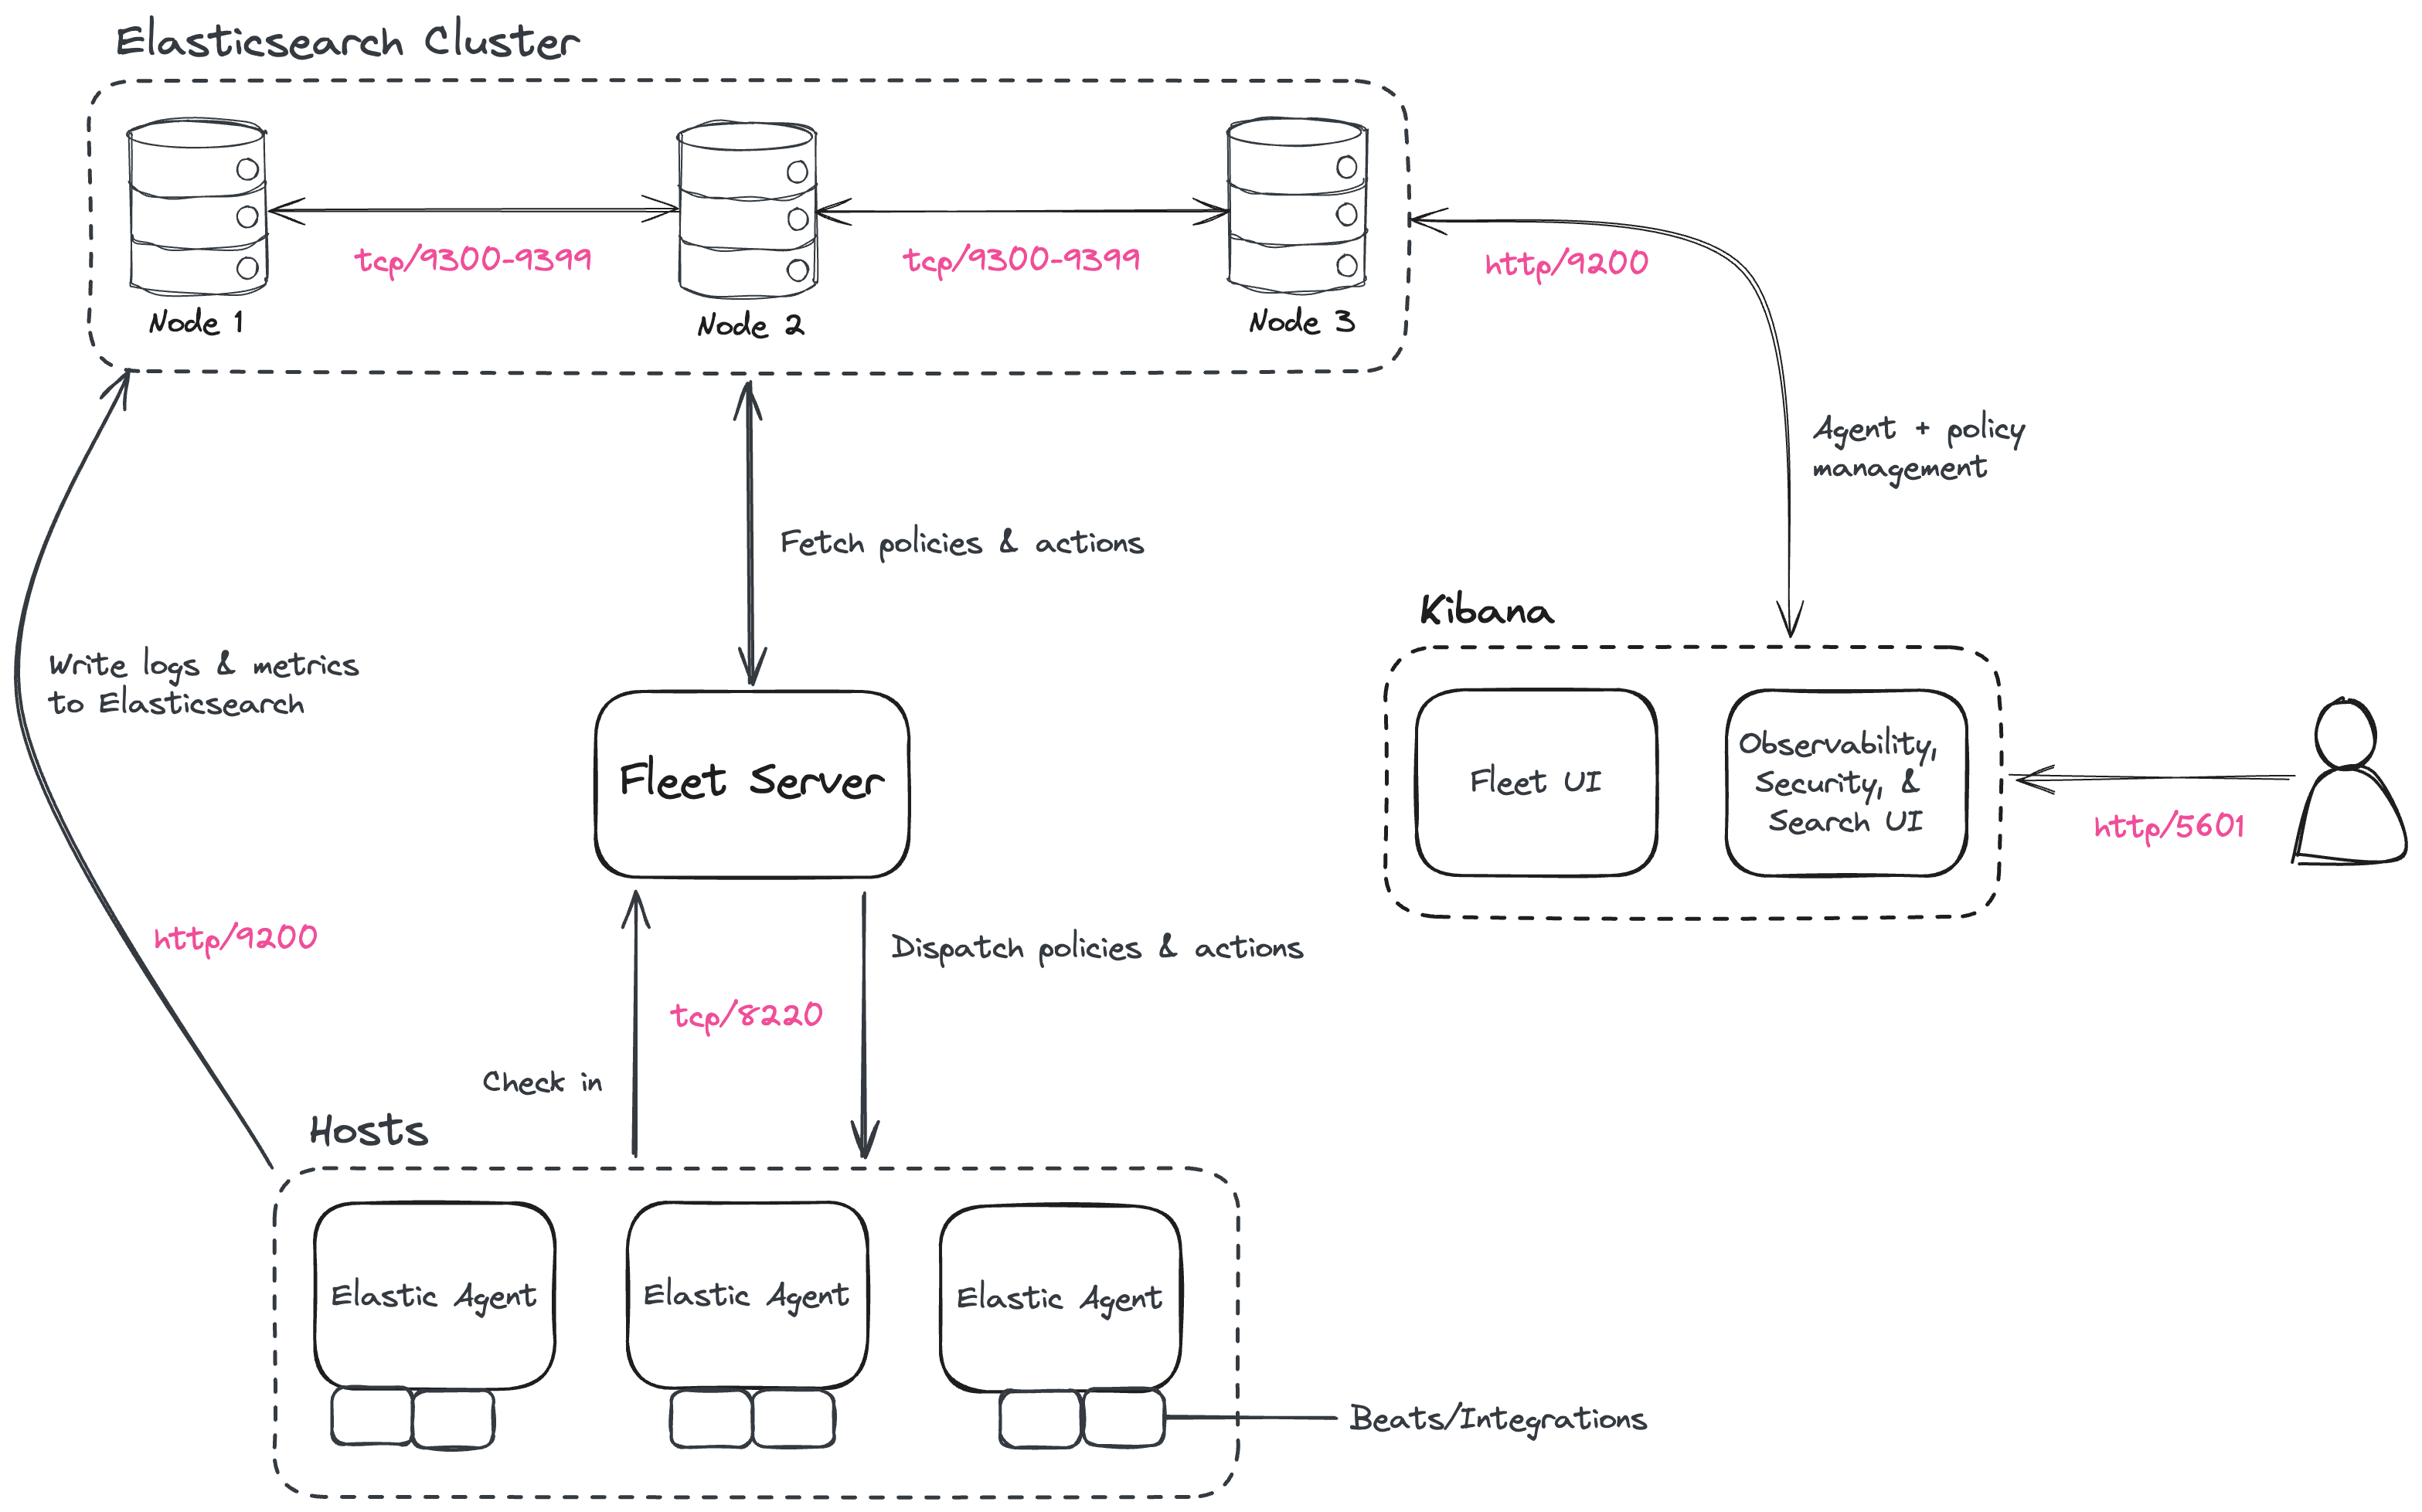
To learn more about the Elastic Stack and how each of these components are related, refer to [An overview of the Elastic Stack](https://docs-v3-preview.elastic.dev/elastic/docs-content/pull/5659/get-started/the-stack).
## Security overview
This tutorial results in a secure-by-default environment, but not every connection uses the same certificate model. Before you begin, it helps to understand the security layout produced by these steps:
- Elasticsearch uses the [automatic security setup](https://docs-v3-preview.elastic.dev/elastic/docs-content/pull/5659/deploy-manage/security/self-auto-setup) during the initial installation flow. This process generates certificates and enables TLS for both the transport and HTTP layers.
- Kibana connects to Elasticsearch using the enrollment flow from the initial Elasticsearch setup.
- HTTPS for browser-to-Kibana communication is **not configured** in this tutorial, although it is strongly recommended for production environments. Kibana HTTPS is covered in [Tutorial 2: Customize certificates for a self-managed Elastic Stack](https://docs-v3-preview.elastic.dev/elastic/docs-content/pull/5659/deploy-manage/deploy/self-managed/tutorial-self-managed-secure).
- Fleet Server is installed using the Quick Start flow, which uses a self-signed certificate for its HTTPS endpoint.
- Elastic Agent enrolls using that Quick Start flow, which is why the generated install command includes the `--insecure` flag.
If you plan to use certificates signed by your organization's certificate authority or by a public CA, complete this tutorial until Kibana is installed (Step 6), and then continue with [Tutorial 2: Customize certificates for a self-managed Elastic Stack](https://docs-v3-preview.elastic.dev/elastic/docs-content/pull/5659/deploy-manage/deploy/self-managed/tutorial-self-managed-secure) before installing Fleet Server and Elastic Agent.
## Step 1: Set up the first Elasticsearch node
To begin, use RPM to install Elasticsearch on the first host. This initial Elasticsearch instance bootstraps a new cluster.
1. Log in to the host where you'd like to set up your first Elasticsearch node.
2. Create a working directory for the installation package:
```shell
mkdir elastic-install-files
```
3. Change into the new directory:
```shell
cd elastic-install-files
```
4. Download the Elasticsearch RPM and checksum file from the Elastic Artifact Registry. You can find details about these steps in the section [Download and install the RPM manually](https://docs-v3-preview.elastic.dev/elastic/docs-content/pull/5659/deploy-manage/deploy/self-managed/install-elasticsearch-with-rpm).
```shell
wget https://artifacts.elastic.co/downloads/elasticsearch/elasticsearch-9.3.2-x86_64.rpm
wget https://artifacts.elastic.co/downloads/elasticsearch/elasticsearch-9.3.2-x86_64.rpm.sha512
```
5. Confirm the validity of the downloaded package by checking the SHA of the downloaded RPM against the published checksum:
```shell
shasum -a 512 -c elasticsearch-9.3.2-x86_64.rpm.sha512
```
The command should return:
```shell
elasticsearch-9.3.2-x86_64.rpm: OK.
```
6. Run the Elasticsearch install command:
```shell
sudo rpm --install elasticsearch-9.3.2-x86_64.rpm
```
The Elasticsearch install process enables certain security features by default, including the following:
- Authentication and authorization are enabled, including a built-in `elastic` superuser account.
- Certificates and keys for TLS are generated for the transport and HTTP layer, and TLS is enabled and configured with these keys and certificates.
7. Copy the terminal output from the install command to a local file. In particular, you need the password for the built-in `elastic` superuser account. The output also contains the commands to enable Elasticsearch to run as a service, which you use in the next step.
8. Run the following two commands to enable Elasticsearch to run as a service using `systemd`. This enables Elasticsearch to start automatically when the host system reboots. You can find details about this and the following steps in [Running Elasticsearch with `systemd`](/elastic/docs-content/pull/5659/deploy-manage/deploy/self-managed/install-elasticsearch-with-rpm#running-systemd).
```shell
sudo systemctl daemon-reload
sudo systemctl enable elasticsearch.service
```
## Step 2: Configure the first Elasticsearch node for connectivity
Before moving ahead to configure additional Elasticsearch nodes, you need to update the Elasticsearch configuration on this first node so that other hosts are able to connect to it. This is done by updating the settings in the `elasticsearch.yml` file. For details about all available settings refer to [Configure Elasticsearch](https://docs-v3-preview.elastic.dev/elastic/docs-content/pull/5659/deploy-manage/deploy/self-managed/configure-elasticsearch).
1. In a terminal, run the `ifconfig` command and copy the value shown for the host IP address (for example, `10.128.0.84`). You need this value later.
2. Open the Elasticsearch configuration file in a text editor, such as `vim`:
```shell
sudo vim /etc/elasticsearch/elasticsearch.yml
```
3. In a multi-node Elasticsearch cluster, all of the Elasticsearch instances need to have the same name.
In the configuration file, uncomment the line `#cluster.name: my-application` and give the Elasticsearch instance any name that you'd like:
```yaml
cluster.name: elasticsearch-demo
```
4. By default, Elasticsearch listens for traffic on `localhost`. In order for Elasticsearch instances on other nodes to be able to join the cluster, you need to set up Elasticsearch to listen on a routable, external IP address.
Uncomment the line `#network.host: 192.168.0.1` and replace the default address with the value that you copied from the `ifconfig` command output. For example:
```yaml
network.host: 10.128.0.84
```
5. Elasticsearch needs to be enabled to listen for connections from other, external hosts.
Uncomment the line `#transport.host: 0.0.0.0`. The `0.0.0.0` setting enables Elasticsearch to listen for connections on all available network interfaces. In a production environment you might want to restrict this by setting this value to match the value set for `network.host`.
```yaml
transport.host: 0.0.0.0
```
You can find details about the `network.host` and `transport.host` settings in the Elasticsearch [Networking](https://docs-v3-preview.elastic.dev/elastic/elasticsearch/tree/main/reference/elasticsearch/configuration-reference/networking-settings) documentation.
6. Save your changes and close the editor.
## Step 3: Start Elasticsearch
1. Now, it's time to start the Elasticsearch service:
```shell
sudo systemctl start elasticsearch.service
```
If you need to, you can stop the service by running `sudo systemctl stop elasticsearch.service`.
2. Make sure that Elasticsearch is running properly.
```shell
sudo curl --cacert /etc/elasticsearch/certs/http_ca.crt -u elastic:$ELASTIC_PASSWORD https://localhost:9200
```
In the command, replace `$ELASTIC_PASSWORD` with the `elastic` superuser password that you copied from the install command output.
If all is well, the command returns a response like this:
```json
{
"name" : "Cp9oae6",
"cluster_name" : "elasticsearch",
"cluster_uuid" : "AT69_C_DTp-1qgIJlatQqA",
"version" : {
"number" : "{version_qualified}",
"build_type" : "{build_type}",
"build_hash" : "f27399d",
"build_flavor" : "default",
"build_date" : "2016-03-30T09:51:41.449Z",
"build_snapshot" : false,
"lucene_version" : "{lucene_version}",
"minimum_wire_compatibility_version" : "1.2.3",
"minimum_index_compatibility_version" : "1.2.3"
},
"tagline" : "You Know, for Search"
}
```
3. Finally, check the status of Elasticsearch:
```shell
sudo systemctl status elasticsearch
```
As with the previous `curl` command, the output should confirm that Elasticsearch started successfully. Type `q` to exit from the `status` command results.
## Step 4: Set up a second Elasticsearch node
To set up a second Elasticsearch node, the initial steps are similar to those that you followed for [Step 1: Set up the first Elasticsearch node](#install-stack-self-elasticsearch-first).
1. Log in to the host where you'd like to set up your second Elasticsearch instance.
2. Create a working directory for the installation package:
```shell
mkdir elastic-install-files
```
3. Change into the new directory:
```shell
cd elastic-install-files
```
4. Download the Elasticsearch RPM and checksum file:
```shell
wget https://artifacts.elastic.co/downloads/elasticsearch/elasticsearch-9.3.2-x86_64.rpm
wget https://artifacts.elastic.co/downloads/elasticsearch/elasticsearch-9.3.2-x86_64.rpm.sha512
```
5. Check the SHA of the downloaded RPM:
```shell
shasum -a 512 -c elasticsearch-9.3.2-x86_64.rpm.sha512
```
6. Run the Elasticsearch install command:
```shell
sudo rpm --install elasticsearch-9.3.2-x86_64.rpm
```
Unlike the setup for the first Elasticsearch node, in this case you don't need to copy the output of the install command, since these settings are updated in a later step.
7. Enable Elasticsearch to run as a service:
```shell
sudo systemctl daemon-reload
sudo systemctl enable elasticsearch.service
```
Don't start the Elasticsearch service yet! There are a few more configuration steps to do before restarting.
8. To enable this second Elasticsearch node to connect to the first, you need to configure an enrollment token.
Be sure to run these configuration steps before starting the Elasticsearch service. You can find additional details about these steps in [Reconfigure a node to join an existing cluster](/elastic/docs-content/pull/5659/deploy-manage/deploy/self-managed/install-elasticsearch-with-rpm#existing-cluster).
Return to your terminal shell on the first Elasticsearch node and generate a node enrollment token:
```shell
sudo /usr/share/elasticsearch/bin/elasticsearch-create-enrollment-token -s node
```
9. Copy the generated enrollment token from the command output.
An enrollment token has a lifespan of 30 minutes. In case the `elasticsearch-reconfigure-node` command returns an `Invalid enrollment token` error, try generating a new token.Be sure not to confuse an [Elasticsearch enrollment token](/elastic/docs-content/pull/5659/deploy-manage/deploy/self-managed/install-elasticsearch-with-rpm#existing-cluster) (for enrolling Elasticsearch nodes in an existing cluster) with a [Kibana enrollment token](/elastic/docs-content/pull/5659/deploy-manage/maintenance/start-stop-services/start-stop-kibana#run-kibana-from-command-line) (to enroll your Kibana instance with Elasticsearch, as described in the next section). These two tokens are not interchangeable.
10. In the terminal shell for your second Elasticsearch node, pass the enrollment token as a parameter to the `elasticsearch-reconfigure-node` tool:
```shell
sudo /usr/share/elasticsearch/bin/elasticsearch-reconfigure-node --enrollment-token
```
In the command, replace `` with the `elastic` generated token that you copied.
11. Answer the `Do you want to continue` prompt with `yes` (`y`). The new Elasticsearch node is reconfigured.
12. In a terminal, run `ifconfig` and copy the value shown for the host IP address. You need this value later.
13. Open the second Elasticsearch instance configuration file in a text editor:
```shell
sudo vim /etc/elasticsearch/elasticsearch.yml
```
Notice that, as a result of having run the `elasticsearch-reconfigure-node` tool, certain settings have been updated. For example:
- The `transport.host: 0.0.0.0` setting is already uncommented.
- The `discovery_seed.hosts` setting has the value that you added for `network_host` on the first Elasticsearch node. As you add each new Elasticsearch node to the cluster, the `discovery_seed.hosts` setting contains an array of the IP addresses and port numbers to connect to each Elasticsearch node that was previously added to the cluster.
14. In the configuration file, uncomment the line `#cluster.name: my-application` and set it to match the name you specified for the first Elasticsearch node:
```yaml
cluster.name: elasticsearch-demo
```
15. As with the first Elasticsearch node, you need to set up Elasticsearch to listen on a routable, external IP address. Uncomment the line `#network.host: 192.168.0.1` and replace the default address with the value that you copied. For example:
```yaml
network.host: 10.128.0.132
```
16. Save your changes and close the editor.
17. Start Elasticsearch on the second node:
```shell
sudo systemctl start elasticsearch.service
```
18. **Optionally,** to view the progress as the second Elasticsearch node starts up and connects to the first Elasticsearch node, open a new terminal into the second node and `tail` the Elasticsearch log file:
```shell
sudo tail -f /var/log/elasticsearch/elasticsearch-demo.log
```
Notice in the log file some helpful diagnostics, such as:
- `Security is enabled`
- `Profiling is enabled`
- `using discovery type [multi-node]`
- `initialized`
- `starting...`
After a minute or so, the log should show a message like:
```text
[] master node changed {previous [], current [...]}
```
Here, `hostname1` is your first Elasticsearch instance node, and `hostname2` is your second Elasticsearch instance node.
The message indicates that the second Elasticsearch node has successfully contacted the initial Elasticsearch node and joined the cluster.
19. As a final check, run the following `curl` request on the new node to confirm that Elasticsearch is still running properly and viewable at the new node's `localhost` IP address. You need to replace `$ELASTIC_PASSWORD` with the same `elastic` superuser password that you used on the first Elasticsearch node.
```shell
sudo curl --cacert /etc/elasticsearch/certs/http_ca.crt -u elastic:$ELASTIC_PASSWORD https://localhost:9200
```
Response example:
```json
{
"name" : "Cp9oae6",
"cluster_name" : "elasticsearch",
"cluster_uuid" : "AT69_C_DTp-1qgIJlatQqA",
"version" : {
"number" : "{version_qualified}",
"build_type" : "{build_type}",
"build_hash" : "f27399d",
"build_flavor" : "default",
"build_date" : "2016-03-30T09:51:41.449Z",
"build_snapshot" : false,
"lucene_version" : "{lucene_version}",
"minimum_wire_compatibility_version" : "1.2.3",
"minimum_index_compatibility_version" : "1.2.3"
},
"tagline" : "You Know, for Search"
}
```
## Step 5: Set up additional Elasticsearch nodes
To set up your next Elasticsearch node, follow exactly the same steps as you did previously in [Step 4: Set up a second Elasticsearch node](#install-stack-self-elasticsearch-second). The process is identical for each additional Elasticsearch node that you would like to add to the cluster. As a recommended best practice, create a new enrollment token for each new node that you add.
## Step 6: Install Kibana
As with Elasticsearch, you can use RPM to install Kibana on another host. You can find details about all of the following steps in the section [Install Kibana with RPM](https://docs-v3-preview.elastic.dev/elastic/docs-content/pull/5659/deploy-manage/deploy/self-managed/install-kibana-with-rpm).
1. Log in to the host where you'd like to install Kibana and create a working directory for the installation package:
```shell
mkdir kibana-install-files
```
2. Change into the new directory:
```shell
cd kibana-install-files
```
3. Download the Kibana RPM and checksum file from the Elastic website.
```shell
wget https://artifacts.elastic.co/downloads/kibana/kibana-9.3.2-x86_64.rpm
wget https://artifacts.elastic.co/downloads/kibana/kibana-9.3.2-x86_64.rpm.sha512
```
4. Confirm the validity of the downloaded package by checking the SHA of the downloaded RPM against the published checksum:
```shell
shasum -a 512 -c kibana-9.3.2-x86_64.rpm.sha512
```
The command should return:
```shell
kibana-9.3.2-x86_64.rpm: OK
```
5. Run the Kibana install command:
```shell
sudo rpm --install kibana-9.3.2-x86_64.rpm
```
6. As with each additional Elasticsearch node that you added, to enable this Kibana instance to connect to the first Elasticsearch node, you need to configure an enrollment token. Return to your terminal shell into the first Elasticsearch node.
7. Run the `elasticsearch-create-enrollment-token` command with the `-s kibana` option to generate a Kibana enrollment token:
```shell
sudo /usr/share/elasticsearch/bin/elasticsearch-create-enrollment-token -s kibana
```
8. Copy the generated enrollment token from the command output.
9. Back on the Kibana host, run the following two commands to enable Kibana to run as a service using `systemd`, enabling Kibana to start automatically when the host system reboots.
```shell
sudo systemctl daemon-reload
sudo systemctl enable kibana.service
```
10. Before starting the Kibana service, update the configuration so that Kibana listens on its own host IP address. This is done by updating the settings in the `kibana.yml` file. For details about all available settings refer to [Kibana configuration reference](https://docs-v3-preview.elastic.dev/elastic/kibana/tree/main/reference/configuration-reference).
11. In a terminal, run the `ifconfig` command and copy the value shown for the host IP address.
12. Open the Kibana configuration file for editing:
```shell
sudo vim /etc/kibana/kibana.yml
```
13. Uncomment the line `#server.host: localhost` and replace the default address with the host IP address that you copied from the `ifconfig` command. For example:
```yaml
server.host: 10.128.0.28
```
14. Save your changes and close the editor.
15. Start the Kibana service:
```shell
sudo systemctl start kibana.service
```
If you need to, you can stop the service by running `sudo systemctl stop kibana.service`.
16. Run the `status` command to get details about the Kibana service.
```shell
sudo systemctl status kibana
```
17. In the `status` command output, a URL is shown with:
- a host address to access Kibana
- a six digit verification code
For example:
```text
Kibana has not been configured.
Go to http://10.128.0.28:5601/?code= to get started.
```
Make a note of the verification code.
18. Open a web browser to the external IP address of the Kibana host machine, for example: `http://:5601`.
It can take a minute or two for Kibana to start up, so refresh the page if you don't see a prompt right away.
19. When Kibana starts you're prompted to provide an enrollment token. Paste in the Kibana enrollment token that you generated earlier.
20. Click **Configure Elastic**.
21. If you're prompted to provide a verification code, copy and paste in the six digit code that was returned by the `status` command. Then, wait for the setup to complete.
22. When you see the **Welcome to Elastic** page, provide the `elastic` as the username and provide the password that you copied in Step 1, from the `install` command output when you set up your first Elasticsearch node.
23. Click **Log in**.
Kibana is now fully set up and communicating with your Elasticsearch cluster!
This tutorial already uses the Elasticsearch [automatic security setup](https://docs-v3-preview.elastic.dev/elastic/docs-content/pull/5659/deploy-manage/security/self-auto-setup), which configures security for Elasticsearch by default, including TLS for both the transport and HTTP layers.If you plan to use certificates signed by your organization's certificate authority or by a public CA instead, stop here after installing Kibana and continue with [Tutorial 2: Customize certificates for a self-managed Elastic Stack](https://docs-v3-preview.elastic.dev/elastic/docs-content/pull/5659/deploy-manage/deploy/self-managed/tutorial-self-managed-secure). That tutorial is the right place to replace or adjust the default certificate configuration before installing Fleet Server and Elastic Agent.Following that path avoids installing Fleet Server and Elastic Agent with the certificate setup from this tutorial and then needing to reinstall the components after changing the security configuration.Note also that the automatic setup used here does not configure HTTPS for browser access to Kibana, which is highly recommended for production environments.
## Step 7: Install Fleet Server
Now that Kibana is up and running, you can install Fleet Server, which manages the Elastic Agent installed later in this tutorial. If you need more detail about these steps, refer to [Deploy on-premises and self-managed](https://docs-v3-preview.elastic.dev/elastic/docs-content/pull/5659/reference/fleet/add-fleet-server-on-prem) in the Fleet and Elastic Agent Guide.
1. Log in to the host where you'd like to set up Fleet Server.
2. Create a working directory for the installation package:
```shell
mkdir fleet-install-files
```
3. Change into the new directory:
```shell
cd fleet-install-files
```
4. In the terminal, run `ifconfig` and copy the value shown for the host IP address (for example, `10.128.0.84`). You need this value later.
5. Back to your web browser, open the Kibana menu and go to **Management -> Fleet**. Fleet opens with a message that you need to add a Fleet Server.
6. Click **Add Fleet Server**. The **Add a Fleet Server** flyout opens.
7. In the flyout, select the **Quick Start** tab.
8. Specify a name for your Fleet Server host, for example `Fleet Server`.
9. Specify the host URL that Elastic Agents need to use to reach the Fleet Server, for example: `https://10.128.0.203:8220`. This is the host IP address that you copied from the `ifconfig` output.
Be sure to include the port number. Port `8220` is the default used by Fleet Server in an on-premises environment. Refer to [Default port assignments](/elastic/docs-content/pull/5659/reference/fleet/add-fleet-server-on-prem#default-port-assignments-on-prem) in the on-premises Fleet Server install documentation for a list of port assignments.
10. Click **Generate Fleet Server policy**. A policy is created that contains all of the configuration settings for the Fleet Server instance.
11. On the **Install Fleet Server to a centralized host** step, for this example we select the **Linux Tar** tab, but you can instead select the tab appropriate to the host operating system where you're setting up Fleet Server. TAR/ZIP packages are recommended over RPM/DEB system packages, since only the former support upgrading Fleet Server using Fleet.
12. Copy the generated commands and then run them one-by-one in the terminal on your Fleet Server host. These commands do the following:
- Download the Fleet Server package from the Elastic Artifact Registry
- Unpack the package archive
- Change into the directory containing the install binaries
- Install Fleet Server.
If you'd like to learn about the install command options, refer to [`elastic-agent install`](/elastic/docs-content/pull/5659/reference/fleet/agent-command-reference#elastic-agent-install-command) in the Elastic Agent command reference.
13. At the prompt, enter `Y` to install Elastic Agent and run it as a service. Wait for the installation to complete.
14. In the Kibana **Add a Fleet Server** flyout, wait for confirmation that Fleet Server has connected.
15. For now, ignore the **Continue enrolling Elastic Agent** option and close the flyout.
Fleet Server is now fully set up!
## Step 8: Install Elastic Agent
Next, install Elastic Agent on another host and use the System integration to monitor system logs and metrics.
1. Log in to the host where you'd like to set up Elastic Agent.
2. Create a working directory for the installation package:
```shell
mkdir agent-install-files
```
3. Change into the new directory:
```shell
cd agent-install-files
```
4. Open Kibana and go to **Management -> Fleet**.
5. On the **Agents** tab, you should see your new Fleet Server policy running with a healthy status.
6. Open the **Settings** tab.
7. Reopen the **Agents** tab and select **Add agent**. The **Add agent** flyout opens.
8. In the flyout, choose a policy name, for example `Demo Agent Policy`.
9. Leave **Collect system logs and metrics** enabled. This adds the [System integration](https://docs.elastic.co/integrations/system) to the Elastic Agent policy.
10. Click **Create policy**.
11. For the **Enroll in Fleet?** step, leave **Enroll in Fleet** selected.
12. On the **Install Elastic Agent on your host** step, for this example we select the **Linux Tar** tab, but you can instead select the tab appropriate to the host operating system where you're setting up Elastic Agent.
As with Fleet Server, note that TAR/ZIP packages are recommended over RPM/DEB system packages, since only the former support upgrading Elastic Agent using Fleet.
13. Copy the generated commands.
14. In the `sudo ./elastic-agent install` command, make two changes:
- For the `--url` parameter, check that the port number is set to `8220` (used for on-premises Fleet Server).
- Append an `--insecure` flag at the end.
If you want to set up secure communications using custom SSL certificates, refer to [Tutorial 2: Customize certificates for a self-managed Elastic Stack](https://docs-v3-preview.elastic.dev/elastic/docs-content/pull/5659/deploy-manage/deploy/self-managed/tutorial-self-managed-secure).
The result should be like the following:
```shell
sudo ./elastic-agent install --url=https://10.128.0.203:8220 --enrollment-token=VWCobFhKd0JuUnppVYQxX0VKV5E6UmU3BGk0ck9RM2HzbWEmcS4Bc1YUUM== --insecure
```
15. Run the commands one-by-one in the terminal on your Elastic Agent host. The commands do the following:
- Download the Elastic Agent package from the Elastic Artifact Registry.
- Unpack the package archive.
- Change into the directory containing the install binaries.
- Install Elastic Agent.
16. At the prompt, enter `Y` to install Elastic Agent and run it as a service. Wait for the installation to complete:
```text
Elastic Agent has been successfully installed.
```
17. In the Kibana **Add agent** flyout, wait for confirmation that Elastic Agent has connected.
18. Close the flyout.
Your new Elastic Agent is now installed and enrolled with Fleet Server.
## Step 9: View your system data
Now that all of the components have been installed, it's time to view your system data.
**View your system log data:**
1. Open the Kibana menu and go to **Analytics -> Dashboard**.
2. In the query field, search for `Logs System`.
3. Select the `[Logs System] Syslog dashboard` link. The Kibana Dashboard opens with visualizations of Syslog events, hostnames and processes, and more.
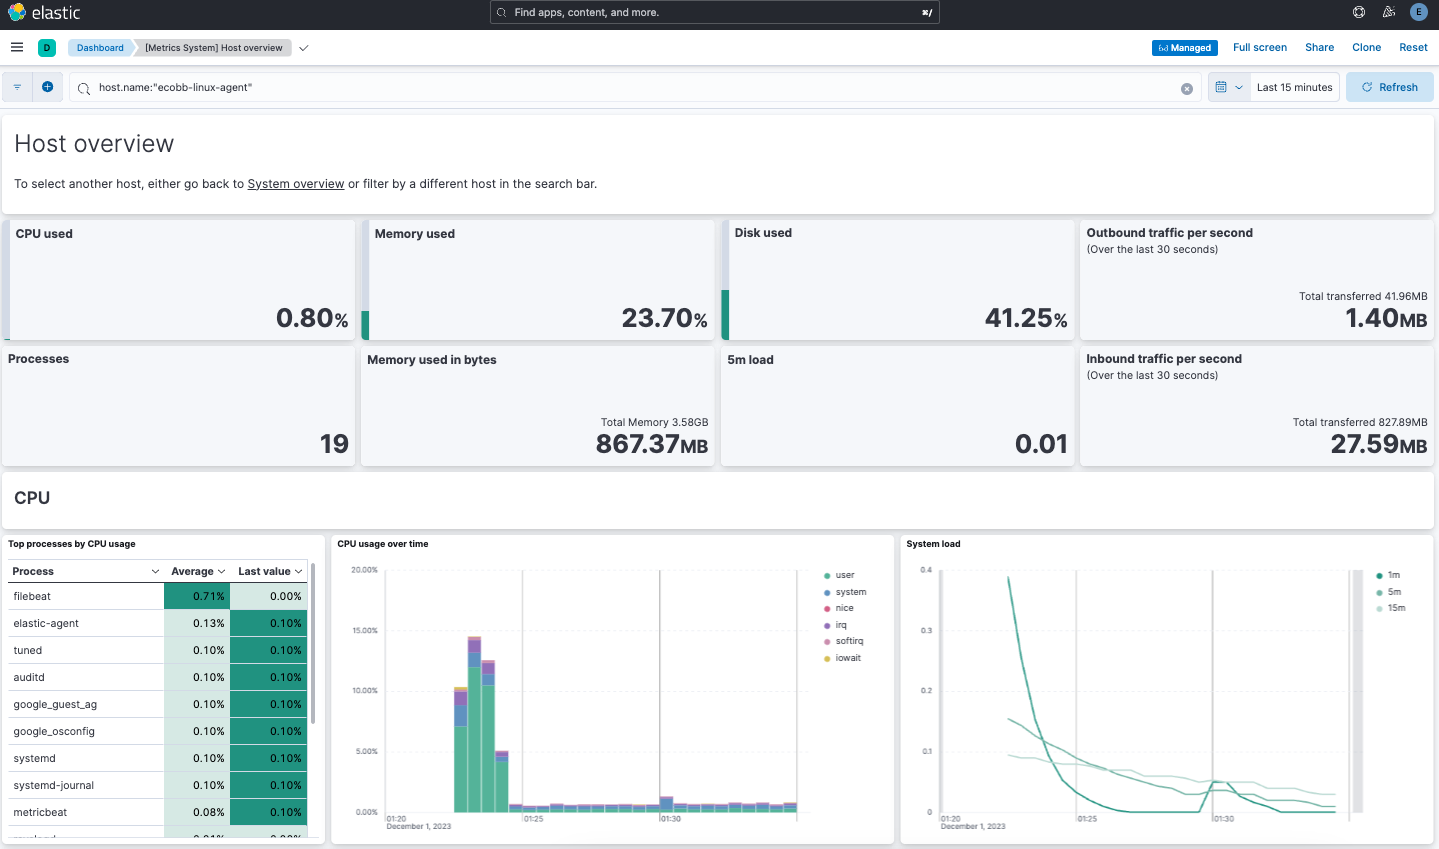
**View your system metrics data:**
1. Open the Kibana menu and return to **Analytics -> Dashboard**.
2. In the query field, search for `Metrics System`.
3. Select the `[Metrics System] Host overview` link. The Kibana Dashboard opens with visualizations of host metrics including CPU usage, memory usage, running processes, and others.
Congratulations! You've successfully set up a three node Elasticsearch cluster, with Kibana, Fleet Server, and Elastic Agent.
## Next steps
Now that you've successfully configured an on-premises Elastic Stack, you can learn how to customize the certificate configuration for the Elastic Stack in a production environment using trusted CA-signed certificates. Refer to [Tutorial 2: Customize certificates for a self-managed Elastic Stack](https://docs-v3-preview.elastic.dev/elastic/docs-content/pull/5659/deploy-manage/deploy/self-managed/tutorial-self-managed-secure) to learn more.
You can also start using your newly set up Elastic Stack right away:
- Do you have data ready to ingest? Learn how to [bring your data to Elastic](https://docs-v3-preview.elastic.dev/elastic/docs-content/pull/5659/manage-data/ingest).
- Use [Elastic Observability](https://docs-v3-preview.elastic.dev/elastic/docs-content/pull/5659/solutions/observability) to unify your logs, infrastructure metrics, uptime, and application performance data.
- Want to protect your endpoints from security threats? Try [Elastic Security](https://docs-v3-preview.elastic.dev/elastic/docs-content/pull/5659/solutions/security). Adding endpoint protection is just another integration that you add to the agent policy!