---
title: Add variable controls to dashboards
description: Create ES|QL-powered variable controls for Kibana dashboards to enable dynamic filtering, multi-value selections, and chained controls.
url: https://docs-v3-preview.elastic.dev/elastic/docs-content/pull/5664/explore-analyze/visualize/add-variable-controls
products:
- Kibana
applies_to:
- Elastic Cloud Serverless: Preview
- Elastic Stack: Preview since 9.0
---
# Add variable controls to dashboards
Variable controls bind interactive controls to variables in your ES|QL visualization queries. Unlike the standard [dashboard controls](https://docs-v3-preview.elastic.dev/elastic/docs-content/pull/5664/explore-analyze/visualize/dashboard-controls) that filter using data view fields, variable controls work directly with ES|QL queries to enable dynamic filtering, grouping, and function selection.
In versions 9.0 and 9.1, variable controls are called ES|QL controls.
## Before you begin
To add variable controls to a dashboard, you need:
- **All** privilege for the **Dashboard** feature in Kibana
- An existing dashboard open in **Edit** mode
- An ES|QL visualization on your dashboard, or the intent to create one
Elastic Cloud Serverless: Generally available Elastic Stack: Generally available since 9.4 A dashboard can hold up to 1,000 top-level items (panels, unpinned controls, and sections) and, separately, up to 100 controls pinned to the top of the dashboard. For the exact limits, refer to [Panel limits](/elastic/docs-content/pull/5664/explore-analyze/dashboards/arrange-panels#dashboard-panel-limits).
## Add variable controls
Variable controls act as variables in your ES|QL visualization queries. On the dashboard, they appear as options lists. A control's options can be:
- Values or fields, either static or defined by a query.
- Elastic Cloud Serverless: Preview Elastic Stack: Preview since 9.1 Functions.
You create a variable control while writing an ES|QL query: the autocomplete suggests adding a control for field values, field names, function configuration, or function names.
On a dashboard, you can also add a variable control directly by selecting **Add** → **Controls** → **Variable control**.
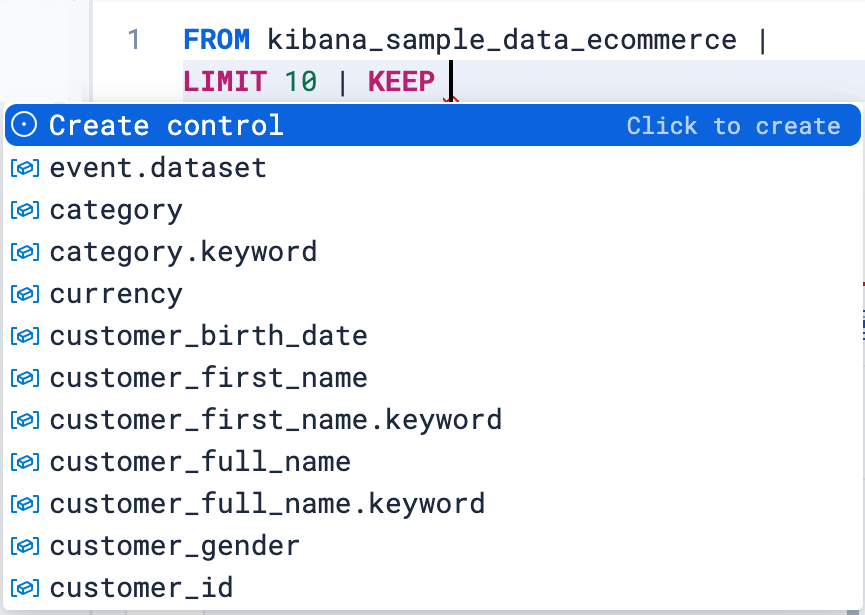
1. While you edit your ES|QL query, the autocomplete menu suggests adding a control when relevant or when you type `?` in the query. Select **Create control**.
2. A flyout opens to let you configure the control. Specify:
- The type of the control:
- For controls with **Static values**, enter available values manually or select them from the dropdown list.
- For controls with **Values from a query**, write an ES|QL query to populate the list of options. Use this option to dynamically retrieve control values or to set up [chained controls](#chain-variable-controls).
To restrict the options to values that exist within the selected time range, add `WHERE @timestamp <= ?_tend AND @timestamp > ?_tstart` to the control's query. If your indices don't have a `@timestamp` field, use [custom time parameters](/elastic/docs-content/pull/5664/explore-analyze/query-filter/languages/esql-kibana#_custom_time_parameters) instead.
- The name of the control. You use this name to reference the control in ES|QL queries.
- Start the name with `?` for options that are static values.
- Elastic Cloud Serverless: Preview Elastic Stack: Preview since 9.1 Start the name with `??` for options that are fields or functions.
- The values users can select. You can add multiple values from suggested fields or type in custom values. If you selected **Values from a query**, write an ES|QL query instead.
- The label of the control. This is the label displayed in **Discover** or in the dashboard.
- Elastic Stack: Preview since 9.3 Elastic Cloud Serverless: Preview Whether the control allows a single selection or multiple selections. Multiple selections require using the [`MV_CONTAINS` or `MV_INTERSECTS`](#esql-multi-values-controls) functions in your query.
3. Save the control.
The control is created. If you created it while editing a query, its variable is inserted into that query, which you can keep editing.
You can reference the control in your ES|QL visualization queries by typing its name.
Where you place a variable control affects which panels it filters. For details, refer to [How controls affect the dashboard](/elastic/docs-content/pull/5664/explore-analyze/visualize/dashboard-controls#controls-scope).
**Examples**
- Filter by a selected value:
```esql
| WHERE field == ?value
```
- Group by a selected field:
```esql
| STATS count = COUNT(*) BY ??field
```
- Adjust a function setting, such as a date histogram interval:
```esql
| STATS count = COUNT(*) BY BUCKET(@timestamp, ?interval)
```
- Switch the aggregation function:
```esql
| STATS metric = ??function
```
## Allow multi-value selections
- Elastic Cloud Serverless: Preview
- Elastic Stack: Preview since 9.3
You can create controls that let users select multiple values. To do that:
1. Add the [`MV_CONTAINS`](https://docs-v3-preview.elastic.dev/elastic/elasticsearch/tree/main/reference/query-languages/esql/functions-operators/mv-functions/mv_contains) function to your query, with the field as the first parameter (superset) and a [variable](#add-variable-control) as the second parameter (subset). For example:
```esql
FROM logs-* | WHERE MV_CONTAINS(field, ?values)
```
Multi-selection is only available for `?values` variables, not for `??fields` or `??functions` variables.[`MV_CONTAINS`](https://docs-v3-preview.elastic.dev/elastic/elasticsearch/tree/main/reference/query-languages/esql/functions-operators/mv-functions/mv_contains) checks that _all_ subset values are present. Use [`MV_INTERSECTS`](https://docs-v3-preview.elastic.dev/elastic/elasticsearch/tree/main/reference/query-languages/esql/functions-operators/mv-functions/mv_intersects) instead if matching _any_ subset value is enough.
2. When defining the control, select the **Allow multiple selections** option.
3. Save the control.
The newly configured control becomes available and allows users to select multiple values.
## Chain variable controls
- Elastic Cloud Serverless: Preview
- Elastic Stack: Preview since 9.3
Chain variable controls so that the selection in one control determines the options available in another. This is useful when you work with data from multiple indices or need hierarchical filtering, because it narrows control selections dynamically without filtering the entire dashboard.
To chain variable controls, reference one control's variable in another control's ES|QL query using the `?variable_name` syntax.
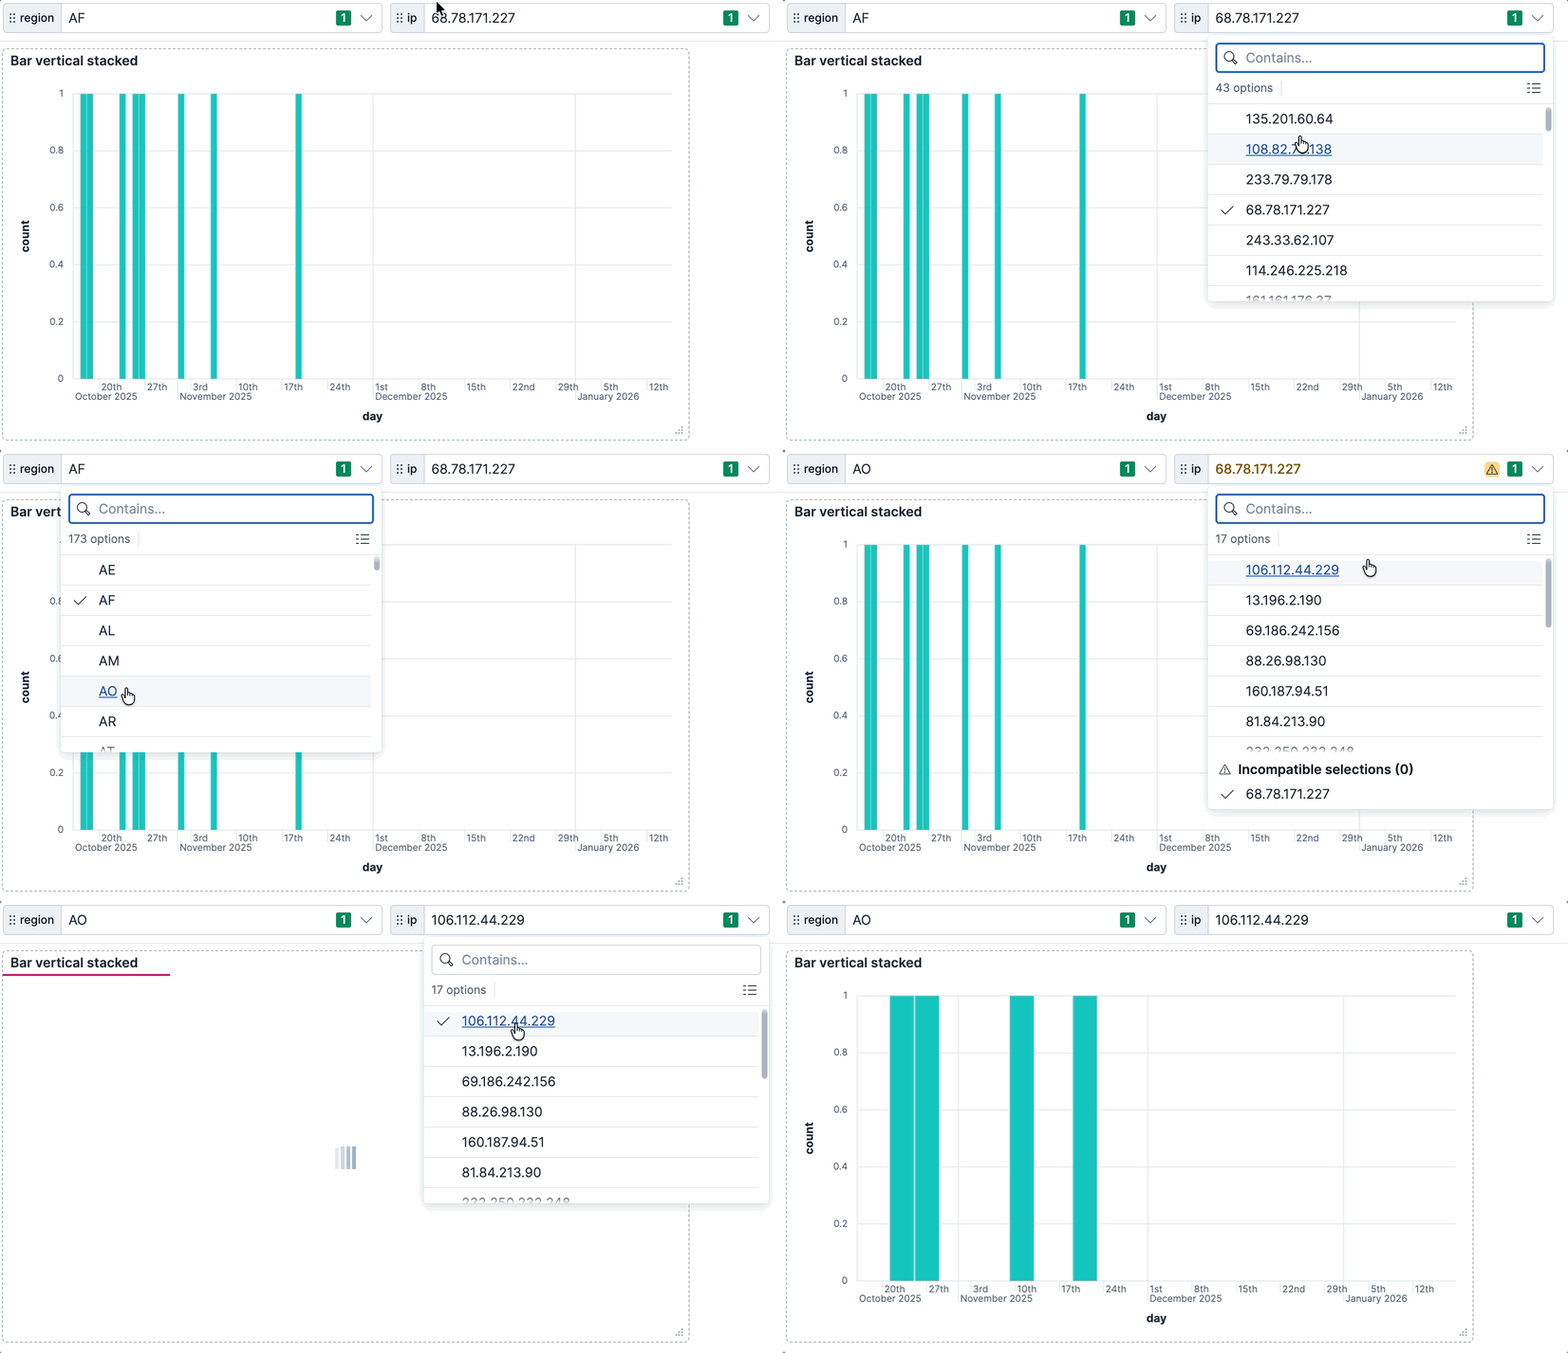
**Example**: You create a dashboard that analyzes web traffic by region and IP address. Next, you want to see only the IP addresses that are active in a selected region, and then analyze traffic patterns for a specific IP, all without filtering the entire dashboard by region.
1. Create the first control that will be referenced in other controls.
Create the controls that will be referenced in other controls first. This allows the ES|QL editor to provide proper autocomplete suggestions.
In **Edit** mode, select **Add** → **Controls** → **Variable control** in the application menu, then define the control:
- **Type**: Values from a query
- **Query**:
```esql
FROM kibana_sample_data_logs | WHERE @timestamp <= ?_tend AND @timestamp > ?_tstart | STATS BY geo.dest
```
- **Variable name**: `?region`
- **Label**: Region
This control extracts all unique destination regions from your logs.
2. Create the second control that depends on the first control.
Add another variable control:
- **Type**: Values from a query
- **Query**:
```esql
FROM kibana_sample_data_logs
| WHERE @timestamp <= ?_tend AND @timestamp > ?_tstart AND geo.dest == ?region
| STATS BY ip
```
- **Variable name**: `?ip`
- **Label**: IP address
This control references the `?region` variable and the built-in time range variables (`?_tstart` and `?_tend`). The available IP addresses will be only those associated with the selected region.
3. Test the chained controls. Both controls are now visible on your dashboard. Select different values in the **Region** control and observe how the available IP addresses in the **IP address** control change to show only IPs from that region.
4. Create an ES|QL visualization that uses the `?ip` control to filter data. For example:
```esql
FROM kibana_sample_data_logs
| WHERE ip == ?ip
| STATS count = COUNT(*) BY day = DATE_TRUNC(1 day, @timestamp)
| SORT day
```
This visualization filters data based on the selected IP address, while the IP address options themselves are filtered by the selected region.
When you select a value in a parent control, the child control's query reruns automatically. If the currently selected value in the child control is no longer available in the new result set, it is marked as invalid or incompatible.
## Import a Discover query along with its controls into a dashboard
- Elastic Cloud Serverless: Preview
- Elastic Stack: Preview since 9.2
To add the results of your Discover explorations to a dashboard in a way that preserves the [controls created from Discover](/elastic/docs-content/pull/5664/explore-analyze/discover/try-esql#add-variable-control) and also adds them to the dashboard, you have two methods:
**Method 1: Adding the Discover session's results**
This method allows you to add the result table of your Discover ES|QL query to any dashboard.
1. Save the ES|QL query containing the variable control into a Discover session. If your Discover session contains several tabs:
- Elastic Stack: Generally available since 9.4 Elastic Cloud Serverless: Generally available You can choose which tab the panel displays after adding the session to a dashboard.
- Elastic Stack: Generally available from 9.0 to 9.3 Only the first tab is imported to the dashboard.
2. Go to **Dashboards** and open or create one.
3. Select **Add**, then **From library**.
4. Find and select the Discover session you saved earlier.
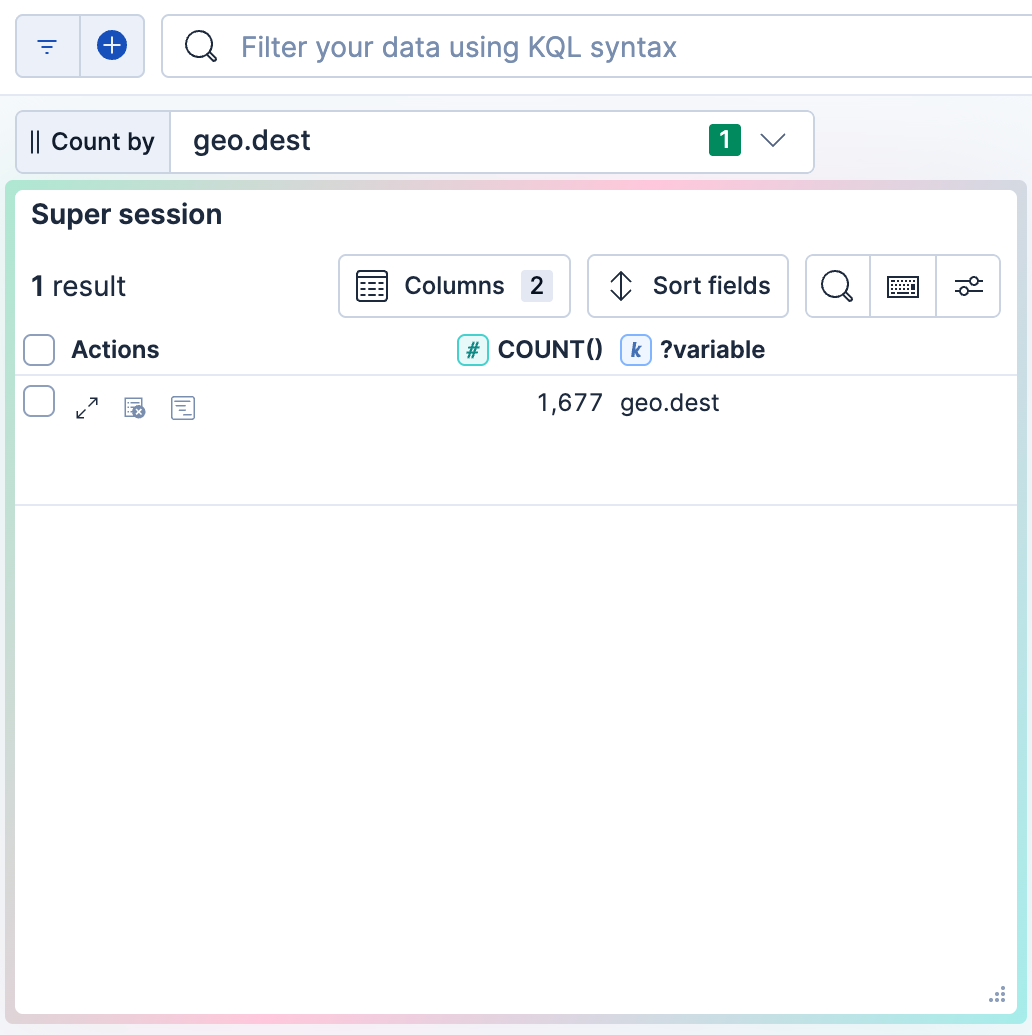
A new panel appears on the dashboard with the results of the query along with any attached controls.
**Method 2: Adding the Discover visualization** Elastic Cloud Serverless: Generally available, Elastic Stack: Generally available since 9.3
This method allows you to add the visualization of your Discover ES|QL query to any dashboard.
1. Next to the Discover visualization, select `app_dashboard` **Save visualization to dashboard** (or `save` **Save visualization** in earlier versions).
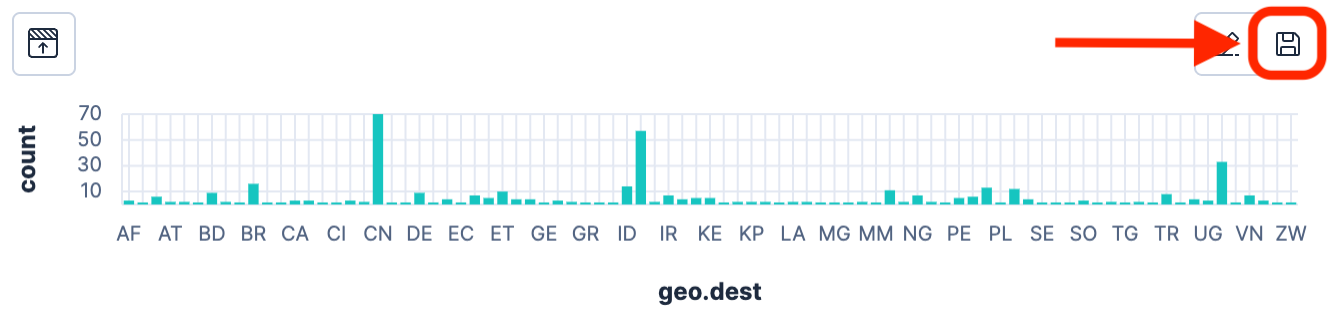
2. Select the dashboard to add the visualization to. You can choose an existing dashboard or create one.
The selected dashboard opens. It now includes a new panel that shows the visualization imported from Discover. Existing controls from the initial query in Discover are also added. You can find them at the top of the dashboard.
## Manage variable controls
After a variable control is on your dashboard, you can edit it, adjust its display, move it, or delete it. How you access these actions depends on whether the control is pinned:
- **When pinned**, hover over the control to reveal its action icons.
- Elastic Cloud Serverless: Generally available Elastic Stack: Generally available since 9.4 **When unpinned**, hover over the control to reveal its action icons, or open its panel menu, which adds standard panel actions such as **Duplicate** and **Copy to dashboard**.
| Action | Description |
|--------------------------------------------------------------------------------------------------------------------------------------------------------------------------------|-------------------------------------------------------------------------------------------------------------------------------------------------------------------------------------------------------------------------------------------------------------------------|
| **Unpin** or **Pin to Dashboard** Elastic Cloud Serverless: Generally available Elastic Stack: Generally available since 9.4 | Move the control between the top of the dashboard and the dashboard body. For details, refer to [Pinned and unpinned controls](/elastic/docs-content/pull/5664/explore-analyze/visualize/dashboard-controls#pinned-unpinned-controls). |
| **Edit** | Change the control's query, variable name, label, and other settings in the control's flyout. You can also update a control by editing the ES|QL query that references it. |
| **Display settings** Elastic Cloud Serverless: Generally available Elastic Stack: Generally available since 9.4 | For pinned controls, set the minimum width and whether the control expands to fill the available space. Resize an unpinned control by dragging it, like any other panel. In earlier versions, set the width directly in the control's settings when you add or edit it. |
| **Remove** or **Delete** | Delete the control from the dashboard. |
If you delete a variable control that's used in an ES|QL visualization, the visualization breaks. Edit the visualization query and remove or update the control reference.