---
title: Query activity
description: Monitor and manage long-running queries in your Elasticsearch cluster using the Query activity page in Kibana.
url: https://docs-v3-preview.elastic.dev/elastic/docs-content/pull/5739/deploy-manage/monitor/query-activity
products:
- Elasticsearch
- Kibana
applies_to:
- Elastic Cloud Serverless: Unavailable
- Elastic Stack: Planned
---
# Query activity
The **Query activity** page in Kibana gives you a real-time view of all search work running in your Elasticsearch cluster. Use it to find long-running or resource-intensive queries, trace them back to their source, and cancel them when needed.
Query activity surfaces search tasks from all query languages, including ES|QL, DSL, EQL, SQL, and multi-search requests.
It shows only what is currently running. For historical query data, use [slow logs](https://docs-v3-preview.elastic.dev/elastic/docs-content/pull/5739/deploy-manage/monitor/logging-configuration/slow-logs) or [AutoOps](https://docs-v3-preview.elastic.dev/elastic/docs-content/pull/5739/deploy-manage/monitor/autoops).
## Prerequisites
To use the **Query activity** page, you need the following privileges:
| Action | Required Elasticsearch cluster privilege | Required Kibana privilege |
|----------------------|------------------------------------------|--------------------------------|
| View running queries | `monitor` | **Query activity** read access |
| Cancel a query | `manage` | **Query activity** all access |
If you don't have the required privileges, the page displays a message asking you to contact your administrator.
## Access query activity
To open **Query activity**, go to **Stack Management → Cluster performance → Query activity**.
## View running queries
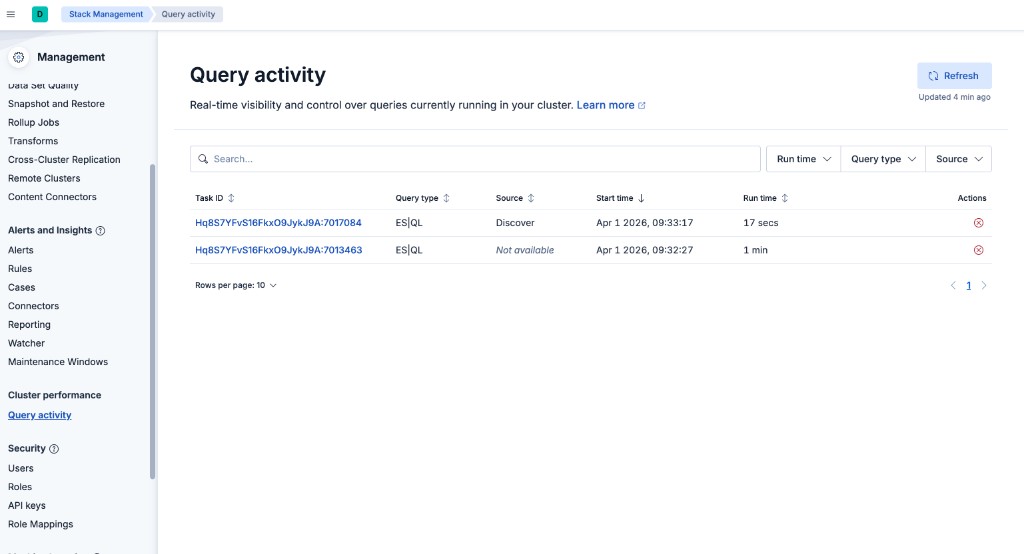
The **Query activity** page lists all in-flight search tasks in your cluster.
The list does not auto-refresh. Select **Refresh** to update the data. The time of the last refresh is displayed next to the button.
Searches that users [send to the background](https://docs-v3-preview.elastic.dev/elastic/docs-content/pull/5739/explore-analyze/discover/background-search) from Discover or Dashboards also appear on this page as **Async search** queries. Background search lets users queue their own Discover and Dashboards long-running searches and return to view results later. Query activity gives administrators cluster-wide visibility to monitor and manage all running queries.
The table displays the following columns:
The unique identifier for the Elasticsearch task. Select the task ID to open the [query details flyout](#inspect-query-details).
The query language used: ES|QL, DSL, EQL, SQL, MSearch, Async search, or Other.
The Kibana application that originated the query, such as Discover or Dashboard. This value is extracted from the `X-Opaque-Id` header set by Kibana.
If the source cannot be determined, the column shows *Not available*.
For more information about tracing queries, refer to [Trace an Elasticsearch query to its origin in Kibana](https://docs-v3-preview.elastic.dev/elastic/docs-content/tree/main/troubleshoot/kibana/trace-elasticsearch-query-to-the-origin-in-kibana).
The timestamp when the query started running.
How long the query has been running.
A cancel button to request cancellation of the query. This button is only available if you have the [required privileges](#prerequisites).
### Filter the query list
You can narrow down the list of running queries using several filters:
- **Search bar**: Enter any text to match against table contents, including task IDs.
- **Run time**: Set a minimum run time threshold to surface only queries that have been running longer than a specific duration.
- **Query type**: Filter by one or more query languages. The available options depend on the types of queries currently running.
- **Source**: Filter by one or more originating applications. The available options depend on the sources of queries currently running.
## Inspect query details
Select a task ID from the table to open the **Query details** flyout.
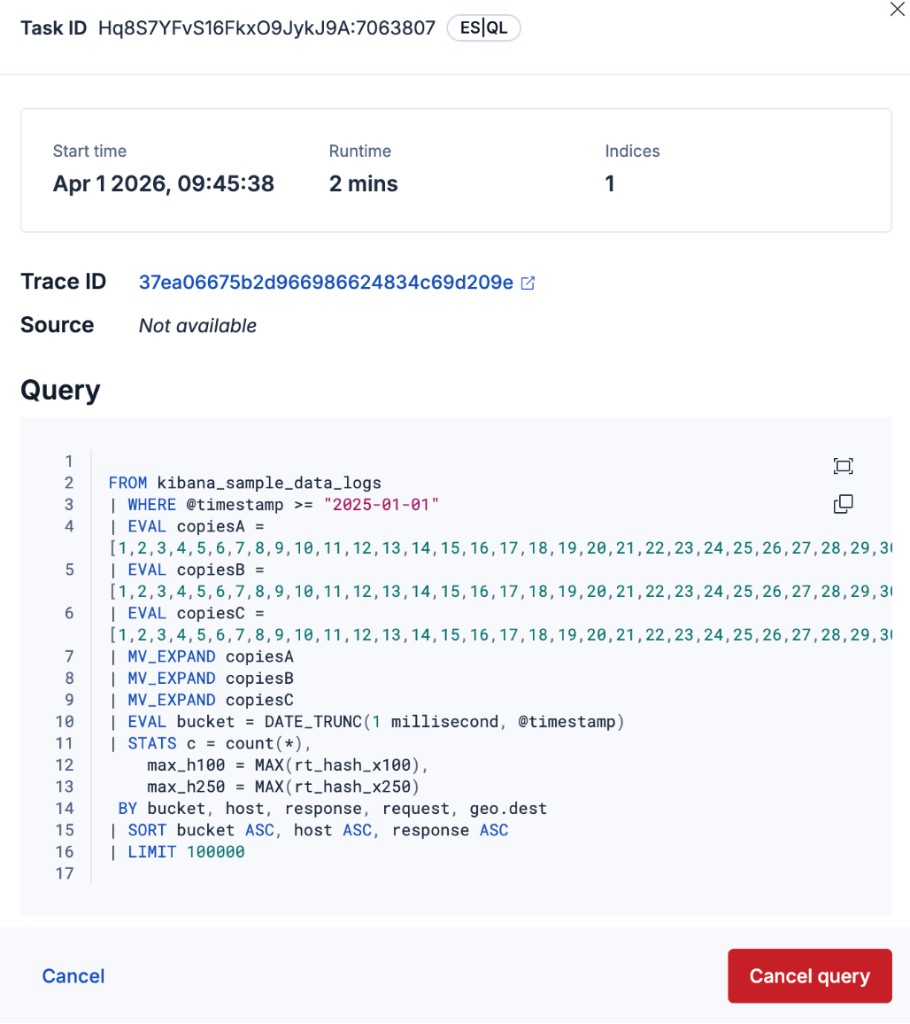
The flyout provides detailed information about the selected query:
- **Task ID** and **query type** badge
- **Start time** and **Run time**
- **Indices**: the number of indices the query targets
- **Trace ID**: when available, a link that opens Discover with `trace.id` pre-filtered and a time range starting 10 minutes before the query began
- **Source**: the originating Kibana application (such as Discover or Dashboard), when available
- **Query**: the full query text, displayed in a syntax-highlighted code block
- **Opaque ID**: the raw `X-Opaque-Id` header value, when present. The **Source** field above is derived from this header.
Use the navigation controls at the top of the flyout to browse through queries without returning to the list.
## Cancel a query
You can cancel a running query from the table or from the query details flyout.
1. Select the cancel icon in the **Actions** column, or select **Cancel query** in the flyout footer.
2. In the confirmation dialog, select **Confirm** to proceed.
Canceling a query is irreversible. The query stops running and any partial results are discarded.
3. After confirmation, the UI displays a cancellation status until Elasticsearch confirms the task has stopped.
A toast notification confirms when the cancel request has been submitted.
## Configure the minimum running time
By default, the **Query activity** page only displays queries that have been running for longer than 100 milliseconds.
This filters out fast-completing queries so you can focus on the ones that are most likely to affect cluster performance.
To change this threshold:
1. Go to **Stack Management → Advanced Settings**.
2. Search for `query_activity:minRunningTime`.
3. Enter a new value in milliseconds.
4. Select **Save changes**.