---
title: Explore Security data in Discover
description: Explore security alerts and events using the Security-specific Discover experience in Kibana.
url: https://docs-v3-preview.elastic.dev/elastic/docs-content/pull/6095/solutions/security/investigate/discover-security
products:
- Elastic Cloud Serverless
- Elastic Security
applies_to:
- Serverless Security projects: Generally available
- Elastic Stack: Generally available since 9.1
---
# Explore Security data in Discover
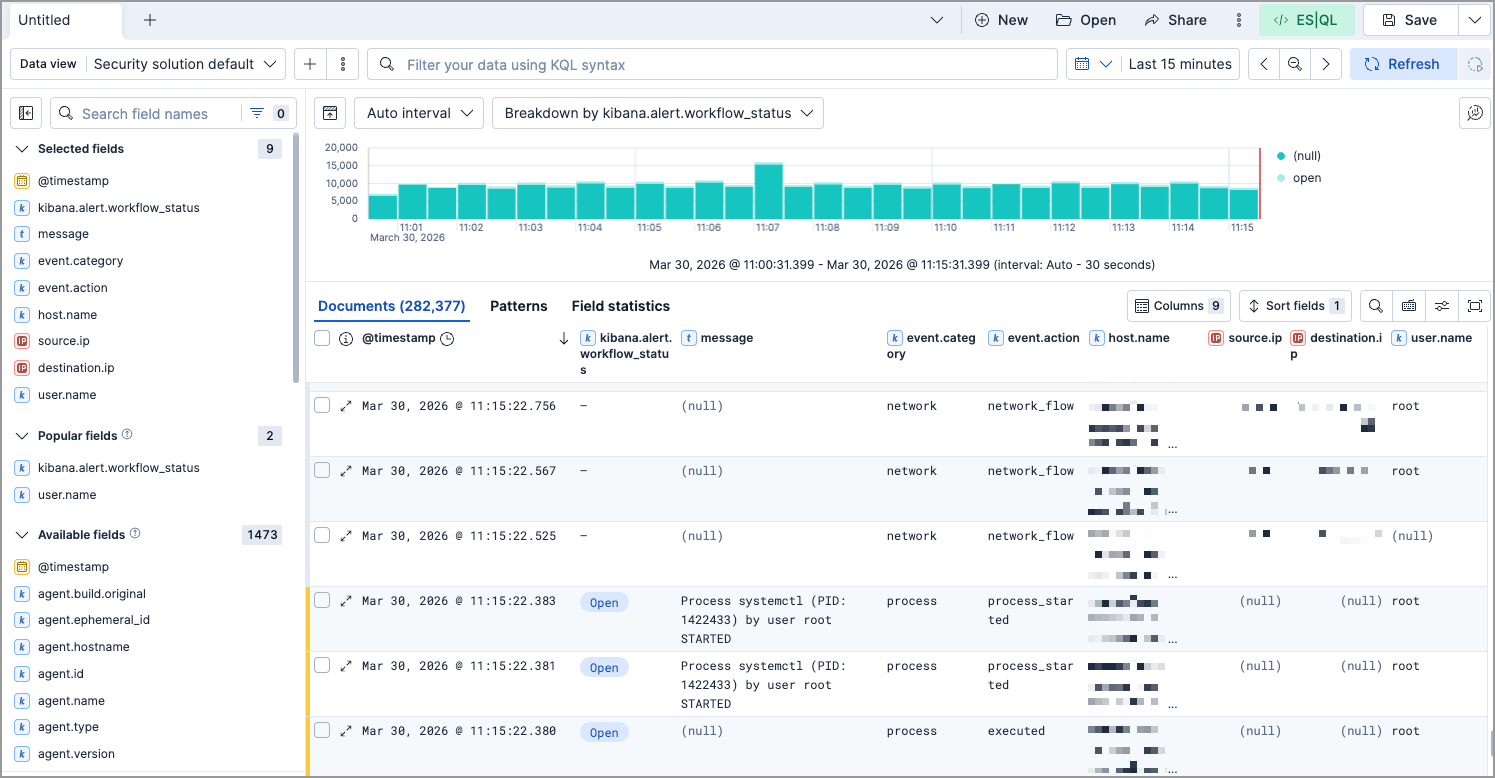
**Discover** provides a Security-specific experience for exploring alert and event data. When the Security experience is active, Discover adds color-coded row indicators, security-focused default columns, and contextual alert and event details when you expand a document.
For general **Discover** concepts and features, refer to [Discover](https://docs-v3-preview.elastic.dev/elastic/docs-content/pull/6095/explore-analyze/discover).
## Access the Security Discover experience
How the Security experience activates depends on your deployment type:
- Serverless Security projects: Generally available The Security experience activates automatically when you open **Discover** from your Elastic Security Serverless project.
- Elastic Stack: Generally available The Security experience activates when you open **Discover** from the Elastic Security [solution view](https://docs-v3-preview.elastic.dev/elastic/docs-content/pull/6095/deploy-manage/manage-spaces).
## Security-specific Discover features
With the Security experience active, **Discover** adds the following features to help you triage and investigate alerts and events.
### Row indicators
Color-coded indicators appear on the left side of each row in the data table, helping you distinguish between alerts and events at a glance:
- **Alerts**: Yellow indicator
- **Events**: Gray indicator
### Default columns for alert data
When you use a data view that includes security alerts data, such as the default Elastic Security data view, **Discover** displays pre-configured columns optimized for alert triage.
### Alert and event details flyout
When you expand an alert or event row in **Discover**, a details flyout opens. The flyout experience varies by version.
The document flyout includes an overview tab, plus **Table** and **JSON** tabs. The **Take action** button at the bottom lets you interact with the document.For alerts, the header also displays the status, risk score, assignees, and attached notes.The overview tab includes the following sections:
A description of the document. For alerts, shows the rule description and the reason the alert was generated. For events, shows the ECS event category description.
Highlighted fields relevant to the document. For alerts, also includes a link to the investigation guide if one is defined for the rule.
Session view and analyzer previews showing process activity. Click either preview to open a dedicated panel with a full view.
Correlated alerts and host and user prevalence data. For alerts, also includes threat intelligence matches. Click any subsection to open a dedicated panel with a full view.
The document flyout includes an overview tab, plus **Table** and **JSON** tabs. The overview tab surfaces key information to help you quickly understand the document and decide on next steps.The overview tab includes the following sections:
An ECS-based description of the event category, helping you understand the type of activity the document represents.
The detection rule description. Appears for alert documents.
The reason the alert was generated. Appears for alert documents.
For alerts, links directly to the alert in the Elastic Security app [Alerts](https://docs-v3-preview.elastic.dev/elastic/docs-content/pull/6095/solutions/security/detect-and-alert/manage-detection-alerts) page. For events, opens the event in [Timeline](https://docs-v3-preview.elastic.dev/elastic/docs-content/pull/6095/solutions/security/investigate/timeline) for further investigation.