---
title: Entity analytics overview
description: The Entity analytics page provides a centralized workspace for investigating entity risk across your environment. Use it to explore entity risk scores,...
url: https://docs-v3-preview.elastic.dev/elastic/docs-content/pull/6201/solutions/security/advanced-entity-analytics/overview
products:
- Elastic Cloud Serverless
- Elastic Security
applies_to:
- Serverless Security projects: Generally available
- Elastic Stack: Generally available since 9.1
---
# Entity analytics overview
The **Entity analytics** page provides a centralized workspace for investigating entity risk across your environment. Use it to explore entity risk scores, surface behavioral anomalies, and prioritize threat investigations.
To access the page:
- Elastic Stack: Generally available since 9.4 Elastic Cloud Serverless: Generally available Find **Entity analytics** in the navigation menu or use the [global search field](https://docs-v3-preview.elastic.dev/elastic/docs-content/pull/6201/explore-analyze/find-and-organize/find-apps-and-objects).
- Elastic Stack: Generally available from 9.1 to 9.3 Find **Entity analytics** → **Overview** in the navigation menu.
- This feature requires the appropriate [subscription](https://www.elastic.co/pricing) in Elastic Stack or [project feature tier](https://docs-v3-preview.elastic.dev/elastic/docs-content/pull/6201/deploy-manage/deploy/elastic-cloud/project-settings) in Serverless.
- Elastic Cloud Serverless: Removed Elastic Stack: Removed in 9.3 To get access to this page, turn on the `securitySolution:enablePrivilegedUserMonitoring` [advanced setting](/elastic/docs-content/pull/6201/solutions/security/get-started/configure-advanced-settings#access-privileged-user-monitoring).
## Threat hunting leads
- Elastic Cloud Serverless: Planned
- Elastic Stack: Generally available since 9.4
To display threat hunting leads, you must [turn on risk scoring](https://docs-v3-preview.elastic.dev/elastic/docs-content/pull/6201/solutions/security/advanced-entity-analytics/turn-on-risk-scoring-engine).
AI-generated leads appear at the top of the page, giving threat hunters a curated starting point for their investigations. Leads are refreshed every 24 hours and are derived from observations about entities in the entity store, including:
- Recent increases in entity risk score
- Newly added privileged users
- High numbers of alerts on a given entity
Interact with this section in the following ways:
- Turn **Auto-refresh** on to automatically regenerate leads every 24 hours.
- Click **Generate** to manually trigger a new set of leads without waiting for the next automatic refresh.
- Click a lead or click **Hunt in Chat** to open an AI-assisted investigation session in Agent Builder.
- Click **See all** to access and search the full list of current leads.
## Entity risk levels
- Elastic Cloud Serverless: Planned
- Elastic Stack: Generally available since 9.4
To display entity risk levels, you must [turn on risk scoring](https://docs-v3-preview.elastic.dev/elastic/docs-content/pull/6201/solutions/security/advanced-entity-analytics/turn-on-risk-scoring-engine).
This panel shows the distribution of entity risk across your environment, grouped by risk level. For each level, it displays the associated risk score range and the number of entities at that level.
## Recent anomalies
- Elastic Cloud Serverless: Planned
- Elastic Stack: Generally available since 9.4
To display anomaly results, you must [install and run](https://docs-v3-preview.elastic.dev/elastic/docs-content/pull/6201/explore-analyze/machine-learning/anomaly-detection/ml-ad-run-jobs) one or more [prebuilt anomaly detection jobs](https://docs-v3-preview.elastic.dev/elastic/docs-content/pull/6201/reference/machine-learning/ootb-ml-jobs-siem).
This panel displays recent entity-related anomalies detected by prebuilt machine learning jobs. Interact with this section in the following ways:
- Use the **View by** dropdown to group anomalies by **Entity** or **Job ID**.
- Use the **Anomaly score** filters to focus on anomalies by severity range.
- Click **View all in Anomaly Explorer** to access and search all machine learning jobs in the **Anomaly Explorer**.
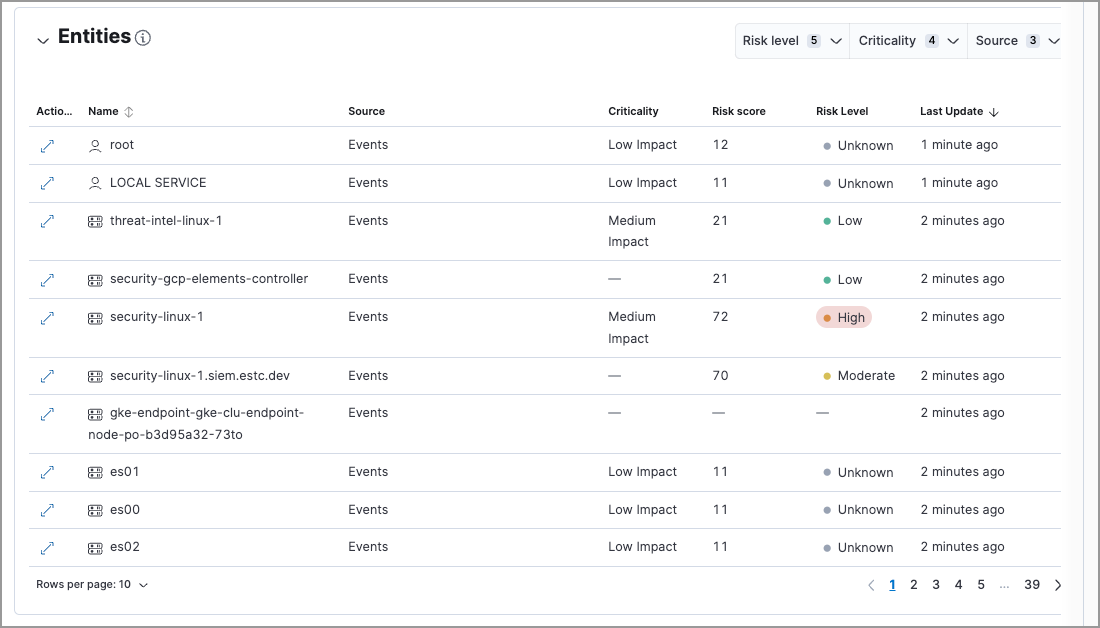
## Entities
To display the **Entities** section, you must [enable the entity store](/elastic/docs-content/pull/6201/solutions/security/advanced-entity-analytics/entity-store#enable-entity-store).
This section provides a centralized view of all hosts, users, and services in your environment. It displays entities from the [entity store](https://docs-v3-preview.elastic.dev/elastic/docs-content/pull/6201/solutions/security/advanced-entity-analytics/entity-store), which meet any of the following criteria:
- Have been observed by Elastic Security
- Have been added to Elastic Security through an integration, such as Active Directory or Okta
- Elastic Stack: Generally available from 9.1 to 9.3 Have an asset criticality assignment
Interact with the table to filter and explore entity data:
- Use the **Group entities by** dropdown to group entities by **Resolution**, **Entity type**, or a custom field. By default, entities are grouped by **Resolution**: alias entities appear nested under their primary entity, while unresolved entities appear on their own.
- Filter the table by watchlist membership to focus on specific entity groups.
- Sort and filter by any entity store field.
- Click an entity row to expand it and view more details, or open the entity details flyout.
- Select the **Risk level** dropdown to filter the table by the selected user, host, or service risk level.
- Select the **Criticality** dropdown to filter the table by the selected asset criticality level.
- Select the **Source** dropdown to filter the table by the data source.
- Click the **View details** icon (`expand` ) to open the entity details flyout.
The **Entities** table only shows a subset of the data available for each entity. You can query the `.entities.v1.latest.security_user_`, `.entities.v1.latest.security_host_`, and `.entities.v1.latest.security_service_` indices to see all the fields for each entity in the entity store.
Entity data from different sources appears in the **Entities** section based on the following timelines:
- When you first enable the entity store, only data stored in the last 24 hours is processed. After that, data is processed continuously.
- Observed events from the Elastic Security default data view are processed in near real-time.
- Entity Analytics data, such as entity risk scores and asset criticality (including bulk asset criticality upload), is also processed in near real-time.
- The availability of entities extracted from Entity Analytics integrations depends on the specific integration. Refer to [Active Directory Entity Analytics](https://docs.elastic.co/en/integrations/entityanalytics_ad), [Microsoft Entra ID Entity Analytics](https://docs.elastic.co/en/integrations/entityanalytics_entra_id), and [Okta Entity Analytics](https://docs.elastic.co/en/integrations/entityanalytics_okta) for more details.
## Entity KPIs (key performance indicators)
- Elastic Stack: Generally available from 9.1 to 9.3
This section displays the total number of critical hosts, critical users, and anomalies. Select a link to jump to the **Hosts** page, **Users** page, or **Anomalies** table.
## User Risk Scores
- Elastic Stack: Generally available from 9.1 to 9.3
To display user risk scores, you must [turn on risk scoring](https://docs-v3-preview.elastic.dev/elastic/docs-content/pull/6201/solutions/security/advanced-entity-analytics/turn-on-risk-scoring-engine).
This section displays user risk score data for your environment, including the total number of users, and the five most recently recorded user risk scores, with their associated user names, risk data, and number of detection alerts. User risk scores are [calculated](/elastic/docs-content/pull/6201/solutions/security/advanced-entity-analytics/entity-risk-scoring#how-is-risk-score-calculated) using a weighted sum on a scale of 0 (lowest) to 100 (highest).
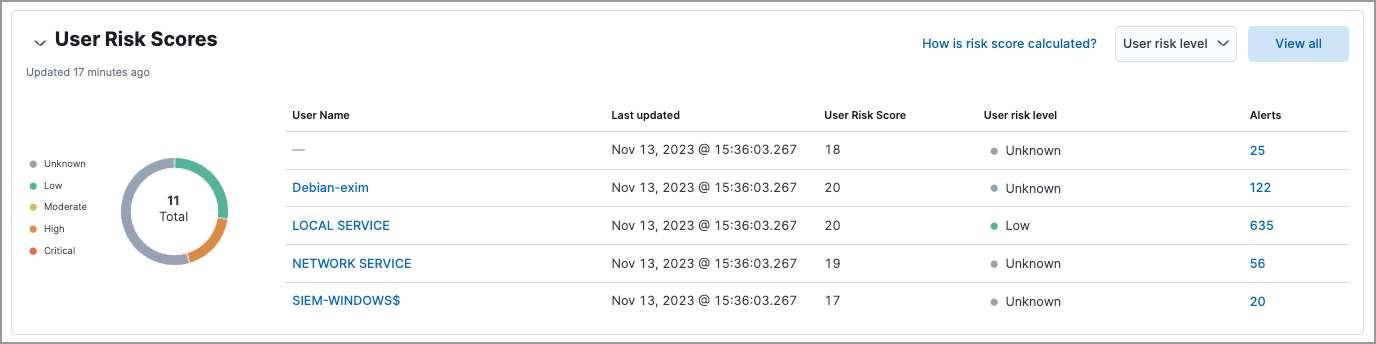
Interact with the table to filter data, view more details, and take action:
- Select the **User risk level** menu to filter the chart by the selected level.
- Click **View all** to display all user risk information on the **Users** page.
- Click a user name link to open the entity details flyout.
- Hover over a user name link to display inline actions: **Add to timeline** (`timeline`) and **Copy to Clipboard** (`copy_clipboard`).
- Click the number link in the **Alerts** column to view the alerts on the **Alerts** page. Hover over the number and select **Investigate in timeline** (`timeline`) to launch Timeline with a query that includes the associated user name value.
For more information about user risk scores, refer to [Entity risk scoring](https://docs-v3-preview.elastic.dev/elastic/docs-content/pull/6201/solutions/security/advanced-entity-analytics/entity-risk-scoring).
## Host Risk Scores
- Elastic Stack: Generally available from 9.1 to 9.3
To display host risk scores, you must [turn on risk scoring](https://docs-v3-preview.elastic.dev/elastic/docs-content/pull/6201/solutions/security/advanced-entity-analytics/turn-on-risk-scoring-engine).
This section displays host risk score data for your environment, including the total number of hosts, and the five most recently recorded host risk scores, with their associated host names, risk data, and number of detection alerts. Host risk scores are [calculated](/elastic/docs-content/pull/6201/solutions/security/advanced-entity-analytics/entity-risk-scoring#how-is-risk-score-calculated) using a weighted sum on a scale of 0 (lowest) to 100 (highest).
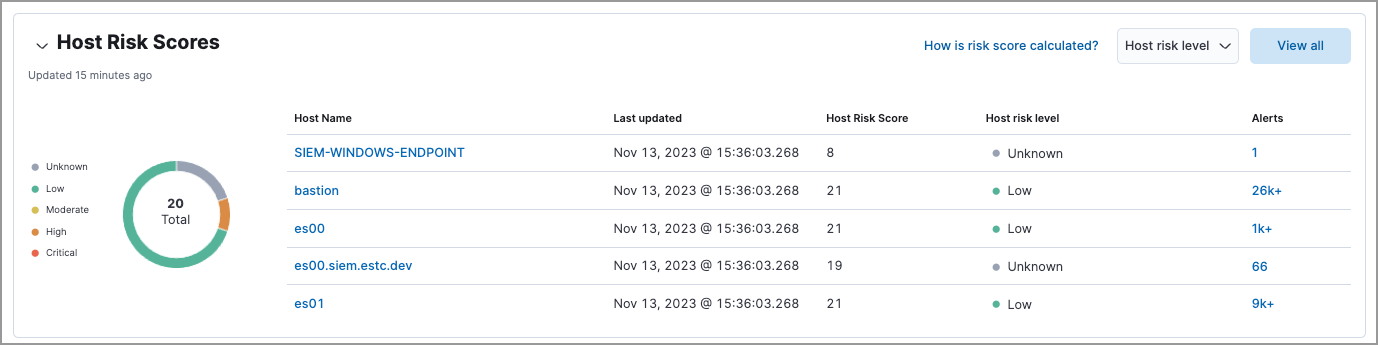
Interact with the table to filter data, view more details, and take action:
- Select the **Host risk level** menu to filter the chart by the selected level.
- Click **View all** to display all host risk information on the **Hosts** page.
- Click a host name link to open the entity details flyout.
- Hover over a host name link to display inline actions: **Add to timeline** (`timeline`) and **Copy to Clipboard** (`copy_clipboard`).
- Click the number link in the **Alerts** column to view the alerts on the **Alerts** page. Hover over the number and select **Investigate in timeline** (`timeline`) to launch Timeline with a query that includes the associated host name value.
For more information about host risk scores, refer to [Entity risk scoring](https://docs-v3-preview.elastic.dev/elastic/docs-content/pull/6201/solutions/security/advanced-entity-analytics/entity-risk-scoring).
## Service Risk Scores
- Elastic Stack: Generally available from 9.1 to 9.3
To display service risk scores, you must [turn on risk scoring](https://docs-v3-preview.elastic.dev/elastic/docs-content/pull/6201/solutions/security/advanced-entity-analytics/turn-on-risk-scoring-engine).
This section displays service risk score data for your environment, including the total number of services, and the five most recently recorded service risk scores, with their associated service names, risk data, and number of detection alerts. Service risk scores are [calculated](/elastic/docs-content/pull/6201/solutions/security/advanced-entity-analytics/entity-risk-scoring#how-is-risk-score-calculated) using a weighted sum on a scale of 0 (lowest) to 100 (highest).
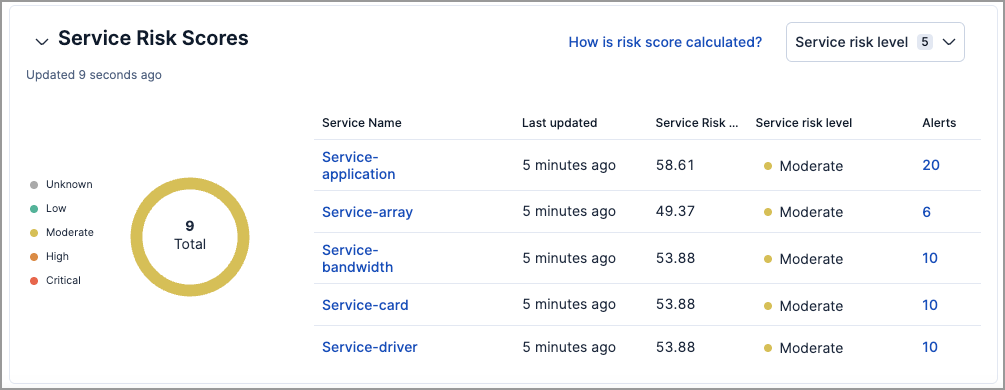
Interact with the table to filter data, view more details, and take action:
- Select the **Service risk level** menu to filter the chart by the selected level.
- Click a service name link to open the service details flyout.
- Hover over a service name link to display inline actions: **Add to timeline** (`timeline`) and **Copy to Clipboard** (`copy_clipboard`).
- Click the number link in the **Alerts** column to view the alerts on the **Alerts** page. Hover over the number and select **Investigate in timeline** (`timeline`) to launch Timeline with a query that includes the associated service name value.
For more information about service risk scores, refer to [Entity risk scoring](https://docs-v3-preview.elastic.dev/elastic/docs-content/pull/6201/solutions/security/advanced-entity-analytics/entity-risk-scoring).
## Anomalies
- Elastic Stack: Generally available from 9.1 to 9.3
Anomaly detection jobs identify suspicious or irregular behavior patterns. The **Anomalies** table displays the total number of anomalies identified by these prebuilt machine learning jobs (named in the **Anomaly name** column).
To display anomaly results, you must [install and run](https://docs-v3-preview.elastic.dev/elastic/docs-content/pull/6201/explore-analyze/machine-learning/anomaly-detection/ml-ad-run-jobs) one or more [prebuilt anomaly detection jobs](https://docs-v3-preview.elastic.dev/elastic/docs-content/pull/6201/reference/machine-learning/ootb-ml-jobs-siem). You cannot add custom anomaly detection jobs to the **Entity analytics** page.
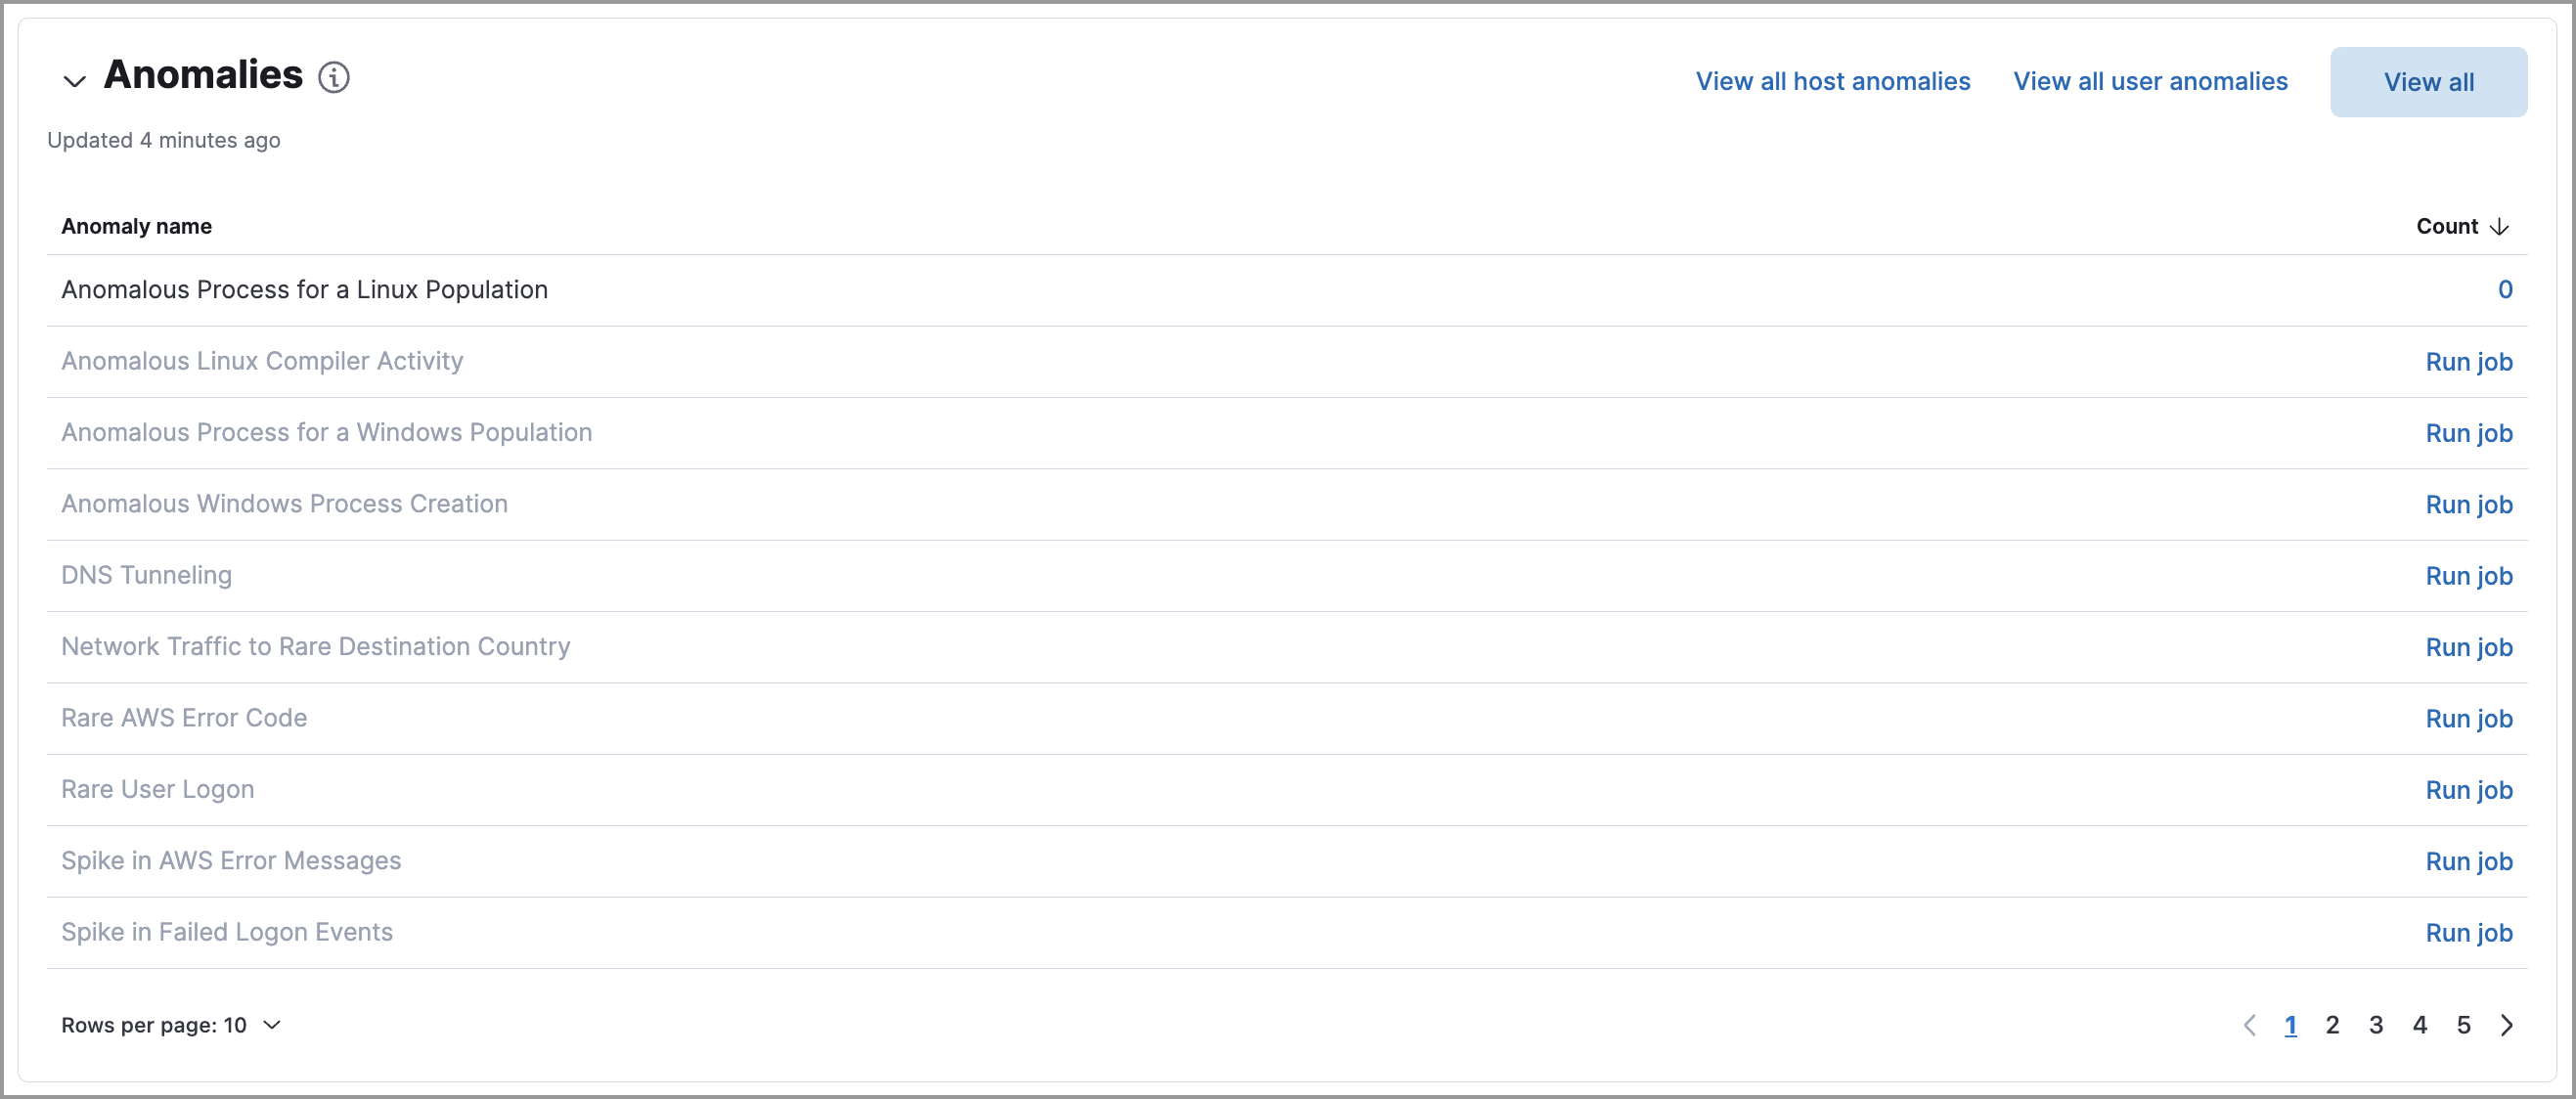
Interact with the table to view more details:
- Click **View all host anomalies** to go to the **Anomalies** table on the **Hosts** page.
- Click **View all user anomalies** to go to the **Anomalies** table on the **Users** page.
- Click **View all** to display and manage all machine learning jobs on the **Anomaly Detection Jobs** page.
To learn more about machine learning, refer to [What is Elastic Machine Learning?](https://docs-v3-preview.elastic.dev/elastic/docs-content/pull/6201/explore-analyze/machine-learning)