---
title: Share and export dashboards
description: Share Kibana dashboards with your team using links or embeds, and export them as PDF, PNG, CSV, or JSON files.
url: https://docs-v3-preview.elastic.dev/elastic/docs-content/pull/7036/explore-analyze/dashboards/sharing
products:
- Kibana
applies_to:
- Elastic Cloud Serverless: Generally available
- Elastic Stack: Generally available
---
# Share and export dashboards
Share a dashboard with others, or export its contents for reporting, backup, or reuse:
- [Share with a link](#share-dashboard-link): Copy a direct link to the dashboard.
- [Embed in a webpage](#embed-dashboard): Embed an interactive dashboard as an iframe on external web pages.
- [Export as PDF or PNG](#export-dashboard-pdf-png): Generate a report file of the dashboard.
- [Download visualization data as CSV](#download-csv): Download the data from a visualization as a CSV file.
- [Export JSON](#export-dashboards): Export the dashboard's definition as a JSON file to back it up, move it, or manage it as code.
You can also [set whether other users of your space can edit dashboards you own](#manage-dashboard-access).
## Share with a link
Share a direct link to a dashboard so that others can access it in Kibana.
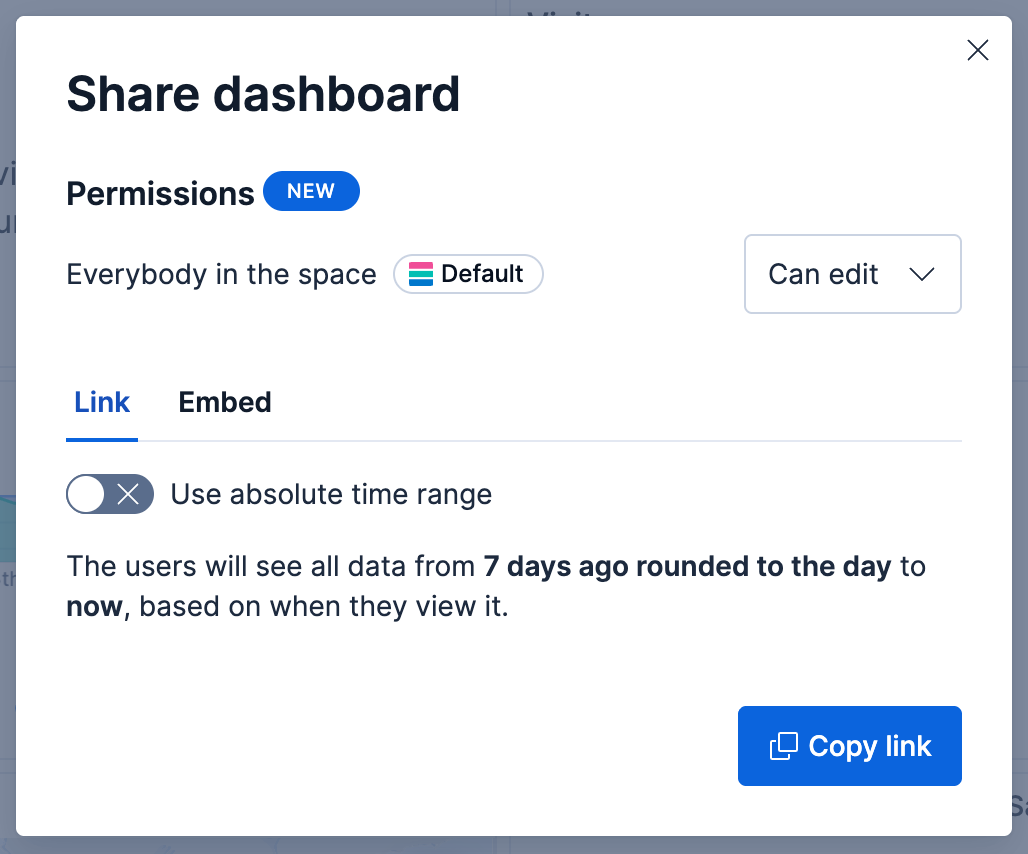
1. Open the dashboard, then select `share` **Share** in the application menu, and go to the **Link** tab.
2. Elastic Stack: Generally available since 9.1 Elastic Cloud Serverless: Generally available If your current time range is relative, use the **Use absolute time range** switch to choose what the link captures:
- **Off** (default): the link uses a relative time range and always shows current data. For example, a "Last 7 days" view always shows the most recent 7 days when users open the link.
- **On**: the link captures a fixed time period. For example, a "Last 7 days" view shared on January 7, 2025 always shows January 1-7, 2025, regardless of when users open the link.
3. Select **Copy link**.
The link opens the dashboard in the same Kibana instance with your current view, including any filters and search query you have applied. Recipients need access to that instance to open the link. Keep the following in mind when you share a link:
- **Authentication**: Recipients must log in to Kibana with an account that has permission to view the dashboard.
- Elastic Cloud Serverless: Unavailable **Anonymous access**: Users can open the link without logging in if you have configured [Anonymous authentication](/elastic/docs-content/pull/7036/deploy-manage/users-roles/cluster-or-deployment-auth/kibana-authentication#anonymous-authentication) and your anonymous service account has the necessary privileges.
- **Permanent links**: If the dashboard has unsaved changes, you get a temporary link that might break later, for example after an upgrade. Save the dashboard first to get a permanent link.
## Embed in a webpage
- Elastic Cloud Serverless: Unavailable
- Elastic Stack: Generally available
Embed a fully interactive dashboard as an iframe on an internal company website or personal web page.
1. Open the dashboard, select `share` **Share** in the application menu, then go to the **Embed** tab.
2. Under **Include**, select which parts of the dashboard to display in the embedded view:
- **Top menu**: the menu bar at the top of the dashboard
- **Query**: the search query bar
- **Time filter**: the time range selector
- **Filter bar** (enabled by default): the bar showing applied filters
3. Select **Copy embed code**.
4. Paste the iframe code into your web page HTML.
Save the dashboard before you generate the embed code. Embedding a dashboard with unsaved changes might result in an embed code that does not work properly.
For information about granting access to embedded dashboards, refer to [Authentication](https://docs-v3-preview.elastic.dev/elastic/docs-content/pull/7036/deploy-manage/users-roles/cluster-or-deployment-auth/user-authentication).
## Export as PDF or PNG
- Elastic Cloud Serverless: Unavailable
- Elastic Stack: Generally available
Generate and download a PDF or PNG file of a dashboard. The report is a static, point-in-time capture of the dashboard as currently displayed, including any filters, query, and time range you have applied. PDF and PNG reports are a [subscription feature](https://www.elastic.co/subscriptions).
To generate reports, you need the **Generate PDF or PNG reports** privilege, located under **Reporting** in the **Dashboard** feature privileges. The same privilege grants access to the **Reporting** page, where generated reports are listed.
1. Open the dashboard, then select `download` **Export** in the application menu.
2. Choose the PDF or PNG option.
3. Optional: For PDF exports, enable **Print format** or **Optimize for printing** to create a printer-friendly report with multiple A4 portrait pages and two visualizations per page.
4. Optional: To generate the report programmatically outside Kibana, for example in Watcher, copy the value from the **Post URL** field.
5. Select **Export PDF** or **Export PNG** to generate the report.
A notification confirms that the report is queued. When it is ready, download it from the **Reporting** page under **Stack Management** → **Alerts and Insights** → **Reporting**. If the report contains a data table or Discover session, the PDF includes only the visible data.
Elastic Stack: Generally available since 9.1 You can also schedule recurring exports. Refer to [Automatically generate reports](https://docs-v3-preview.elastic.dev/elastic/docs-content/pull/7036/explore-analyze/report-and-share/automating-report-generation) to learn more.
For general information about reporting across all Kibana apps, including known limitations and troubleshooting, refer to [Reporting and sharing](https://docs-v3-preview.elastic.dev/elastic/docs-content/pull/7036/explore-analyze/report-and-share). To set up reporting, see [Configure reporting](https://docs-v3-preview.elastic.dev/elastic/docs-content/pull/7036/deploy-manage/kibana-reporting-configuration).
## Download visualization data as CSV
You can download the data displayed in a visualization on a dashboard as a CSV file. The option is available for chart and table visualizations that expose tabular data, typically those created with **Lens**. It does not appear on panel types such as **Markdown**, **Image**, **Link**, or **Maps**.
1. On the dashboard, open the panel menu of the visualization.
2. Select **Download CSV**. The file downloads to your machine.
## Export JSON
You can export a dashboard's configuration to recreate it in another space or instance, back it up, or version-control it.
Export the dashboard's JSON source in a format that the [Kibana dashboards API](https://elastic.github.io/dashboards-api-spec/dashboards#tag/Dashboards) can consume, so you can manage dashboards as code or work with the API. Use this option when you want to inspect the state of a dashboard, save it to a file, or send it to the API to recreate the dashboard in another space or instance.
1. Open the dashboard, then select `download` **Export** → **Export JSON** from the application menu.
2. In the flyout, review the JSON source. If a panel type or property is not yet supported by the dashboards API, it is removed from the export and listed under **Unsupported properties were removed**. Expand **Show details** to see what was removed.
3. Choose how to use the JSON source:
- Select **Copy to clipboard** to copy the JSON.
- Select **Open in Console** to open Kibana Dev Tools Console with a Create dashboard API request pre-populated with the JSON source. This option is available if you have access to **Dev Tools**.
- Select **Download JSON** to save the JSON source to a file.
Export dashboards as NDJSON files to migrate them to other Kibana instances, back them up, or share them with other teams. You can export dashboards from **Stack Management** → **Saved Objects**. To configure and start the export:
1. Select the dashboard that you want, then select **Export**.
2. Enable **Include related objects** if you want objects associated with the selected dashboard, such as data views and visualizations, to also be exported. This option is enabled by default and recommended if you plan to import that dashboard again in a different space or cluster.
3. Select **Export**.
To automate Kibana, you can export dashboards as NDJSON using the [Export saved objects API](https://www.elastic.co/docs/api/doc/kibana/group/endpoint-saved-objects). It is important to export dashboards with all necessary references.
You can still use the NDJSON export on later versions, but the API-compatible JSON export is the recommended way to manage a single dashboard as code.
## Set edit permissions
- Elastic Cloud Serverless: Generally available
- Elastic Stack: Generally available since 9.3
As the owner of a dashboard or Kibana administrator, you can control whether other users in the space can edit it or only view it. To set this, open the dashboard, select `share` **Share** in the application menu, and choose:
- **Can edit**: Everybody in the space can edit, delete, and fully manage the dashboard.
- **Can view**: Everybody in the space can view the dashboard, but cannot edit or delete it. They can duplicate it. The owner or a Kibana administrator can change this setting at any time.

The dashboard owner cannot be changed and is not visible from the UI. Note that if user A creates a dashboard, exports it, and user B re-imports it in the same space (overwriting the existing dashboard), user A remains the owner but user B becomes the creator.
Kibana administrators always have write access to all dashboards.