---
title: Use OpenTelemetry with Elastic APM
description: Learn how to integrate OpenTelemetry with Elastic APM using Elastic Distributions, contrib SDKs, and APM agents. Includes setup for serverless, self-managed, and AWS Lambda.
url: https://docs-v3-preview.elastic.dev/elastic/docs-content/pull/7073/solutions/observability/apm/opentelemetry
products:
- Elastic Cloud Serverless
- Elastic Observability
applies_to:
- Elastic Cloud Serverless: Generally available
- Elastic Stack: Generally available
---
# Use OpenTelemetry with Elastic APM
OpenTelemetry is a set of APIs, SDKs, tooling, and integrations that enable the capture and management of telemetry data from your services and applications. You can use OpenTelemetry to collect application performance data in Elastic APM, whether you’re running serverless, self-managed, or hybrid deployments.
**Install OpenTelemetry content packs to work with OpenTelemetry data**To visualize data from OpenTelemetry receivers which is stored natively as OpenTelemetry semantic conventions, you must install content-only packs that provide dashboards compatible with OpenTelemetry data.In the Kibana Integrations UI, search for `otel` to find and install available integrations, like **System OpenTelemetry Assets**, to access the dashboards. We are adding more OpenTelemetry content packs every week, reach out by [opening an issue](https://github.com/elastic/integrations/issues) if what you are looking for is not available as an OTel content pack.Other Integrations which are beats-based include dashboards based on ECS data and are not compatible with OpenTelemetry semantic conventions.
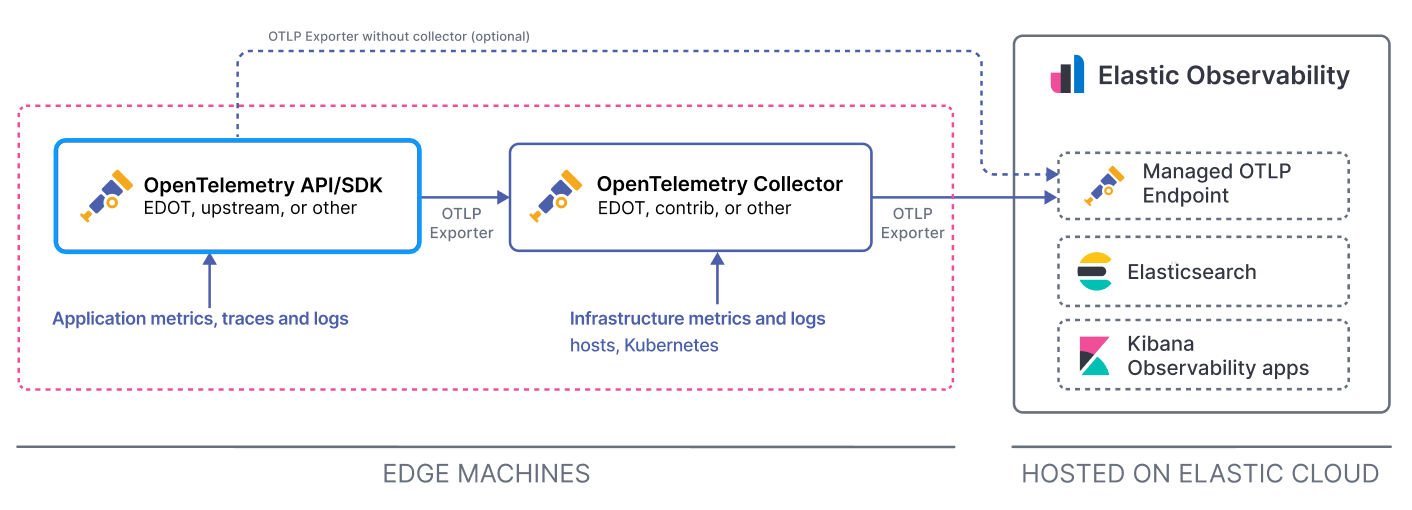
Elastic offers several distributions of OpenTelemetry. Each [Elastic Distribution of OpenTelemetry](https://docs-v3-preview.elastic.dev/elastic/opentelemetry/tree/main/reference) is a customized version of an OpenTelemetry language SDK and the OpenTelemetry Collector, ready to send data to the [Managed OTLP endpoint](https://docs-v3-preview.elastic.dev/elastic/opentelemetry/tree/main/reference/motlp), APM Server, or directly to Elasticsearch.
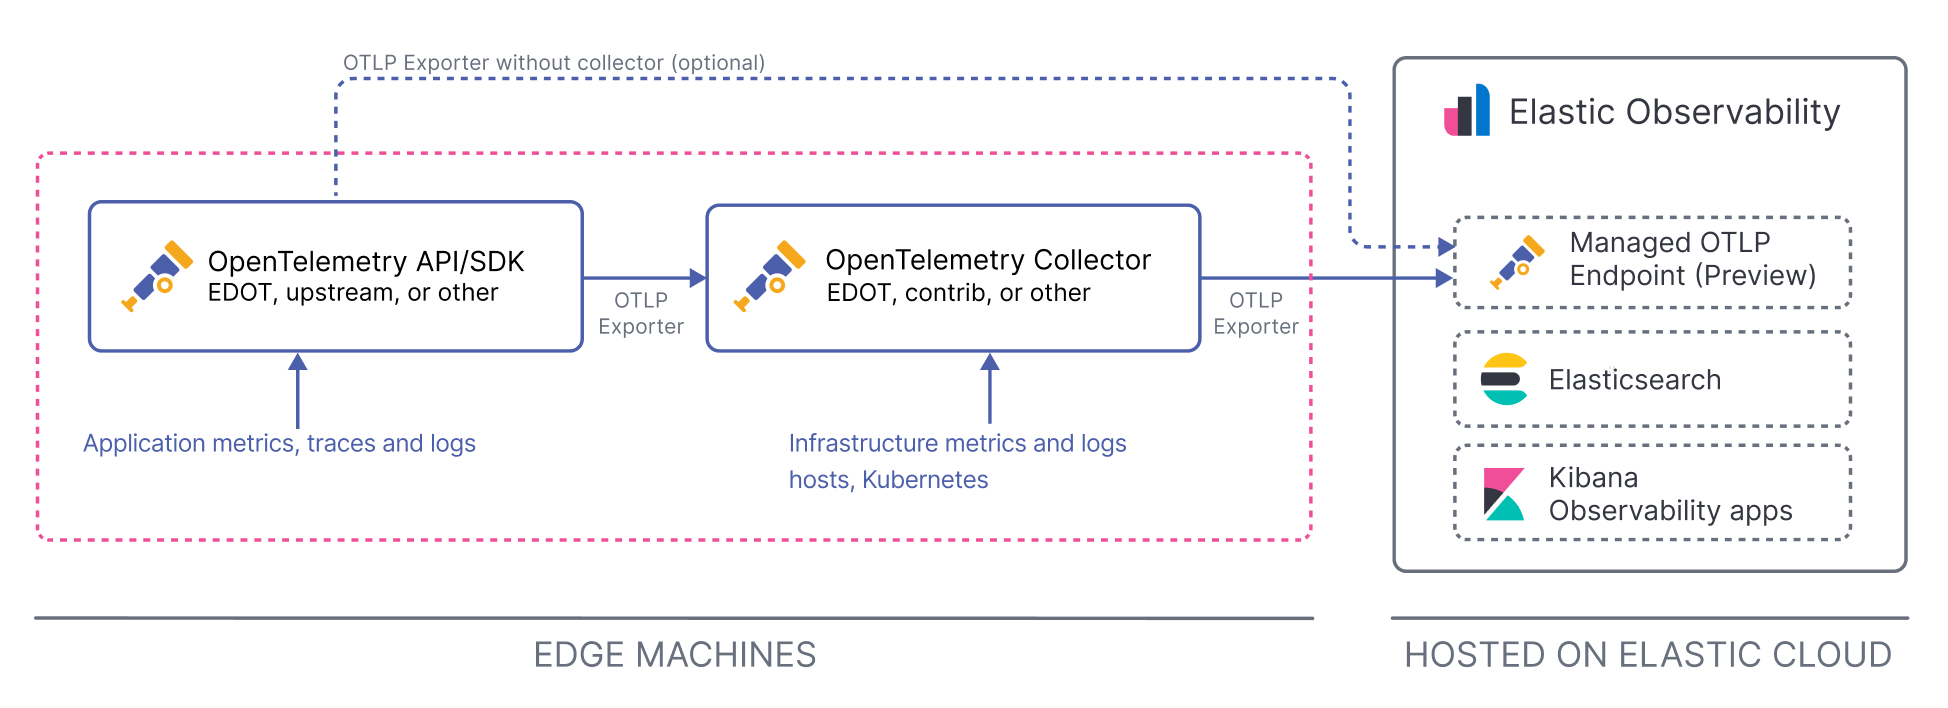
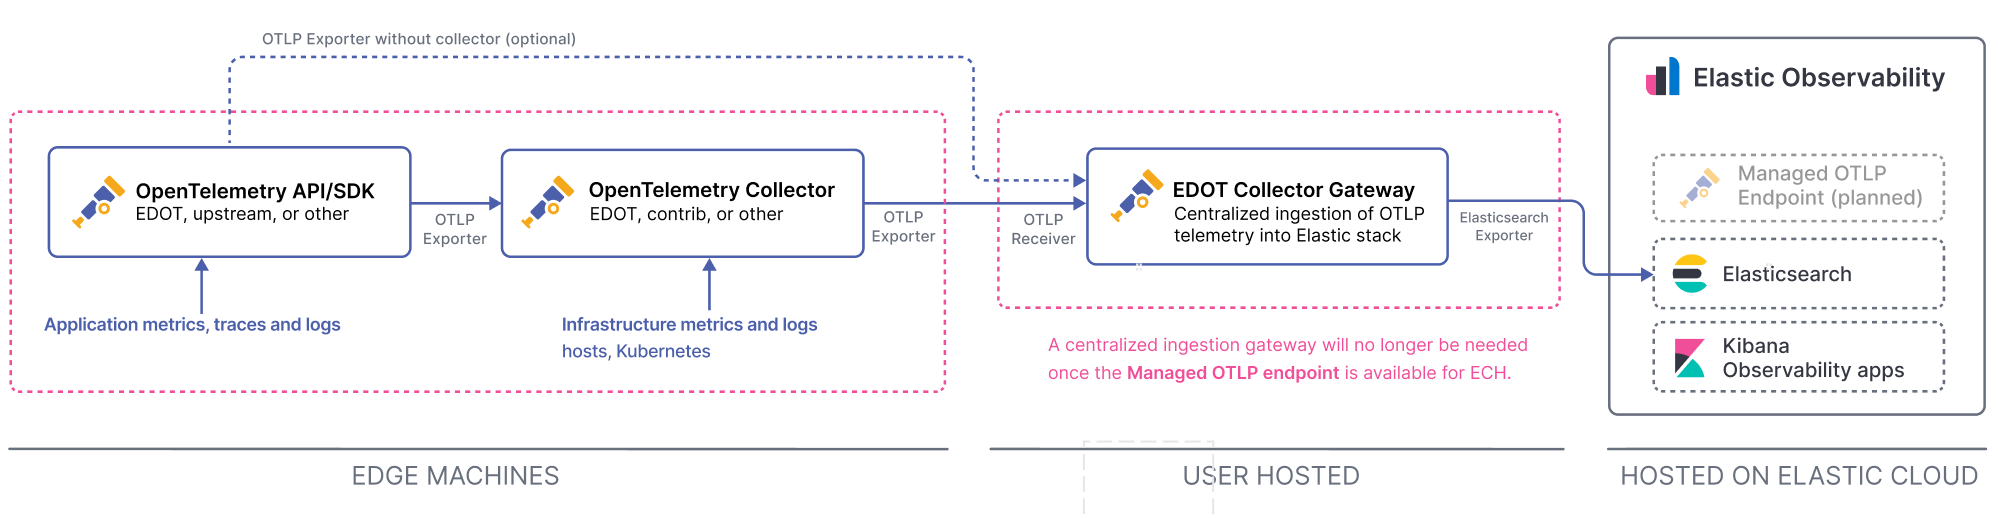
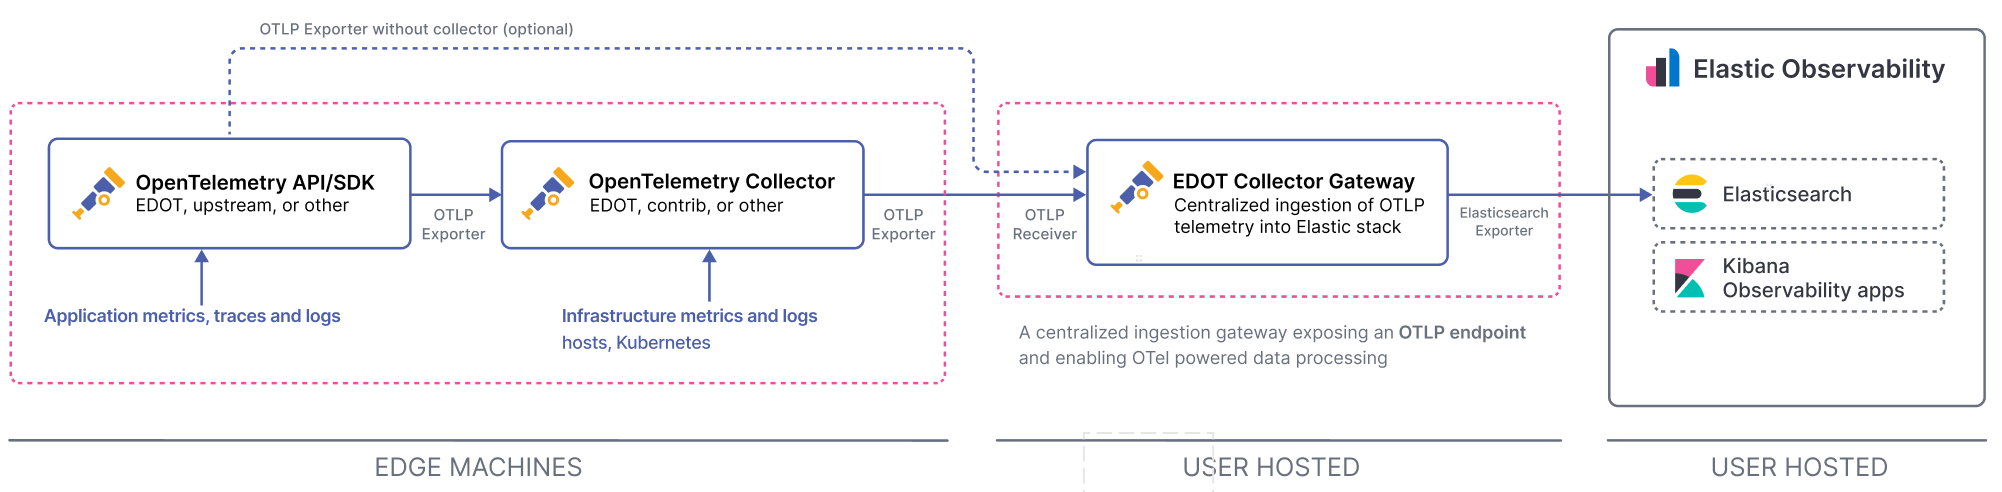
The following diagrams show the reference architecture for OpenTelemetry with Elastic, depending on your deployment model.
- Elastic Stack: Generally available since 9.2
- Elastic Stack: Generally available in 9.1
## Integration options
There are several ways to send OpenTelemetry data to Elastic. The right choice depends on your infrastructure, the technologies you're instrumenting, and whether you want Elastic to manage the pipeline.
### Instrument your applications
- **EDOT language SDKs**: Use Elastic's customized OpenTelemetry SDKs, which apply opinionated defaults and preselected instrumentations for zero-code setup, with full Elastic support. The recommended approach for most applications. Refer to [Why use the Elastic Distributions of OpenTelemetry?](#why-use-the-elastic-distributions-of-opentelemetry) for more information.
- **Contrib OpenTelemetry SDKs**: Use community OpenTelemetry SDKs for a language that doesn't have an EDOT SDK, such as Go or C++. These work with Elastic over OTLP but receive community support only. Refer to [Contrib OpenTelemetry Collector and SDKs](#apm-otel-upstream) for more information.
- **Elastic APM agents with the OpenTelemetry bridge**: Instrument your application with the vendor-neutral OpenTelemetry API while the Elastic APM agent collects and exports the data. Useful for reusing existing manual OpenTelemetry instrumentation without vendor lock-in, though some OpenTelemetry API features aren't supported. Refer to [Contrib OpenTelemetry with Elastic APM agent](#apm-otel-api-sdk-elastic-agent) for more information.
### Collect, process, and export data
- **EDOT Collector in Elastic Agent** Elastic Stack: Generally available since 9.2: The EDOT Collector runs embedded inside Elastic Agent, sharing a single `elastic-agent.yml` configuration file. No separate Collector installation is needed. Refer to [Elastic Agent as an OpenTelemetry Collector](https://docs-v3-preview.elastic.dev/elastic/docs-content/pull/7073/reference/fleet/elastic-agent-as-otel-collector) for more information.
- **Standalone EDOT Collector**: Run the EDOT Collector independently as its own process, without Elastic Agent. Refer to [EDOT Collector](https://docs-v3-preview.elastic.dev/elastic/elastic-agent/tree/main/reference/edot-collector) for more information.
- **Upstream `otelcol-contrib` Collector**: Use the community-built Collector to forward data to an EDOT Collector or directly to APM Server or the managed intake service using OTLP. Useful for a vendor-neutral pipeline or fanning out to multiple observability backends, but it's community-supported only. Refer to [Contrib OpenTelemetry Collectors and language SDKs](https://docs-v3-preview.elastic.dev/elastic/docs-content/pull/7073/solutions/observability/apm/opentelemetry/upstream-opentelemetry-collectors-language-sdks) for more information.
### Send data directly
- **Managed OTLP endpoint** (Serverless and Elastic Cloud Hosted): Send OpenTelemetry data directly to the [Managed OTLP endpoint](https://docs-v3-preview.elastic.dev/elastic/opentelemetry/tree/main/reference/motlp) without managing your own Collector.
## Why use the Elastic Distributions of OpenTelemetry?
With an [Elastic Distribution of OpenTelemetry language SDK](https://docs-v3-preview.elastic.dev/elastic/opentelemetry/tree/main/reference/edot-sdks) you have access to all the features of the OpenTelemetry SDK that it customizes, plus:
- You can get access to SDK improvements and bug fixes contributed by the Elastic team before the changes are available in the OpenTelemetry repositories.
- The distribution configures the collection of tracing and metrics signals, applying opinionated defaults, such as which sources are collected by default.
- By sending data through the [EDOT Collector](https://docs-v3-preview.elastic.dev/elastic/elastic-agent/tree/main/reference/edot-collector), you make sure to onboard infrastructure logs and metrics.
To set up OpenTelemetry with Elastic, refer to these guides for each SDK:
- [**Elastic Distribution of OpenTelemetry Java**](https://docs-v3-preview.elastic.dev/elastic/elastic-otel-java/tree/main/reference/edot-java)
- [**Elastic Distribution of OpenTelemetry .NET**](https://docs-v3-preview.elastic.dev/elastic/elastic-otel-dotnet/tree/main/reference/edot-dotnet)
- [**Elastic Distribution of OpenTelemetry Node.js**](https://docs-v3-preview.elastic.dev/elastic/elastic-otel-node/tree/main/reference/edot-node)
- [**Elastic Distribution of OpenTelemetry Python**](https://docs-v3-preview.elastic.dev/elastic/elastic-otel-python/tree/main/reference/edot-python)
- [**Elastic Distribution of OpenTelemetry PHP**](https://docs-v3-preview.elastic.dev/elastic/elastic-otel-php/tree/main/reference/edot-php)
- [**Elastic Distribution of OpenTelemetry Browser**](https://docs-v3-preview.elastic.dev/elastic/elastic-otel-rum-js/tree/main/reference/edot-browser)
For a complete overview of OpenTelemetry and Elastic, explore [**Elastic Distributions of OpenTelemetry**](https://docs-v3-preview.elastic.dev/elastic/opentelemetry/tree/main/reference).
## Contrib OpenTelemetry Collector and SDKs
The Elastic Stack natively supports the OpenTelemetry protocol (OTLP). This means trace data and metrics collected from your applications and infrastructure by an OpenTelemetry Collector or OpenTelemetry language SDK can be sent to Elastic.
You can set up an OpenTelemetry Collector based on contrib OpenTelemetry, instrument your application with an OpenTelemetry language SDK that sends data to the Collector, and use the Collector to process and export the data to either the [Managed OTLP endpoint](https://docs-v3-preview.elastic.dev/elastic/opentelemetry/tree/main/reference/motlp) or APM Server or the managed intake service.
This approach works well when you need to instrument a technology that Elastic doesn’t provide a solution for. For example, if you want to instrument C or C++ you can use the [OpenTelemetry C++ client](https://github.com/open-telemetry/opentelemetry-cpp). However, there are some limitations when using contrib OpenTelemetry collectors and language SDKs, including:
- Elastic can’t provide implementation support on how to use contrib OpenTelemetry tools.
- You won’t have access to Elastic enterprise APM features.
- You might experience problems with performance efficiency.
- Data ingested through a contrib Collector won't trigger automatic installation of OpenTelemetry content-pack assets, such as dashboards. Only data ingested through the EDOT Collector or Elastic Agent does.
For more on the limitations associated with using contrib OpenTelemetry tools, refer to [Limitations](https://docs-v3-preview.elastic.dev/elastic/docs-content/pull/7073/solutions/observability/apm/opentelemetry/limitations).
[**Get started with contrib OpenTelemetry Collectors and language SDKs →**](https://docs-v3-preview.elastic.dev/elastic/docs-content/pull/7073/solutions/observability/apm/opentelemetry/upstream-opentelemetry-collectors-language-sdks)
To understand the differences between Elastic Distributions of OpenTelemetry and contrib OpenTelemetry, refer to [EDOT compared to contrib OpenTelemetry](https://docs-v3-preview.elastic.dev/elastic/opentelemetry/tree/main/reference/compatibility/edot-vs-upstream).
## Contrib OpenTelemetry with Elastic APM agent
You can use the OpenTelemetry API/SDKs with [Elastic APM agents](/elastic/docs-content/pull/7073/solutions/observability/apm/apm-server/fleet-managed#_step_3_install_apm_agents) to translate OpenTelemetry API calls to Elastic APM API calls. This allows you to reuse your existing OpenTelemetry instrumentation to create Elastic APM transactions and spans, avoiding vendor lock-in and having to redo manual instrumentation.
However, not all features of the OpenTelemetry API are supported when using this approach, and not all Elastic APM agents support this approach.
Find more details about how to use an OpenTelemetry API or SDK with an Elastic APM agent and which OpenTelemetry API features are supported in the APM agent documentation:
- [**APM Java agent**](https://docs-v3-preview.elastic.dev/elastic/apm-agent-java/tree/main/reference/opentelemetry-bridge)
- [**APM .NET agent**](https://docs-v3-preview.elastic.dev/elastic/apm-agent-dotnet/tree/main/reference/opentelemetry-bridge)
- [**APM Node.js agent**](https://docs-v3-preview.elastic.dev/elastic/apm-agent-nodejs/tree/main/reference/opentelemetry-bridge)
- [**APM Python agent**](https://docs-v3-preview.elastic.dev/elastic/apm-agent-python/tree/main/reference/opentelemetry-api-bridge)
## AWS Lambda Collector Exporter
AWS Lambda functions can be instrumented with OpenTelemetry and monitored with Elastic Observability or Elastic Observability Serverless.
To get started, follow the official AWS Distribution for OpenTelemetry Lambda documentation, and [configure the EDOT Collector in Gateway mode](https://docs-v3-preview.elastic.dev/elastic/elastic-agent/tree/main/reference/edot-collector/config/default-config-standalone#gateway-mode) to send traces and metrics to your Elastic cluster:
[**Get started with the AWS Distro for OpenTelemetry Lambda**](https://aws-otel.github.io/docs/getting-started/lambda)