---
title: Run from the Attack Discovery page
description: Generate Attack Discovery findings manually on demand or automatically on a recurring schedule, directly from the Attack Discovery page.
url: https://docs-v3-preview.elastic.dev/elastic/docs-content/pull/7448/solutions/security/ai/attack-discovery/run-from-attack-discovery-page
products:
- Elastic Cloud Serverless
- Elastic Security
applies_to:
- Serverless Security projects: Generally available
- Elastic Stack: Generally available
---
# Run from the Attack Discovery page
This page describes how to run Attack Discovery directly from the **Attack Discovery** page: configure which alerts get analyzed, trigger an on-demand run, and set up a recurring schedule so discoveries are generated automatically. Use this page when you want to work from the dedicated Attack Discovery experience; if you're triaging attacks from the unified Attacks page instead, you can create and manage schedules there too—refer to [Manage discoveries from the Attacks page](https://docs-v3-preview.elastic.dev/elastic/docs-content/pull/7448/solutions/security/ai/attack-discovery/manage-discoveries-from-attacks-page).
## Set up Attack Discovery
By default, Attack Discovery analyzes up to 100 alerts from the last 24 hours, but you can customize how many and which alerts it analyzes using the settings menu. To open it, click the settings icon next to the **Run** button.
In Elastic Stack 9.0.x, the **Run** button is called **Generate**.
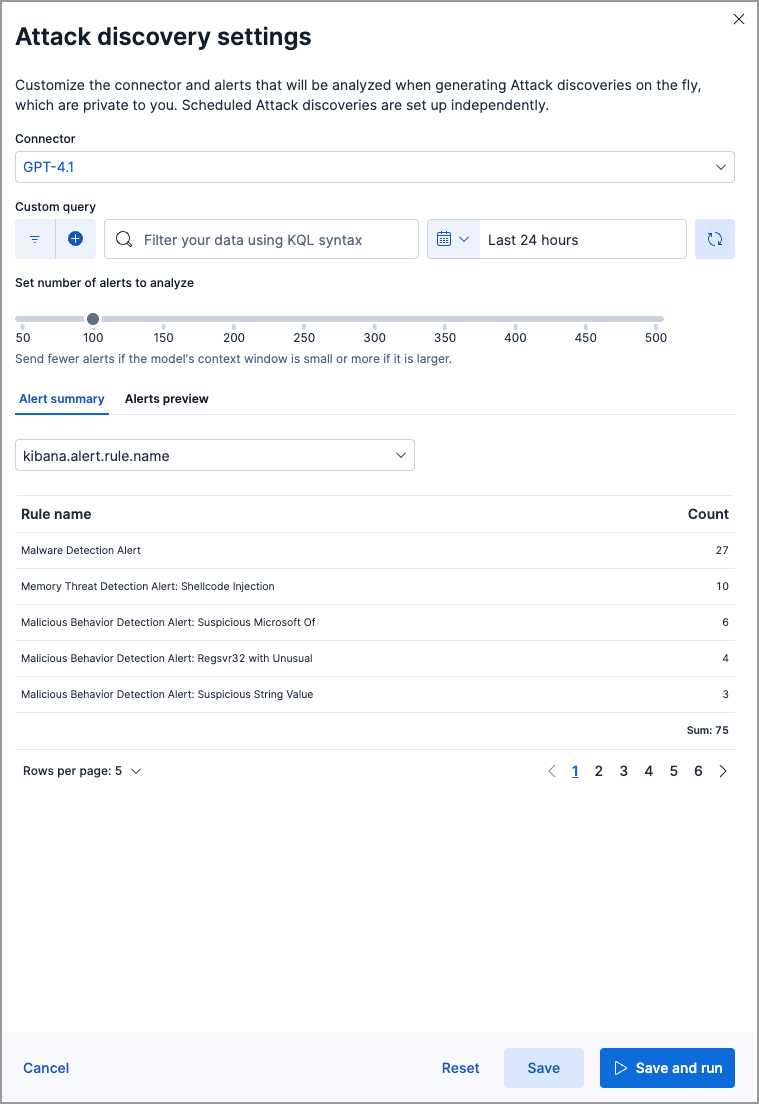
You can select which alerts Attack Discovery processes by filtering based on a KQL query, the time and date selector, and the **Number of alerts** slider. Note that sending more alerts than your chosen LLM can handle may result in an error. Under **Alert summary** you can view a summary of the selected alerts grouped by various fields, and under **Alerts preview** you can view more details about the selected alerts.
Attack Discovery is designed for use with alerts based on data that complies with ECS, and by default only analyses ECS-compliant fields. However, you can enable Attack Discovery to review additional fields by following these steps:
1. Select an alert with some of the non-ECS fields you want to analyze, and go to its details flyout. From here, use the **Ask AI Assistant** or **Add to chat** button to open an AI chat.
2. At the bottom of the chat window, the alert's information appears. Click **Edit** to open the anonymization window to this alert's fields.
3. Search for and select the non-ECS fields you want Attack Discovery to analyze. Set them to **Allowed**.
4. Check the `Update presets` box to add the allowed fields to the space's default anonymization settings.
The next time you run Attack Discovery it will be able to analyze the selected fields.
## Generate discoveries manually
You’ll need to select an LLM connector before you can analyze alerts.
To get started:
1. Click the **Attack Discovery** page from Elastic Security's navigation menu.
2. Do one of the following:
- Elastic Stack: Generally available since 9.1 Click the settings icon next to the **Run** button, then in the settings menu, select an existing connector from the dropdown menu, or add a new one.
- Elastic Stack: Generally available in 9.0 Select an existing connector from the dropdown menu, or add a new one.
While Attack Discovery is compatible with many different models, refer to the [Large language model performance matrix](https://docs-v3-preview.elastic.dev/elastic/docs-content/pull/7448/solutions/security/ai/large-language-model-performance-matrix) to see which models perform best.
3. Once you’ve selected a connector, do one of the following to start the analysis:
- Elastic Stack: Generally available since 9.1 Click **Save and run**.
- Elastic Stack: Generally available in 9.0 Click **Generate**.
It may take from a few seconds up to several minutes to generate discoveries, depending on the number of alerts and the model you selected. Once the analysis is complete, any threats it identifies will appear as discoveries. Click each one’s title to expand or collapse it. Click **Run** at any time to start the Attack Discovery process again with the selected alerts.
Attack Discovery uses the same data anonymization settings as [Elastic AI Assistant](https://docs-v3-preview.elastic.dev/elastic/docs-content/pull/7448/solutions/security/ai/ai-assistant). To configure which alert fields are sent to the LLM and which of those fields are obfuscated, use the Elastic AI Assistant settings. Consider the privacy policies of third-party LLMs before sending them sensitive data.
## Schedule runs
- Elastic Cloud Serverless: Generally available
- Elastic Stack: Generally available since 9.1
Elastic Stack: Preview since 9.4 Elastic Cloud Serverless: Preview You can also [create and manage schedules from the Attacks page](https://docs-v3-preview.elastic.dev/elastic/docs-content/pull/7448/solutions/security/ai/attack-discovery/run-from-attacks-page). Schedules created on either page appear on both.
You can define recurring schedules (for example, daily or weekly) to automatically generate attack discoveries without needing manual runs. For example, you can generate discoveries every 24 hours and send a Slack notification to your SecOps channel if discoveries are found. Notifications are sent using configured [connectors](https://docs-v3-preview.elastic.dev/elastic/docs-content/pull/7448/deploy-manage/manage-connectors), such as Slack or email, and you can customize the notification content to tailor alert context to your needs.
You can still generate discoveries manually at any time, regardless of an active schedule.
To create a new schedule:
1. In the top-right corner, select **Schedule**.
2. In the **Attack discovery schedule** flyout, select **Create new schedule**.
3. Enter a name for the new schedule.
4. Select the LLM connector to use for generating discoveries, or add a new one.
5. Use the KQL query bar, time filter, and alerts slider to customize the set of alerts that will be analyzed.
6. Define the schedule's frequency (for example, every 24 hours).
7. Optionally, select the [connectors](https://docs-v3-preview.elastic.dev/elastic/docs-content/pull/7448/deploy-manage/manage-connectors) to use for receiving notifications, and define their actions.
8. Click **Create & enable schedule**.
After creating new schedules, you can view their status, modify them or delete them from the **Attack discovery schedule** flyout.
Scheduled discoveries are shown with a **Scheduled Attack discovery** icon (`calendar`). Click the icon to view the schedule that created it.
To create a new schedule:
1. In the top-right corner, select **Schedule**.
2. In the **Attack discovery schedule** flyout, select **Create new schedule**.
3. Enter a name for the new schedule.
4. Select the LLM connector to use for generating discoveries, or add a new one.
5. Use the KQL query bar, time filter, and alerts slider to customize the set of alerts that will be analyzed.
6. Define the schedule's frequency (for example, every 24 hours).
7. Optionally, select the [connectors](https://docs-v3-preview.elastic.dev/elastic/docs-content/pull/7448/deploy-manage/manage-connectors) to use for receiving notifications, and define their actions.
8. Click **Create & enable schedule**.
After creating new schedules, you can view their status, modify them, or delete them from the **Attack discovery schedule** flyout. You can also act on multiple schedules at once:
1. In the schedule table, select the checkbox next to each schedule you want to act on.
2. Select **Bulk actions**, then choose one of the following:
- **Enable** to enable the selected schedules.
- **Disable** to disable the selected schedules.
- **Delete** to delete the selected schedules. You'll be asked to confirm before the schedules are removed.
Bulk actions apply only to the schedules you've explicitly selected in the table.To manage schedules programmatically, use the [Attack discovery API](https://www.elastic.co/docs/api/doc/kibana/group/endpoint-security-attack-discovery-api), which includes endpoints for bulk-enabling, bulk-disabling, and bulk-deleting schedules.
Scheduled discoveries are shown with a **Scheduled Attack discovery** icon (`calendar`). Click the icon to view the schedule that created it.