---
title: Integrate with machine learning
description: The machine learning integration initiates a new job predefined to calculate anomaly scores on APM transaction durations. With this integration, you can...
url: https://docs-v3-preview.elastic.dev/elastic/docs-content/pull/7588/solutions/observability/apm/machine-learning
products:
- APM
- Elastic Cloud Serverless
- Elastic Observability
applies_to:
- Elastic Cloud Serverless: Generally available
- Elastic Stack: Generally available
---
# Integrate with machine learning
Using machine learning requires an [appropriate license](https://www.elastic.co/subscriptions).
The machine learning integration initiates a new job predefined to calculate anomaly scores on APM transaction durations. With this integration, you can quickly pinpoint anomalous transactions and identify services with active anomalies across your architecture.
machine learning jobs are created per environment and are based on a service’s average response time. Because jobs are created at the environment level, you can add new services to your existing environments without the need for additional machine learning jobs.
Results from machine learning jobs are shown in multiple places throughout the Applications UI:
- The **Services** inventory provides a quick-glance view of the general health of all of your services. Elastic Stack: Planned Elastic Cloud Serverless: Generally available Services are color coded to show services with active anomalies so you can quickly identify problem areas.
- The transaction duration chart shows the expected bounds and adds an annotation when the anomaly score is 75 or above.
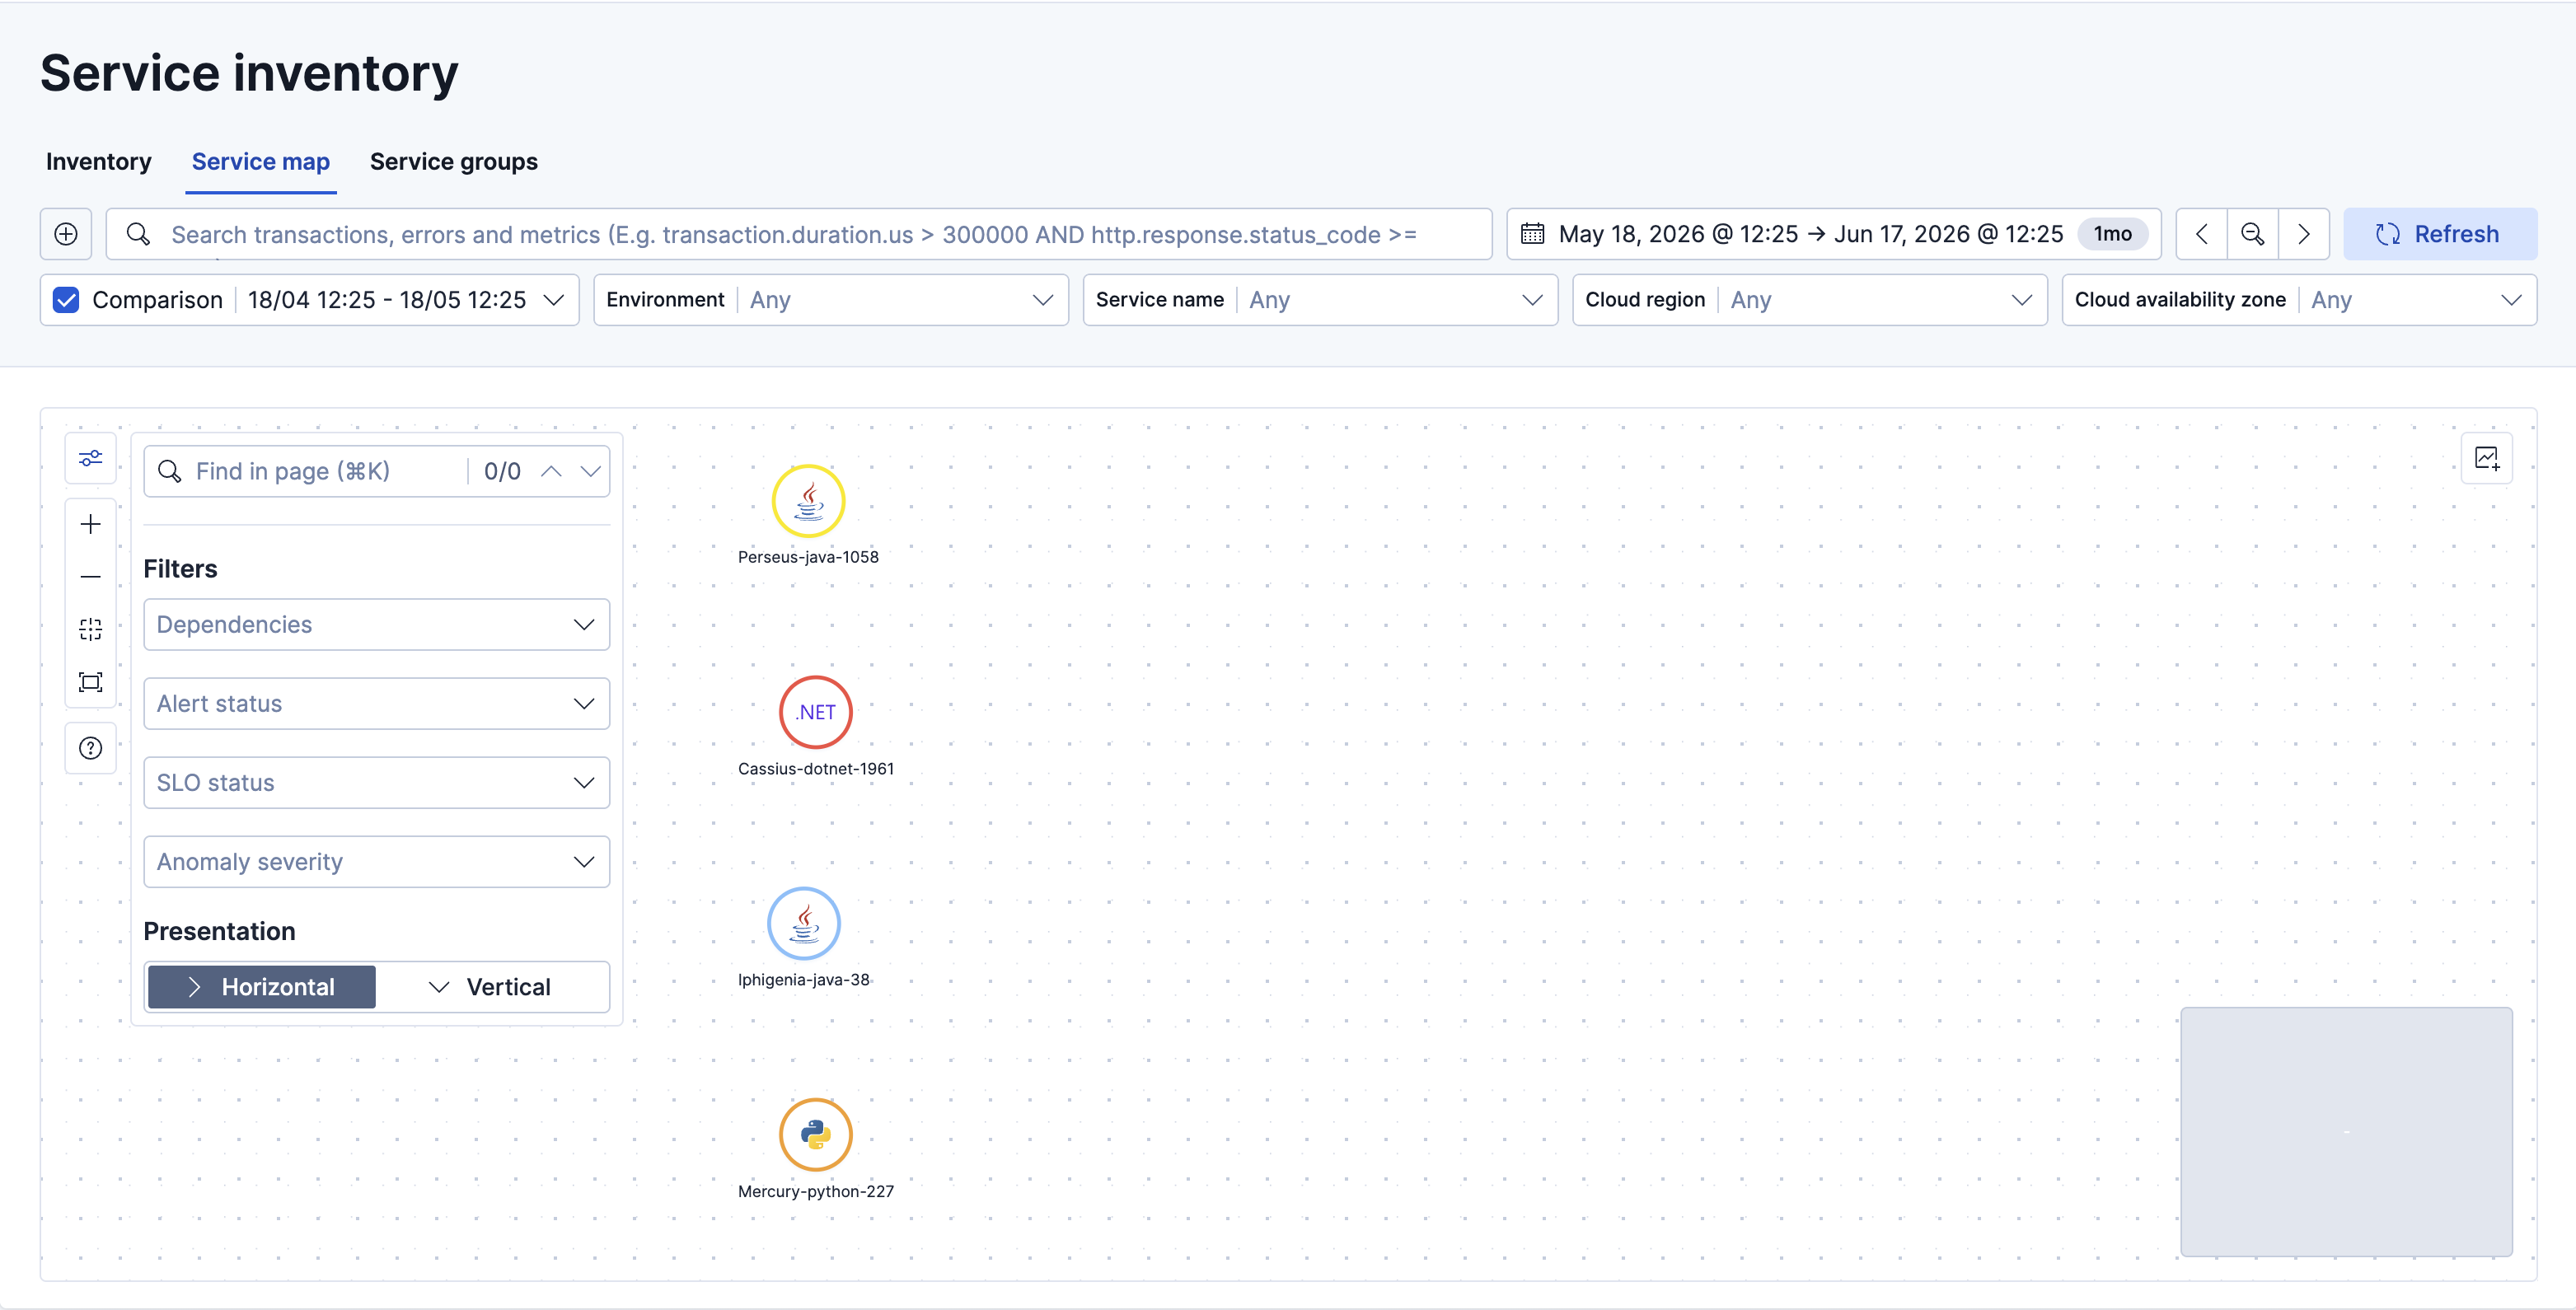
- Service Maps display a color-coded anomaly indicator on each service node based on the detected anomaly score.
- Elastic Stack: Planned Elastic Cloud Serverless: Generally available Alert detail pages for APM anomaly alerts show RED metric charts and the service map, along with [a severity-colored callout](/elastic/docs-content/pull/7588/solutions/observability/apm/service-map#service-maps-legend-anomaly-colors) identifying the anomaly type. For more information, refer to [View alerts](https://docs-v3-preview.elastic.dev/elastic/docs-content/pull/7588/solutions/observability/incident-management/view-alerts).
## Enable anomaly detection
To enable machine learning anomaly detection:
1. In your Elastic Observability Serverless project or Kibana, go to any **Applications** page.
2. Click **Anomaly detection**.
3. Click **Create Job**.
4. Machine learning jobs are created at the environment level. Select all of the service environments that you want to enable anomaly detection in. Anomalies will surface for all services and transaction types within the selected environments.
5. Click **Create Jobs**.
After a few minutes, the job will begin calculating results; it might take additional time for results to appear on your service maps. To manage existing jobs, click **Manage jobs** (or go to **Machine learning** → **Jobs**).
## Anomaly detection warning
To make machine learning as easy as possible to set up, Elastic will warn you when filtered to an environment without a machine learning job.
## No anomaly data showing
After enabling anomaly detection, anomaly indicators might not appear for a service. Here are some reasons why this can occur:
1. No machine learning job exists. Refer to [Enable anomaly detection](#observability-apm-integrate-with-machine-learning-enable-anomaly-detection) to enable anomaly detection and create an machine learning job.
2. There is no machine learning data for the job. If you just created the machine learning job you’ll need to wait a few minutes for data to be available. Alternatively, if the service or its environment are new, you’ll need to wait for more trace data.
3. No "request" or "page-load" transaction type exists for this service; anomaly detection is only available for these transaction types.