---
title: Services
description: The Services inventory provides a quick, high-level overview of the health and general performance of all instrumented services. Active alerts for each...
url: https://docs-v3-preview.elastic.dev/elastic/docs-content/pull/7600/solutions/observability/apm/services
products:
- APM
- Elastic Cloud Serverless
- Elastic Observability
applies_to:
- Elastic Cloud Serverless: Generally available
- Elastic Stack: Generally available
---
# Services
The **Services** inventory provides a quick, high-level overview of the health and general performance of all instrumented services.
A service only appears in the **Services** inventory if it has sent transactions or spans within the selected time window. Services that send only logs are not listed. If a service is missing, verify that it is sending transaction or span data and that the selected time range includes recent activity.
Active alerts for each service are prominently displayed in the service inventory table. Clicking an active alert badge brings you to the [**Alerts**](https://docs-v3-preview.elastic.dev/elastic/docs-content/pull/7600/solutions/observability/apm/create-apm-rules-alerts) tab where you can learn more about the active alert and take action.
Elastic Stack: Planned Elastic Cloud Serverless: Generally available The **Anomalies** column shows each service's highest [machine learning](https://docs-v3-preview.elastic.dev/elastic/docs-content/pull/7600/solutions/observability/apm/machine-learning) anomaly score for the selected time range, replacing the previous health status. To use this feature, anomaly detection must be enabled.
Elastic Stack: Generally available since 9.4 Elastic Cloud Serverless: Generally available SLOs for each service are also shown in the service inventory table. Use the **Actions** menu on any service row to act on the service directly, or the **Environment** selector to filter the inventory by environment.
Elastic Stack: Generally available from 9.0 to 9.3 To help surface potential issues, services are sorted by their health status: **critical** → **warning** → **healthy** → **unknown**. Health status is powered by [machine learning](https://docs-v3-preview.elastic.dev/elastic/docs-content/pull/7600/solutions/observability/apm/machine-learning) and requires anomaly detection to be enabled.
## Service groups
For Observability Serverless projects, the **Editor** role or higher is required to create and manage service groups. To learn more, refer to [Assign user roles and privileges](/elastic/docs-content/pull/7600/deploy-manage/users-roles/cloud-organization/user-roles#general-assign-user-roles).
The Service grouping functionality is in beta and is subject to change. The design and code is less mature than official generally available features and is being provided as-is with no warranties.
Group services together to build meaningful views that remove noise, simplify investigations across services, and combine related alerts.
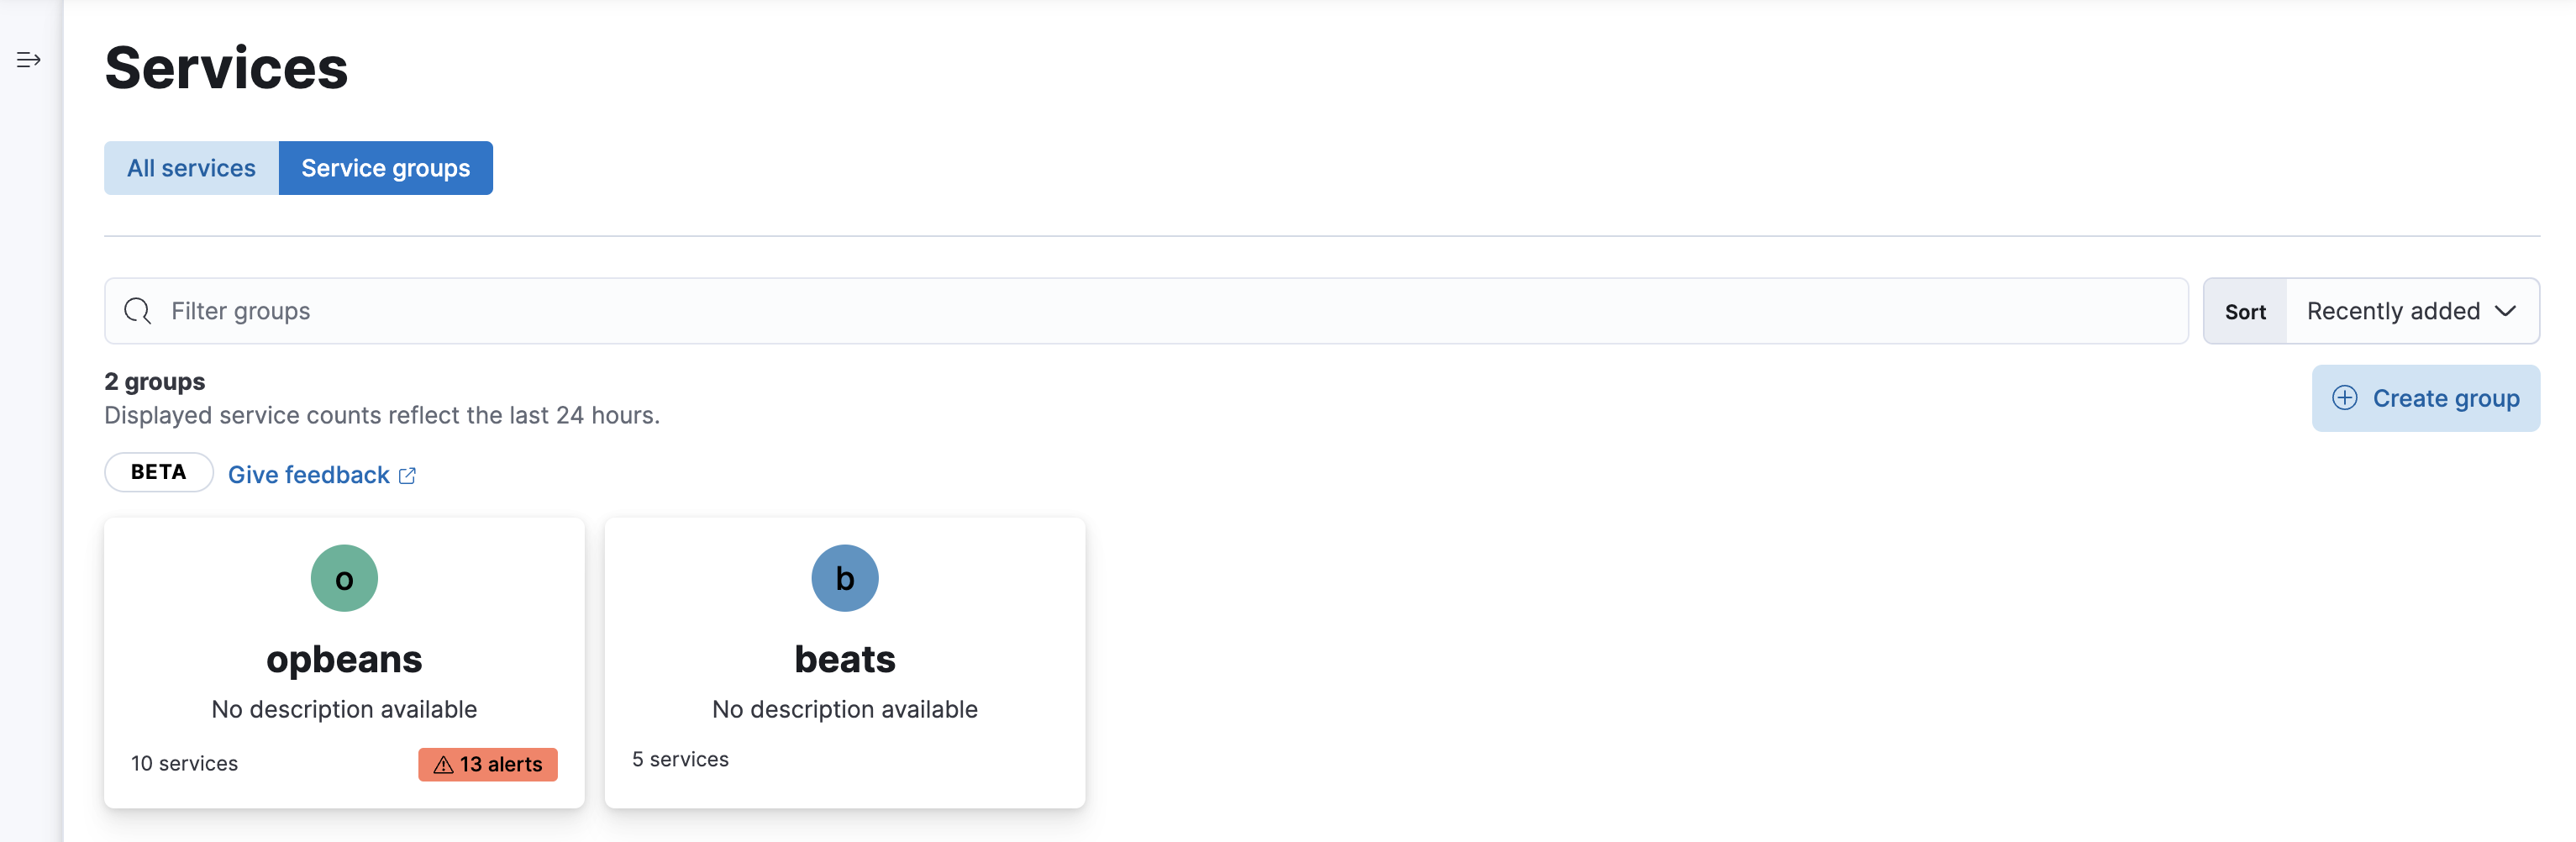
To create a service group:
1. To open **Service inventory**, find **Applications** in the main menu or use the [global search field](https://docs-v3-preview.elastic.dev/elastic/docs-content/pull/7600/explore-analyze/find-and-organize/find-apps-and-objects).
2. Switch to **Service groups**.
3. Click **Create group**.
4. Specify a name, color, and description.
5. Click **Select services**.
6. Specify a [Kibana Query Language (KQL)](https://docs-v3-preview.elastic.dev/elastic/docs-content/pull/7600/explore-analyze/query-filter/languages/kql) query to filter services by one or more of the following dimensions: `agent.name`, `service.name`, `service.language.name`, `service.environment`, `labels.`. Services that match the query within the last 24 hours will be assigned to the group.
### Examples
Not sure where to get started? Here are some sample queries you can build from:
- **Group services by environment**: To group "production" services, use `service.environment : "production"`.
- **Group services by name**: To group all services that end in "beat", use `service.name : *beat`. This will match services named "Auditbeat", "Heartbeat", "Filebeat", and so on.