---
title: Manage discoveries from the Attacks view
description: Triage Attack Discovery findings alongside related alerts from the Attacks view under Detections.
url: https://docs-v3-preview.elastic.dev/elastic/docs-content/pull/7600/solutions/security/ai/attack-discovery/manage-discoveries-from-attacks-page
products:
- Elastic Cloud Serverless
- Elastic Security
applies_to:
- Serverless Security projects: Generally available
- Elastic Stack: Preview in 9.4
---
# Manage discoveries from the Attacks view
The **Attacks** view brings Attack Discovery findings together with their related alerts. Open it at **Detections** → **Views** → **Attacks**.
This page covers how to filter and search attacks, tell manually generated and scheduled attacks apart, review linked alerts, and take triage actions.
## Explore the Attacks view layout
At the top of the **Attacks** view, overview visualizations summarize activity. The **Summary** tab shows the total number of attacks detected and attack volume over time. The **Trends**, **Count**, and **Treemap** tabs describe alerts associated with those attacks.
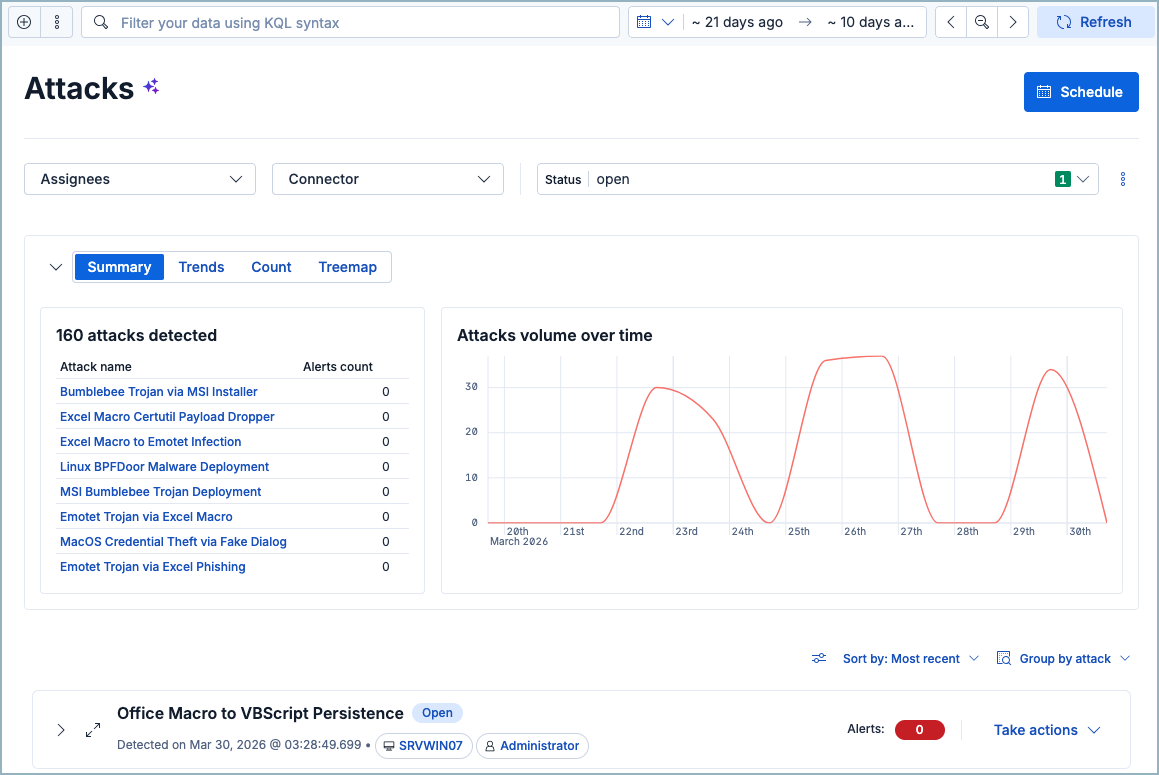
Below the summary, the Attacks table lists individual attacks. Expand an attack to see involved entities and steps in the attack chain.
## Check Attack Discovery runs in Generations
- Serverless Security projects: Generally available
- Elastic Stack: Planned
The **Generations** control center in the **Attacks** view header lists recent Attack Discovery runs. Open it to check run status. When a run finishes, refresh the **Attacks** view to see new results.
Select a run to open **Workflow execution details**. That view shows alert retrieval, generation, and validation, with timing and counts for each step. Use **Inspect** on a step to review its data. For manual, scheduled, and workflow-triggered runs, select **Open conversation** to view the run in Elastic Agent Builder.
If a run fails, is canceled or dismissed, or an analysis step fails, [troubleshoot it with AI](https://docs-v3-preview.elastic.dev/elastic/docs-content/pull/7600/solutions/security/ai/attack-discovery/troubleshoot-runs-from-attacks-page).
## Recognize manually generated and scheduled attacks
The Attacks table lists both manually generated and scheduled discoveries. Both types share the same details flyout and triage actions. To start a manual run, refer to [Manually run Attack Discovery](https://docs-v3-preview.elastic.dev/elastic/docs-content/pull/7600/solutions/security/ai/attack-discovery/manual-runs-from-attacks-page).
| Type | What it is | How to recognize it |
|------------------------|-----------------------------------------------------------------------------------|------------------------------------------------------------------------------------------------------------------------------------------------------------------------------------------------------------------------------------|
| **Scheduled** | Created by a recurring Attack Discovery schedule. | A calendar icon appears in the attack title column and in the Attack flyout header. Hover for the **Scheduled Attack discovery** tooltip. Select the icon to open schedule details, including execution history and configuration. |
| **Manually generated** | Created when you select **Run** on the Attacks view or the Attack Discovery page. | The attack subtitle shows who ran it: detected time, **Run by** with the user's avatar, and the attack summary. The same **Run by** details appear in the Attack flyout summary. |
In 9.4, the **Attacks** view lists scheduled discoveries. Manual runs appear after you start them from the [Attack Discovery page](https://docs-v3-preview.elastic.dev/elastic/docs-content/pull/7600/solutions/security/ai/attack-discovery/run-from-attack-discovery-page).
## Filter and search for attacks
Use the controls at the top of the Attacks table to narrow results:
| Filter method | Description |
|-----------------------------------------------------------------------------------------------------------------------------------------|--------------------------------------------------------------------------------------------------------------|
| KQL search | Enter queries in the search bar. Autocomplete includes fields from both attacks and alerts. |
| Date/time picker | Set a specific time range. |
| Status filter | Filter by [status](#attacks-manage): **Open**, **Acknowledged**, or **Closed**. |
| Elastic Stack: Planned Elastic Cloud Serverless: Generally available Type filter | Show **Scheduled** attacks, **Manually generated** attacks, or both. |
| Elastic Stack: Planned Elastic Cloud Serverless: Generally available Connector filter | Filter attacks by the LLM connector that generated them. |
| Assignees filter | Click **Filter by assignees** to show only attacks or alerts [assigned](#attacks-manage) to specific users. |
| Sort | Use the **Sort by** menu to sort by **Most recent**, **Least recent**, **Most alerts**, or **Least alerts**. |
**Type**, **Connector**, and **Assignees** filter selections persist across page reloads. The **Attacks volume over time** summary graph updates to match the filters you apply.
### Show or hide attacks and anonymized values
Open the **View options** (`controls`) menu for these toggles:
- **Show attacks only** (on by default): Hides standalone alerts that don't belong to any attack. Turn it off to see all alerts, including unlinked ones. Unlinked alerts appear in a group labeled `-` (dash).
- **Show anonymized values**: Replaces attack titles and summaries with anonymized placeholders. Turn this off if you are searching for specific entities such as hostnames or IP addresses.
### Understand how filters apply to attacks and alerts
Filters on the **Attacks** view apply to both attacks and their related alerts at once.
**Timeframe filtering**: An attack appears when the attack or any of its related alerts falls in the selected time range.
- If the attack is in range but its alerts are not, the attack appears with 0 alerts when expanded.
- If the attack is out of range but some related alerts are in range, the attack still appears.
**Alert-only field filters**: Filtering on a field that exists only on alerts can change group statistics and sort order, even though attack groups still appear.**Attack-only field filters**: Filtering on a field that exists only on attacks (for example, the connector that generated an attack) can hide related alerts. The attack still appears, but expanding it may show 0 alerts.**Status filter**: Status checks both the attack and its related alerts. A closed attack can still appear under an **Open** filter when it has open related alerts.**Assignees filter**: Assignees apply to both attacks and alerts. Filtering by assigned user may hide an attack's alerts when those alerts have a different assignee.**KQL autocomplete**: Autocomplete includes fields from both attacks and alerts. A field that exists on only one type can filter out the other.**Alerts count badge**: The **Alerts: N** badge counts detection alerts that match the current filters. When you expand a group, a format like `2/10` means 2 alerts match your current filters and time range, out of 10 alerts historically linked to the attack.
## Review alerts for an attack
- Serverless Security projects: Generally available
- Elastic Stack: Planned
When you open an attack's details, the **Alerts** tab shows the alerts linked to that attack.
By default, the tab shows **all** linked alerts, even when page filters are active. Alerts outside the current filters stay visible but greyed out, so the list still matches the attack's total alert count.
A callout above the alerts table explains this behavior and includes a **Show matching alerts only** toggle. Turn the toggle on if you want to hide non-matching alerts. Your toggle choice persists across attacks.
Attack group statistics in the Attacks table, such as the total alert count, continue to reflect the full set of linked alerts, not only the filtered subset.
## Take actions on an attack
Access actions from the **Take actions** menu on an attack's row in the Attacks table.
When you change an attack's status, assign or unassign it, or apply attack tags, a modal lets you apply the action to the attack only, or to both the attack and its associated alerts. This is the same choice available when [changing a discovery's status](/elastic/docs-content/pull/7600/solutions/security/ai/attack-discovery/manage-discoveries-from-attack-discovery-page#discovery-status).
| Action | How to do it | Notes |
|-------------------------|----------------------------------------------------------------------------|-------------------------------------------------------------------------------------------------------------------------------------------------------------------------------------------------------------------------------------|
| Change status | **Take actions** → **Mark as acknowledged** or **Mark as closed** | Status lifecycle matches [discoveries](/elastic/docs-content/pull/7600/solutions/security/ai/attack-discovery/manage-discoveries-from-attack-discovery-page#discovery-status): **Open** (default), **Acknowledged**, or **Closed**. |
| Run workflow | **Take actions** → **Run workflow** → select a workflow → **Run workflow** | Requires [workflows prerequisites](https://docs-v3-preview.elastic.dev/elastic/docs-content/pull/7600/explore-analyze/workflows/get-started). You can select only enabled workflows. |
| Assign or unassign | **Take actions** → **Assign attack** or **Unassign attack** | Users are not notified when assigned or unassigned. |
| Apply attack tags | **Take actions** → **Apply attack tags** | Use tags to categorize attacks for filtering. |
| Investigate in timeline | **Take actions** → **Investigate in timeline** | Includes all alerts originally correlated when the attack was created. It does not reflect your current page filters or time range. |
| Add to case | **Take actions** → **Add to new case** or **Add to existing case** | Attaches the attack to a [case](https://docs-v3-preview.elastic.dev/elastic/docs-content/pull/7600/solutions/security/investigate/security-cases). |
| View in AI Chat | **Take actions** → **View in AI Chat** | Continue investigating with an [AI agent](https://docs-v3-preview.elastic.dev/elastic/docs-content/pull/7600/explore-analyze/ai-features/ai-chat-experiences). Ask follow-up questions about the attack or its alerts. |