---
title: View detection alert details
description: Use the alert details flyout to investigate, manage, and respond to detection alerts in Elastic Security.
url: https://docs-v3-preview.elastic.dev/elastic/docs-content/pull/7719/solutions/security/detect-and-alert/view-detection-alert-details
products:
- Elastic Cloud Serverless
- Elastic Security
applies_to:
- Serverless Security projects: Generally available
- Elastic Stack: Generally available
---
# View detection alert details
To learn more about an alert, click the **View details** icon (`expand`) from the Alerts table. This opens the alert details flyout, which helps you understand and manage the alert.
Use the alert details flyout to begin an investigation, open a case, or plan a response.
In Elastic Stack 9.0.x-9.4.x, the alert details flyout is organized into a right panel, a left panel, and preview panels, instead of the single flyout described on this page. Some toolbar actions and navigation described below don't apply.
## Alert details flyout UI
The alert details flyout opens as a single flyout over the Alerts table. Refer to [Details flyouts](/elastic/docs-content/pull/7719/solutions/security/get-started/elastic-security-ui#details-flyouts) for the toolbar controls, footer, and child flyout navigation shared across Elastic Security flyouts. To resize the flyout, drag its left edge.
If you've enabled grouping on the Alerts page, expand a group and select an individual alert to open the flyout.
An Kibana administrator can revert to the previous flyout layout by turning off the **Enable new flyout** advanced setting. Refer to [Enable the new flyout system](/elastic/docs-content/pull/7719/solutions/security/get-started/configure-advanced-settings#enable-new-flyout).
### Header
The header displays key alert information. Hover over fields on the **Overview** and **Table** tabs to access [inline actions](/elastic/docs-content/pull/7719/solutions/security/get-started/elastic-security-ui#inline-actions).
If you've configured [`server.publicBaseUrl`](https://docs-v3-preview.elastic.dev/elastic/kibana/tree/main/reference/configuration-reference/general-settings#server-publicbaseurl) in `kibana.yml`, the shareable URL from the header's **Share** action also appears in the `kibana.alert.url` field on the **Table** tab.
#### Alert details
The header displays key alert information:
- **Rule**: The rule that generated the alert
- **Status**: Current alert status and creation time
- **Severity and risk score**: Inherited from the rule
- **Assignees**: Users assigned to the alert (click the **Add** icon `plus_circle` to add more)
- **Notes**: Attached notes (click the **Add** icon `plus_circle` to add a note)
### View formats
Switch between tabs to view alert data in different formats:
**Table tab**
Shows alert fields as name-value pairs.
Elastic Stack: Generally available since 9.1 Click `pin` next to a field to pin it to the top.
Click `gear` **Table settings** for additional options:
| Setting | Description |
|------------------------------|----------------------------------------------------------------------------------|
| Show highlighted fields only | Display only [highlighted fields](#investigation-section). |
| Hide empty fields | Hide fields without values. |
| Hide Kibana alert fields | Hide `kibana.alert` and `signal` fields to focus on investigation-relevant data. |
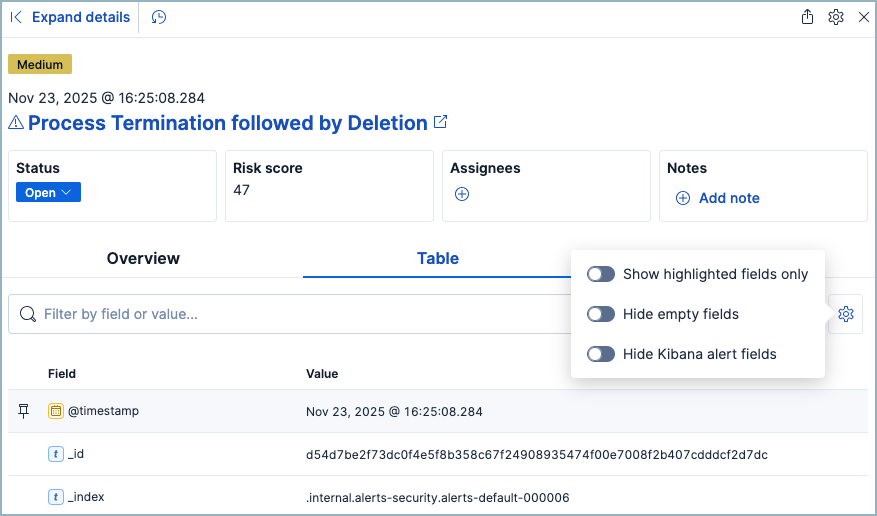
Values for some fields — such as rule names, hosts, and IP addresses — are clickable and open the related flyout.
**JSON tab**
Shows raw JSON. Click **Copy to clipboard** to export.
### Footer
Refer to [Details flyouts](/elastic/docs-content/pull/7719/solutions/security/get-started/elastic-security-ui#details-flyouts) for the footer's **Ask AI Assistant** and **Take action** controls. For the alert, **Take action** includes options for changing its status, adding tags or assignees, adding an exception, isolating a host, running a response action or Osquery, adding a note, or investigating in Timeline.
## About
The About section appears on the **Overview** tab. It provides a brief description of the rule that's related to the alert and an explanation of what generated the alert.
The About section has the following information:
- **Rule description**: Describes the rule's purpose or detection goals. Click **Show rule summary** to open the rule's details in a new flyout. From there, click the rule name to view the full rule details page.
- **Alert reason**: Describes the source event that generated the alert. Event details are displayed in plain text and ordered logically to provide context for the alert. Click **Show full reason** to display the alert reason in the event rendered format in a popover.
The event renderer only displays if an event renderer exists for the alert type. Fields are interactive; hover over them to access the available actions.
- **MITRE ATT&CK**: Shows the tactics and techniques mapped to the rule, when defined.
- **Last alert status change**: Shows the last time the alert's status was changed, along with the user who changed it.
## Investigation
The Investigation section (on the **Overview** tab) provides starting points for investigating the alert.
| Section | What it provides | How to use it |
|---------------------|-------------------------------------------------------------------------------------------------------------------------------------------------------------------------------------------------------------------------------------------------|-----------------------------------------------------------------------------------------------------------------------|
| Investigation guide | Step-by-step instructions written for this rule type. Only appears if the rule has an [investigation guide](https://docs-v3-preview.elastic.dev/elastic/docs-content/pull/7719/solutions/security/detect-and-alert/write-investigation-guides). | Click **Show investigation guide** to open the guide in a new flyout. Follow the steps to investigate systematically. |
| Highlighted fields | Key fields relevant to the alert, plus any [custom highlighted fields](/elastic/docs-content/pull/7719/solutions/security/detect-and-alert/common-rule-settings#rule-ui-advanced-params) defined in the rule. | Review these fields first to quickly understand what triggered the alert. Fields without values are hidden. |
Elastic Stack: Generally available since 9.1 Click **Add field** in the Highlighted fields table to add or remove custom highlighted fields directly from the alert flyout.
## Visualizations
The Visualizations section (on the **Overview** tab) shows how the alert unfolded — the processes that led to it and what happened after, as well as the entities involved and how they're connected. Use these previews to understand the attack chain without leaving the alert flyout. Click a preview to open it in its own flyout for a more detailed view, while keeping the Alerts table visible.
| Section | What it shows | How to use it |
|------------------------------------------------------------------------------------------------------------------------------------|-----------------------------------------------------------------------|---------------------------------------------------------------------------------------------------------------------------------------------------------|
| Session view preview | Process activity during the Linux session | See commands executed before and after the alert. Click to open the **Session view** flyout for the full session history. |
| Analyzer preview | Process tree (up to 3 ancestor and 3 descendant levels) | Trace how the process was spawned and what it launched. The `boxes_horizontal` icon indicates more levels exist. Click to open the **Analyzer** flyout. |
| Graph preview Elastic Stack: Preview since 9.4 Elastic Cloud Serverless: Preview | A graph of the entities involved in the alert and their relationships | See which entities acted and which were targeted, and how they connect. Click to open the **Graph** flyout. |
From the Analyzer or Session view flyout, select a related process or event to view its details. From the Graph flyout, use **Investigate in Timeline** (`timeline`) to continue your investigation there.
### Graph
- Elastic Cloud Serverless: Preview
- Elastic Stack: Preview since 9.4
[Entity store](https://docs-v3-preview.elastic.dev/elastic/docs-content/pull/7719/solutions/security/advanced-entity-analytics/entity-store) must be enabled and populated in the active space, and the alert must contain both an actor entity and at least one target entity.
The **Graph** flyout shows the entities involved in the alert and the relationships between them, helping you understand who or what acted, what was targeted, and how they're connected.
Elastic Security identifies the entities from the alert's fields:
- **Actor**: The entity that performed the action. Elastic Security selects a single actor based on the first set of fields that's populated in the alert, in this order: `user.*`, then `host.*`, then `service.*`, then `entity.*`.
- **Targets**: The entities the action was performed on. Elastic Security captures all matching target entities from the `user.target.*`, `host.target.*`, `service.target.*`, and `entity.target.*` fields.
In the **Graph** flyout, you can:
- Hover over an entity node and click the plus icon `plus_circle` to open the actions menu, then select **Show entity details**.
- Hover over the relationship between two entities and click the plus icon `plus_circle` to open the actions menu, then select **Show related events** or **Show event details**.
- Filter the graph using KQL syntax in the search bar. Supported fields include Entity Unique Identifier (EUID) values (for example, `entity.id : "user:alice@example.com"`) and raw ECS identity fields such as `user.id`, `user.email`, or `user.name`.
- Select **Investigate in Timeline** (`timeline`) to open the current graph view in Timeline.
## Insights
The Insights section is on the **Overview** tab. It offers different perspectives from which you can assess the alert. Click **Entities**, **Threat intelligence**, **Correlations**, or **Prevalence** to open the corresponding flyout with full details.
### Entities
The Entities overview provides high-level details about the user and host that are related to the alert. Host and user risk classifications are also available with a [Platinum subscription](https://www.elastic.co/pricing) or higher in Elastic Stack or the Security Analytics Complete [project feature tier](https://docs-v3-preview.elastic.dev/elastic/docs-content/pull/7719/deploy-manage/deploy/elastic-cloud/project-settings) in Serverless.
#### Entities flyout
From the Overview tab, click **Entities** to open a detailed view of the host and user associated with the alert in a new flyout. This view also includes risk scores and classifications and activity on related hosts and users. Access to these features requires a [Platinum subscription](https://www.elastic.co/pricing) or higher in Elastic Stack or the Security Analytics Complete [project feature tier](https://docs-v3-preview.elastic.dev/elastic/docs-content/pull/7719/deploy-manage/deploy/elastic-cloud/project-settings) in Serverless.
### Threat intelligence
The Threat intelligence overview shows matched indicators, which provide threat intelligence relevant to the alert. It provides the following information:
- **Threat match detected**: Only available when examining an alert generated from an [indicator match](https://docs-v3-preview.elastic.dev/elastic/docs-content/pull/7719/solutions/security/detect-and-alert/indicator-match) rule. Shows the number of matched indicators that are present in the alert document. Shows zero if there are no matched indicators or you're examining an alert generated by another type of rule.
- **Fields enriched with threat intelligence**: Shows the number of matched indicators that are present on an alert that *wasn't* generated from an indicator match rule. If none exist, the total number of matched indicators is zero.
#### Threat intelligence flyout
Click **Threat intelligence** to open a new flyout with details for each matched indicator. Indicators are listed with the most recent first, and you can expand any indicator to see all its mapped fields.
The flyout organizes matches into two sections:
| Section | What it shows | How to use it |
|------------------------------------------|----------------------------------------------------------------------------------------------------------------------------------------------------------------------------------------------------------------------------------|-----------------------------------------------------------------------------------------------------------------------------------------------------------------|
| Threat match detected | Indicators that triggered an [indicator match rule](https://docs-v3-preview.elastic.dev/elastic/docs-content/pull/7719/solutions/security/detect-and-alert/indicator-match). Only appears for alerts from indicator match rules. | Review which specific indicators matched to confirm the threat and assess severity. |
| Fields enriched with threat intelligence | Indicators found by scanning alert fields against your threat intelligence indices. Applies to any rule type. | Check if known malicious IPs, hashes, or URLs appear in the alert. Use the date picker to adjust the search time frame, or click **Inspect** to view the query. |
This flyout queries the threat intelligence indices defined in [`securitySolution:defaultThreatIndex`](/elastic/docs-content/pull/7719/solutions/security/get-started/configure-advanced-settings#update-threat-intel-indices).
Elastic Security checks the following alert fields for matches against your threat intelligence data:
- `file.hash.md5`: The MD5 hash
- `file.hash.sha1`: The SHA1 hash
- `file.hash.sha256`: The SHA256 hash
- `file.pe.imphash`: Imports in a PE file
- `file.elf.telfhash`: Imports in an ELF file
- `file.hash.ssdeep`: The SSDEEP hash
- `source.ip`: The IP address of the source (IPv4 or IPv6)
- `destination.ip`: The event's destination IP address
- `url.full`: The full URL of the event source
- `registry.path`: The full registry path, including the hive, key, and value
### Correlations
The Correlations section reveals connections between alerts, helping you identify attack patterns and scope the impact of a threat. Use correlations to answer questions like: Is this alert part of a larger attack? What other suspicious activity occurred during the same session? Has this alert already been investigated?
The overview displays counts for each correlation type. Click **Correlations** to open a new flyout with full details.
| Correlation type | What it tells you | How to use it |
|-----------------------------------------------------------------------------------------------------------------------------------------------------------------------------------------------------------|-----------------------------------------------------------------------------------------------------------------------------------------------------------------------------------------------------------------------|--------------------------------------------------------------------------------------------------------------------------------------------------------------------------------------------------------------------------------------------------------|
| Suppressed alerts | The rule uses [alert suppression](https://docs-v3-preview.elastic.dev/elastic/docs-content/pull/7719/solutions/security/detect-and-alert/alert-suppression), and this alert represents multiple duplicate detections. | Check the suppression count to understand the true volume of matching events. A high count may indicate an ongoing attack or a noisy rule that needs tuning. |
| Alerts related by source event | Multiple rules triggered on the same underlying event. | Review related alerts to see if different rules detected complementary aspects of the same threat. This helps you understand the full context of a single suspicious event. |
| Cases related to the alert | This alert has been added to one or more cases. | Click a case name to see prior investigation work. Avoid duplicating effort if the alert is already being tracked. |
| Alerts related by session ID | Other alerts occurred during the same Linux session. | Examine the session timeline to trace an attacker's actions from initial access through their objectives. Requires [Session View data](/elastic/docs-content/pull/7719/solutions/security/investigate/session-view#enable-session-view) to be enabled. |
| Alerts related by process ancestry | Alerts share a parent-child process relationship. | Trace execution chains to understand how a threat propagated. Click **Investigate in timeline** to visualize the process tree. |
| Attacks related to this alert Elastic Stack: Generally available since 9.5, Elastic Stack: Preview in 9.4 Elastic Cloud Serverless: Generally available | This alert is linked to one or more [Attack Discovery](https://docs-v3-preview.elastic.dev/elastic/docs-content/pull/7719/solutions/security/ai/attack-discovery) findings. | In the Correlations flyout, review the related attacks table (title, status, and alert count), then click the expand icon (`expand`) on a row to preview that attack's details. |
**Alerts related by process ancestry** requires a [Platinum or higher subscription](https://www.elastic.co/pricing) in Elastic Stack or the appropriate [Serverless project feature tier](https://docs-v3-preview.elastic.dev/elastic/docs-content/pull/7719/deploy-manage/deploy/elastic-cloud/project-settings).
### Prevalence
The Prevalence overview shows whether data from the alert was frequently observed on other host events from the last 30 days. Prevalence calculations use values from the alert's highlighted fields. Highlighted field values that are observed on less than 10% of hosts in your environment are considered uncommon (not prevalent) and are listed individually in the Prevalence overview. Highlighted field values that are observed on more than 10% of hosts in your environment are considered common (prevalent) and are described as frequently observed in the Prevalence overview.
#### Prevalence flyout
Click **Prevalence** to open a new flyout. Examine the table to understand the alert's relationship with other alerts, events, users, and hosts.
Update the date time picker for the table to show data from a different time range.
The Prevalence flyout displays a table with the following columns:
| Column | What it shows | How to use it |
|-----------------|------------------------------------------------------------------------------------------------------------------------------|---------------------------------------------------------------------------------------------------------|
| Field | [Highlighted fields](#investigation-section) and custom highlighted fields from the rule. | Identify which fields are being evaluated for prevalence. |
| Value | The actual values for each highlighted field. | See the specific data being compared across your environment. |
| Alert count | Number of alerts with identical field values (including this alert). | High counts suggest a widespread issue or a noisy detection. Low counts may indicate targeted activity. |
| Document count | Number of non-alert events with identical field values. A dash (`——`) means no matches. | Compare alert volume against normal event volume to assess signal-to-noise ratio. |
| Host prevalence | Percentage of hosts with identical field values. Requires [Platinum subscription](https://www.elastic.co/pricing) or higher. | Low percentages (uncommon values) may indicate suspicious activity. |
| User prevalence | Percentage of users with identical field values. Requires [Platinum subscription](https://www.elastic.co/pricing) or higher. | Uncommon user activity patterns can reveal compromised accounts. |
## Response
The **Response** section is on the **Overview** tab. It shows [response actions](https://docs-v3-preview.elastic.dev/elastic/docs-content/pull/7719/solutions/security/detect-and-alert/using-the-rule-ui) that were added to the rule associated with the alert. Click **Response** to display the response action's results in a new flyout.
## Notes
Click **Add note** or **View notes** in the header's Notes control to open the Notes flyout. It lists all notes attached to the alert, along with the user who created them and when, and lets you add new notes. When you add a new note, the alert's summary also updates to show how many notes are attached to the alert.
Go to the **Notes** [page](/elastic/docs-content/pull/7719/solutions/security/investigate/notes#manage-notes) to find notes that were added to other alerts.