---
title: Create an uptime duration anomaly rule
description: Within the Uptime app, create an Uptime duration anomaly rule to receive notifications based on the response durations for all of the geographic locations...
url: https://docs-v3-preview.elastic.dev/elastic/docs-content/pull/7815/solutions/observability/incident-management/create-an-uptime-duration-anomaly-rule
products:
- Elastic Observability
applies_to:
- Elastic Cloud Serverless: Unavailable
- Elastic Stack: Deprecated since 8.15
---
# Create an uptime duration anomaly rule
Use [Synthetic monitoring](https://docs-v3-preview.elastic.dev/elastic/docs-content/pull/7815/solutions/observability/synthetics) instead of the Uptime app.
Within the Uptime app, create an **Uptime duration anomaly** rule to receive notifications based on the response durations for all of the geographic locations of each monitor. When a monitor runs for an unusual amount of time, at a particular time, an anomaly is recorded and highlighted on the [Monitor duration](https://docs-v3-preview.elastic.dev/elastic/docs-content/pull/7815/solutions/observability/uptime/inspect-duration-anomalies) chart.
## Requirements
To create uptime duration anomaly rules, you need the permission for the Uptime app.
Rules use an API key to authorize all background tasks, including condition checks and triggered actions. The key type depends on your deployment. For details on how API keys authorize rules, refer to [API keys](/elastic/docs-content/pull/7815/explore-analyze/alerting/alerts/alerting-setup#alerting-authorization).
## Indices used by this rule
This rule queries the machine learning anomalies indices and the index patterns specified in the uptime settings. The default is `heartbeat-*` (might include `synthetics-*`). You cannot override these indices on a per-rule basis.
## Conditions
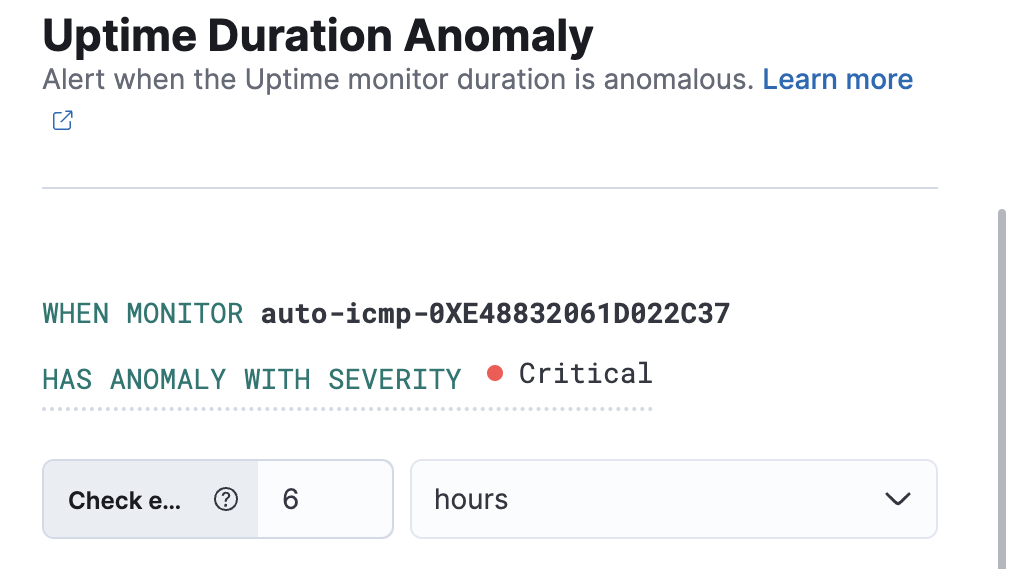
For each rule, you can configure which severity level triggers the alert. The default level is `critical`.
The *anomaly score* is a value from `0` to `100`, which indicates the significance of the anomaly compared to previously seen anomalies. The highly anomalous values are shown in red and the low scored values are indicated in blue.
| | |
|--------------|-----------------------|
| **warning** | Score `0` and above. |
| **minor** | Score `25` and above. |
| **major** | Score `50` and above. |
| **critical** | Score `75` and above. |
## Action types
Extend your rules by connecting them to actions that use the following supported built-in integrations. Actions are Kibana services or integrations with third-party systems that run as background tasks on the Kibana server when rule conditions are met.
You can configure action types on the [Settings](/elastic/docs-content/pull/7815/solutions/observability/uptime/configure-settings#configure-uptime-alert-connectors) page.
- [D3 Security](https://docs-v3-preview.elastic.dev/elastic/kibana/tree/main/reference/connectors-kibana/d3security-action-type)
- [Email](https://docs-v3-preview.elastic.dev/elastic/kibana/tree/main/reference/connectors-kibana/email-action-type)
- [IBM Resilient](https://docs-v3-preview.elastic.dev/elastic/kibana/tree/main/reference/connectors-kibana/resilient-action-type)
- [Index](https://docs-v3-preview.elastic.dev/elastic/kibana/tree/main/reference/connectors-kibana/index-action-type)
- [Jira](https://docs-v3-preview.elastic.dev/elastic/kibana/tree/main/reference/connectors-kibana/jira-action-type)
- [Microsoft Teams](https://docs-v3-preview.elastic.dev/elastic/kibana/tree/main/reference/connectors-kibana/teams-action-type)
- [Observability AI Assistant connector](https://docs-v3-preview.elastic.dev/elastic/kibana/tree/main/reference/connectors-kibana/obs-ai-assistant-action-type)
- [Opsgenie](https://docs-v3-preview.elastic.dev/elastic/kibana/tree/main/reference/connectors-kibana/opsgenie-action-type)
- [PagerDuty](https://docs-v3-preview.elastic.dev/elastic/kibana/tree/main/reference/connectors-kibana/pagerduty-action-type)
- [Server log](https://docs-v3-preview.elastic.dev/elastic/kibana/tree/main/reference/connectors-kibana/server-log-action-type)
- [ServiceNow ITOM](https://docs-v3-preview.elastic.dev/elastic/kibana/tree/main/reference/connectors-kibana/servicenow-itom-action-type)
- [ServiceNow ITSM](https://docs-v3-preview.elastic.dev/elastic/kibana/tree/main/reference/connectors-kibana/servicenow-action-type)
- [ServiceNow SecOps](https://docs-v3-preview.elastic.dev/elastic/kibana/tree/main/reference/connectors-kibana/servicenow-sir-action-type)
- [Slack](https://docs-v3-preview.elastic.dev/elastic/kibana/tree/main/reference/connectors-kibana/slack-action-type)
- [Swimlane](https://docs-v3-preview.elastic.dev/elastic/kibana/tree/main/reference/connectors-kibana/swimlane-action-type)
- [Torq](https://docs-v3-preview.elastic.dev/elastic/kibana/tree/main/reference/connectors-kibana/torq-action-type)
- [Webhook](https://docs-v3-preview.elastic.dev/elastic/kibana/tree/main/reference/connectors-kibana/webhook-action-type)
- [xMatters](https://docs-v3-preview.elastic.dev/elastic/kibana/tree/main/reference/connectors-kibana/xmatters-action-type)
Some connector types are paid commercial features, while others are free. For a comparison of the Elastic subscription levels, go to [the subscription page](https://www.elastic.co/subscriptions).
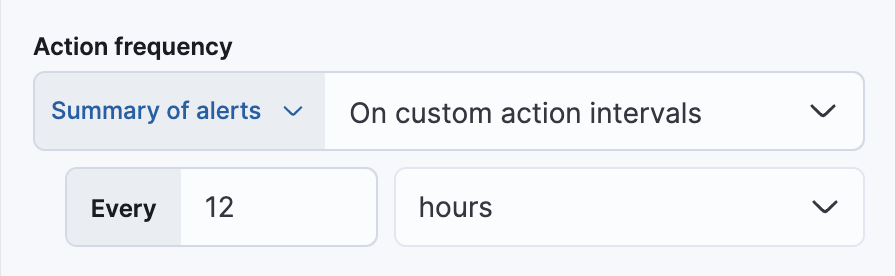
After you select a connector, you must set the action frequency. You can choose to create a summary of alerts on each check interval or on a custom interval. For example, send email notifications that summarize the new, ongoing, and recovered alerts every twelve hours:
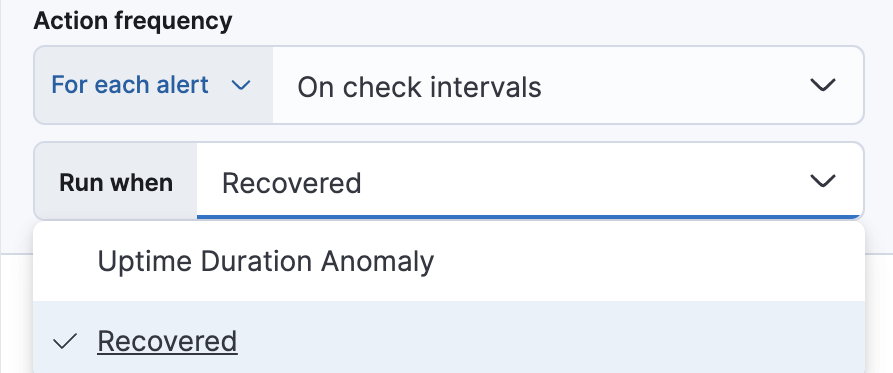
Alternatively, you can set the action frequency such that you choose how often the action runs (for example, at each check interval, only when the alert status changes, or at a custom action interval). In this case, you must also select the specific threshold condition that affects when actions run: `Uptime Duration Anomaly` or `Recovered`.
## Action variables
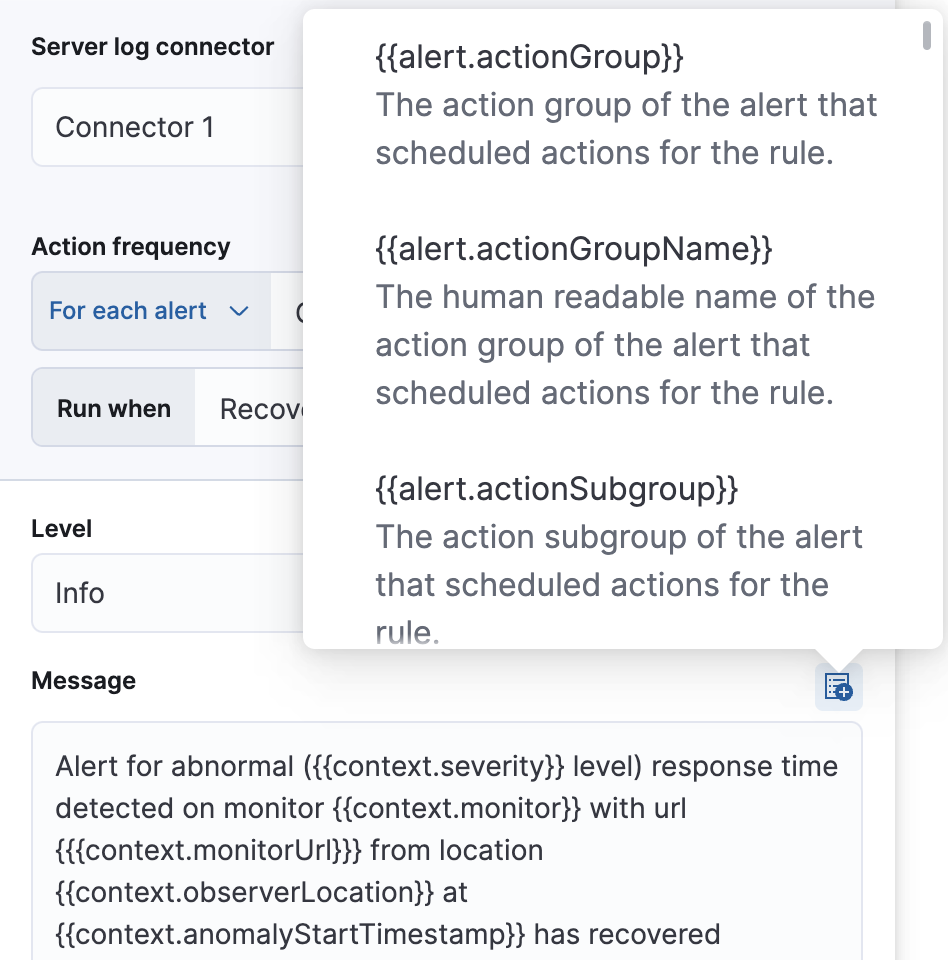
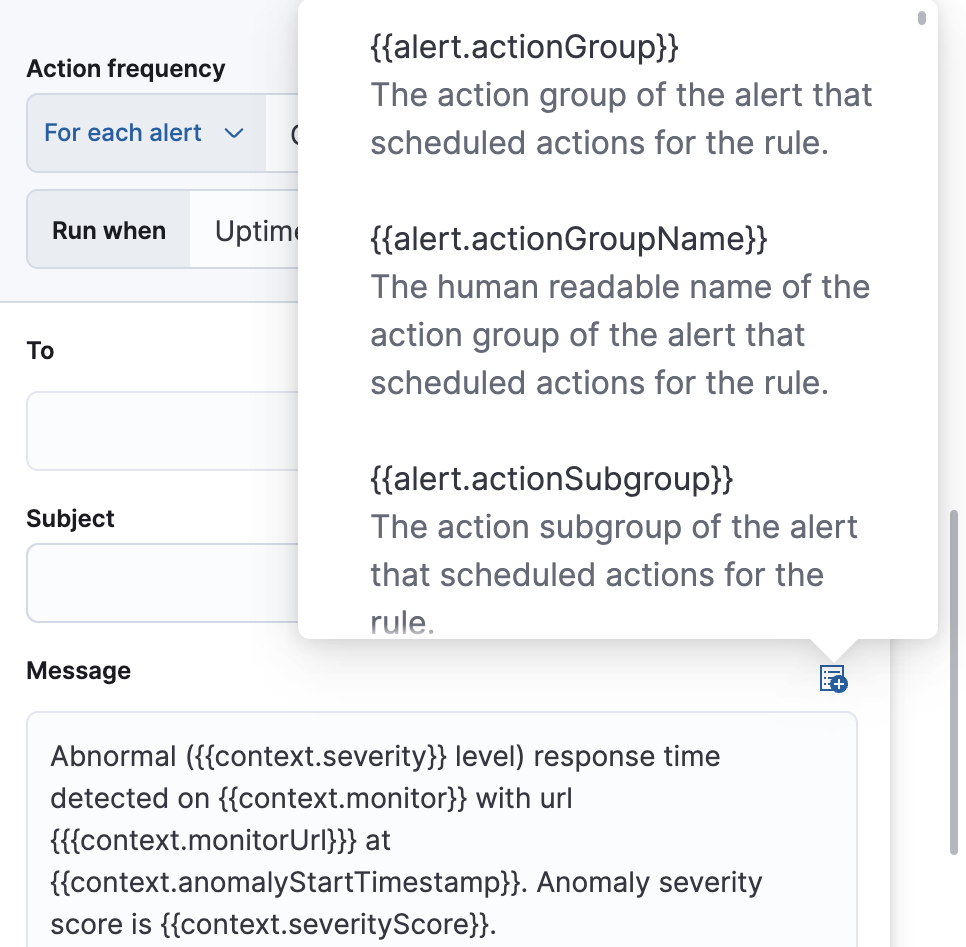
Use the default notification message or customize it. You can add more context to the message by clicking the icon above the message text box and selecting from a list of available variables.
## Alert recovery
To receive a notification when the alert recovers, select **Run when Recovered**. Use the default notification message or customize it. You can add more context to the message by clicking the icon above the message text box and selecting from a list of available variables.