﻿---
title: Custom panel examples
description: Ready-to-use custom panel examples for Kibana dashboards, each with its ES|QL query, Liquid template, and screenshot, from a Sankey diagram to a status board.
url: https://docs-v3-preview.elastic.dev/elastic/docs-content/pull/8169/explore-analyze/visualize/custom-panel-examples
products:
  - Kibana
applies_to:
  - Elastic Cloud Serverless: Preview
  - Elastic Stack: Planned
---

# Custom panel examples
Each example on this page shows what a [custom panel](https://docs-v3-preview.elastic.dev/elastic/docs-content/pull/8169/explore-analyze/visualize/custom-panels) can do that other panel types can't, with the query and the template that produce it. Three of them were generated with Elastic Agent Builder chat and include the prompt.
To try an example, [add a custom panel from the dashboard](/elastic/docs-content/pull/8169/explore-analyze/visualize/custom-panels#custom-panels-create-from-dashboard), paste the query into **Data source (ES|QL)** and the template into **Template (HTML)**, then select **Run preview**. The queries use the [sample data sets](https://docs-v3-preview.elastic.dev/elastic/docs-content/pull/8169/manage-data/ingest/sample-data) named in each example. The screenshots use the dark theme. Templates that use the theme properties render in the light theme as well.
You can change any template, whether generated or hand-written, as long as it follows the [LiquidJS syntax](https://liquidjs.com/tutorials/intro-to-liquid.html). Edit it in the flyout, or ask Elastic Agent Builder to refine it. Templates that use the `--cc-color-*` theme properties follow the Kibana theme.

## Sankey diagram

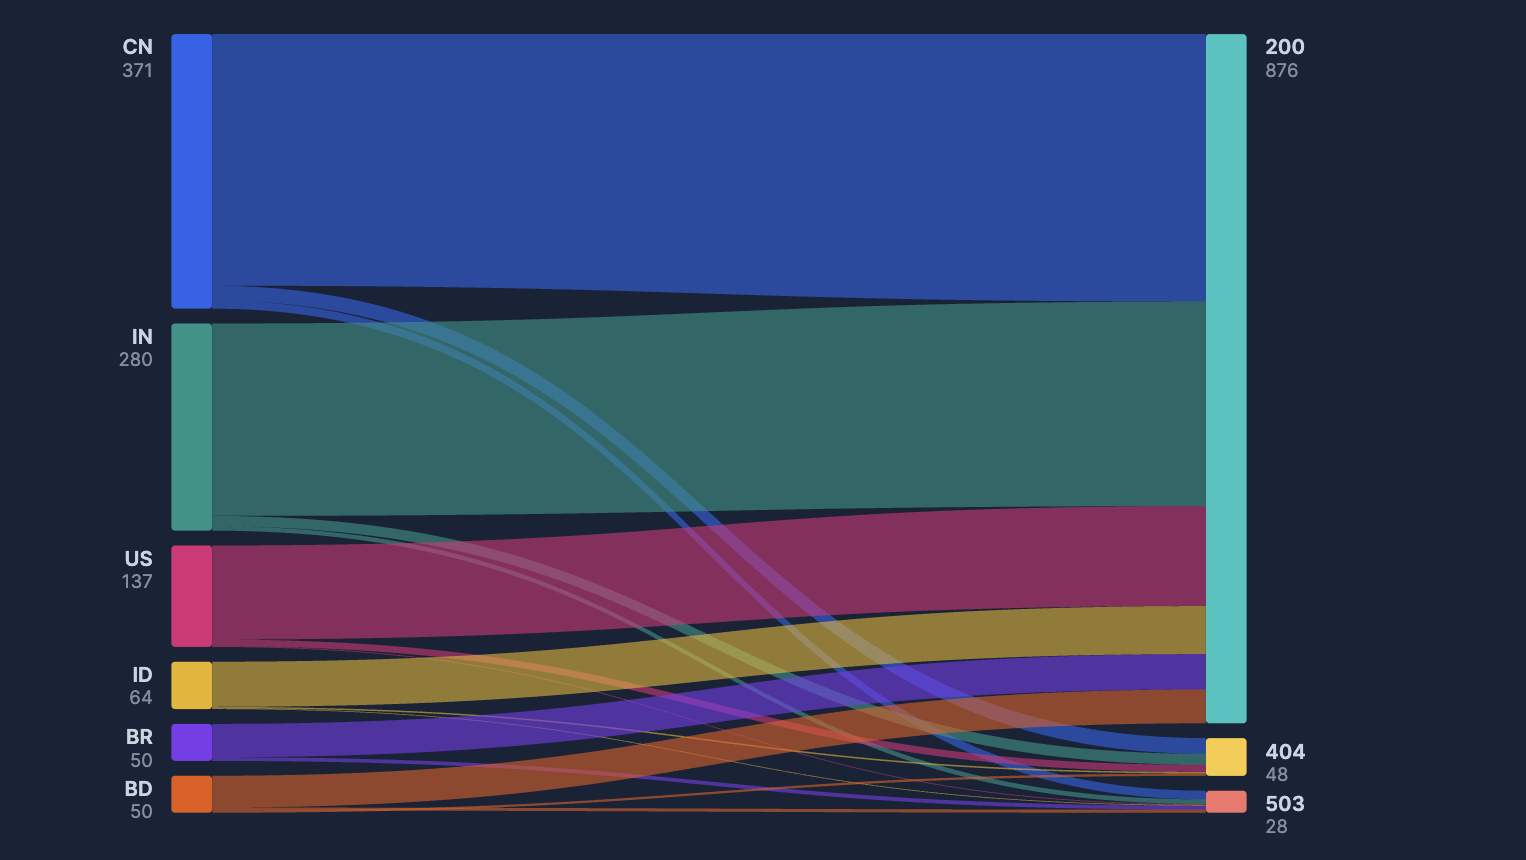
A chart type that isn't available in Visualizations and is complex to build as a Vega visualization. This panel maps the six busiest destination countries in the web logs to the response codes they received. The ribbon thickness follows the count, the response codes are colored by class (2xx, 4xx, 5xx), and hovering a ribbon shows its value with a CSS-only tooltip. Sample data: **Sample web logs**.
![Sankey diagram with colored ribbons flowing from six destination countries to three response codes](https://docs-v3-preview.elastic.dev/elastic/docs-content/pull/8169/explore-analyze/images/custom-panels-example-sankey.png)

<dropdown title="Prompt">
  Elastic Agent Builder generated the panel from **Generate with chat** with this prompt.
  ```text
  Create a custom HTML panel with a Sankey diagram of web traffic from kibana_sample_data_logs: left column = top 6 destination countries (geo.dest), right column = response code (response.keyword). Use an ES|QL query with STATS COUNT(*) BY geo.dest, response.keyword so the diagram follows the dashboard time filter. Draw ribbons as inline SVG paths whose thickness is proportional to the count.
  ```
</dropdown>

<dropdown title="Query">
  ```esql
  FROM kibana_sample_data_logs
  | STATS count = COUNT(*) BY geo.dest, response.keyword
  | SORT count DESC
  ```
</dropdown>

<dropdown title="Template">
  The query returns one row per country and response code. The template computes the country totals and selects the top six countries in Liquid.
  ```html
  <style>
    body {
      margin: 0;
      padding: 16px;
      box-sizing: border-box;
      font-family: Inter, system-ui, sans-serif;
      color: var(--cc-color-text);
      background: var(--cc-color-background);
    }
    .sankey-wrap {
      width: 100%;
      background: var(--cc-color-surface);
      border-radius: 8px;
      padding: 12px;
      box-sizing: border-box;
    }
    .empty {
      display: flex;
      align-items: center;
      justify-content: center;
      height: 300px;
      color: var(--cc-color-text);
      opacity: 0.6;
      font-size: 16px;
    }
    svg { display: block; width: 100%; height: auto; }
    .node-rect { rx: 2; }
    .node-label {
      font-size: 11px;
      fill: var(--cc-color-text);
      font-weight: 600;
    }
    .node-sub {
      font-size: 10px;
      fill: var(--cc-color-text);
      opacity: 0.6;
    }
    .ribbon {
      transition: fill-opacity 0.15s ease;
      fill-opacity: 0.6;
    }
    .ribbon:hover { fill-opacity: 0.85; }
    .ribbon-group .tip { opacity: 0; pointer-events: none; }
    .ribbon-group:hover .tip { opacity: 1; }
    .tip-bg { fill: var(--cc-color-text); }
    .tip-text { fill: var(--cc-color-background); font-size: 11px; font-weight: 600; }
  </style>

  {% comment %}
    Layout constants (SVG user units):
    viewBox width 1000, height 460
    Left column x: 210..232 (rect), labels right-aligned ending at 200
    Right column x: 768..790 (rect), labels start at 800
    Vertical usable: top 20 .. bottom 440  (height 420)
  {% endcomment %}

  {% if rows.size == 0 %}
    <div class="sankey-wrap"><div class="empty">No data</div></div>
  {% else %}

  {% comment %} ---- Build aggregated totals per country ---- {% endcomment %}
  {% assign countries = "" %}
  {% assign country_totals = "" %}
  {% for row in rows %}
    {% assign c = row["geo.dest"].value %}
    {% assign cnt = row["count"].value %}
    {% assign found = false %}
    {% assign newTotals = "" %}
    {% assign idx = 0 %}
    {% assign clist = countries | split: "|" %}
    {% assign tlist = country_totals | split: "|" %}
    {% for cc in clist %}
      {% if cc == c %}
        {% assign found = true %}
        {% assign prev = tlist[idx] | plus: 0 %}
        {% assign nt = prev | plus: cnt %}
        {% assign newTotals = newTotals | append: nt | append: "|" %}
      {% else %}
        {% assign newTotals = newTotals | append: tlist[idx] | append: "|" %}
      {% endif %}
      {% assign idx = idx | plus: 1 %}
    {% endfor %}
    {% if found %}
      {% assign country_totals = newTotals | remove_last: "|" %}
    {% else %}
      {% if countries == "" %}
        {% assign countries = c %}
        {% assign country_totals = cnt | append: "" %}
      {% else %}
        {% assign countries = countries | append: "|" | append: c %}
        {% assign country_totals = country_totals | append: "|" | append: cnt %}
      {% endif %}
    {% endif %}
  {% endfor %}

  {% assign clist = countries | split: "|" %}
  {% assign tlist = country_totals | split: "|" %}

  {% comment %} ---- Selection sort: pick TOP 6 countries by total ---- {% endcomment %}
  {% assign top_countries = "" %}
  {% assign top_totals = "" %}
  {% assign used = "" %}
  {% assign limit = 6 %}
  {% if clist.size < 6 %}{% assign limit = clist.size %}{% endif %}
  {% for n in (1..6) %}
    {% if forloop.index0 < limit %}
      {% assign bestVal = -1 %}
      {% assign bestIdx = -1 %}
      {% assign i = 0 %}
      {% for cc in clist %}
        {% assign usedMark = "#" | append: i | append: "#" %}
        {% assign uContain = used | append: "" %}
        {% unless uContain contains usedMark %}
          {% assign v = tlist[i] | plus: 0 %}
          {% if v > bestVal %}
            {% assign bestVal = v %}
            {% assign bestIdx = i %}
          {% endif %}
        {% endunless %}
        {% assign i = i | plus: 1 %}
      {% endfor %}
      {% if bestIdx >= 0 %}
        {% assign used = used | append: "#" | append: bestIdx | append: "#" %}
        {% if top_countries == "" %}
          {% assign top_countries = clist[bestIdx] %}
          {% assign top_totals = tlist[bestIdx] | append: "" %}
        {% else %}
          {% assign top_countries = top_countries | append: "|" | append: clist[bestIdx] %}
          {% assign top_totals = top_totals | append: "|" | append: tlist[bestIdx] %}
        {% endif %}
      {% endif %}
    {% endif %}
  {% endfor %}

  {% assign topList = top_countries | split: "|" %}
  {% assign topTotals = top_totals | split: "|" %}

  {% comment %} ---- Build right-column response totals from retained rows ---- {% endcomment %}
  {% assign responses = "" %}
  {% assign resp_totals = "" %}
  {% for row in rows %}
    {% assign c = row["geo.dest"].value %}
    {% assign gmark = "|" | append: c | append: "|" %}
    {% assign topGuard = "|" | append: top_countries | append: "|" %}
    {% if topGuard contains gmark %}
      {% assign r = row["response.keyword"].value %}
      {% assign cnt = row["count"].value %}
      {% assign found = false %}
      {% assign newTotals = "" %}
      {% assign idx = 0 %}
      {% assign rlist = responses | split: "|" %}
      {% assign rtl = resp_totals | split: "|" %}
      {% for rr in rlist %}
        {% if rr == r %}
          {% assign found = true %}
          {% assign prev = rtl[idx] | plus: 0 %}
          {% assign nt = prev | plus: cnt %}
          {% assign newTotals = newTotals | append: nt | append: "|" %}
        {% else %}
          {% assign newTotals = newTotals | append: rtl[idx] | append: "|" %}
        {% endif %}
        {% assign idx = idx | plus: 1 %}
      {% endfor %}
      {% if found %}
        {% assign resp_totals = newTotals | remove_last: "|" %}
      {% else %}
        {% if responses == "" %}
          {% assign responses = r %}
          {% assign resp_totals = cnt | append: "" %}
        {% else %}
          {% assign responses = responses | append: "|" | append: r %}
          {% assign resp_totals = resp_totals | append: "|" | append: cnt %}
        {% endif %}
      {% endif %}
    {% endif %}
  {% endfor %}

  {% assign respList = responses | split: "|" %}
  {% assign respTotals = resp_totals | split: "|" %}

  {% comment %} ---- Grand total for scaling ---- {% endcomment %}
  {% assign grand = 0 %}
  {% for t in topTotals %}{% assign grand = grand | plus: t %}{% endfor %}

  {% comment %} ---- Geometry ---- {% endcomment %}
  {% assign topY = 20 %}
  {% assign usableH = 420 %}
  {% assign nGapL = topList.size | minus: 1 %}
  {% assign nGapR = respList.size | minus: 1 %}
  {% assign gap = 8 %}
  {% assign leftGapTotal = nGapL | times: gap %}
  {% assign rightGapTotal = nGapR | times: gap %}
  {% assign leftDrawH = usableH | minus: leftGapTotal %}
  {% assign rightDrawH = usableH | minus: rightGapTotal %}
  {% comment %} we use fractional via float divide: {% endcomment %}
  {% assign pxLeftF = leftDrawH | times: 1.0 | divided_by: grand %}
  {% assign pxRightF = rightDrawH | times: 1.0 | divided_by: grand %}

  <div class="sankey-wrap">
  <svg viewBox="0 0 1000 460" preserveAspectRatio="xMidYMid meet" xmlns="http://www.w3.org/2000/svg" font-family="Inter, system-ui, sans-serif">

    {% comment %} palette {% endcomment %}
    {% assign palette = "#2563eb,#0d9488,#db2777,#eab308,#7c3aed,#ea580c" | split: "," %}

    {% comment %} ============ LEFT NODES ============ {% endcomment %}
    {% comment %} store y-start for each country as running array via appended string {% endcomment %}
    {% assign leftYstarts = "" %}
    {% assign curY = topY %}
    {% for c in topList %}
      {% assign ci = forloop.index0 %}
      {% assign tot = topTotals[ci] | plus: 0 %}
      {% assign h = tot | times: pxLeftF %}
      {% assign color = palette[ci] %}
      <rect class="node-rect" x="210" y="{{ curY }}" width="22" height="{{ h }}" fill="{{ color }}" rx="2"></rect>
      <text class="node-label" x="200" y="{{ curY | plus: 11 }}" text-anchor="end">{{ c }}</text>
      <text class="node-sub" x="200" y="{{ curY | plus: 23 }}" text-anchor="end">{{ tot }}</text>
      {% if leftYstarts == "" %}
        {% assign leftYstarts = curY | append: "" %}
      {% else %}
        {% assign leftYstarts = leftYstarts | append: "|" | append: curY %}
      {% endif %}
      {% assign curY = curY | plus: h | plus: gap %}
    {% endfor %}
    {% assign leftYarr = leftYstarts | split: "|" %}

    {% comment %} ============ RIGHT NODES ============ {% endcomment %}
    {% assign rightYstarts = "" %}
    {% assign curY = topY %}
    {% for r in respList %}
      {% assign ri = forloop.index0 %}
      {% assign tot = respTotals[ri] | plus: 0 %}
      {% assign h = tot | times: pxRightF %}
      {% assign rcode = r | append: "" %}
      {% assign firstDigit = rcode | slice: 0 %}
      {% if firstDigit == "2" %}
        {% assign respFill = "var(--cc-color-accent)" %}
      {% elsif firstDigit == "4" %}
        {% assign respFill = "var(--cc-color-warning)" %}
      {% elsif firstDigit == "5" %}
        {% assign respFill = "var(--cc-color-danger)" %}
      {% else %}
        {% assign respFill = "var(--cc-color-primary)" %}
      {% endif %}
      <rect class="node-rect" x="768" y="{{ curY }}" width="22" height="{{ h }}" fill="{{ respFill }}" rx="2"></rect>
      <text class="node-label" x="800" y="{{ curY | plus: 11 }}" text-anchor="start">{{ r }}</text>
      <text class="node-sub" x="800" y="{{ curY | plus: 23 }}" text-anchor="start">{{ tot }}</text>
      {% if rightYstarts == "" %}
        {% assign rightYstarts = curY | append: "" %}
      {% else %}
        {% assign rightYstarts = rightYstarts | append: "|" | append: curY %}
      {% endif %}
      {% assign curY = curY | plus: h | plus: gap %}
    {% endfor %}
    {% assign rightYarr = rightYstarts | split: "|" %}

    {% comment %} ============ RIBBONS ============ {% endcomment %}
    {% comment %} track running offset within each left node and each right node using strings {% endcomment %}
    {% assign leftOffsets = "" %}
    {% for c in topList %}
      {% if leftOffsets == "" %}{% assign leftOffsets = "0" %}{% else %}{% assign leftOffsets = leftOffsets | append: "|0" %}{% endif %}
    {% endfor %}
    {% assign rightOffsets = "" %}
    {% for r in respList %}
      {% if rightOffsets == "" %}{% assign rightOffsets = "0" %}{% else %}{% assign rightOffsets = rightOffsets | append: "|0" %}{% endif %}
    {% endfor %}

    {% comment %} We must iterate rows in a stable order. To keep stacking deterministic
       within each left node grouped by country, loop over topList outer, rows inner. {% endcomment %}
    {% for c in topList %}
      {% assign ci = forloop.index0 %}
      {% assign lColor = palette[ci] %}
      {% assign lY0 = leftYarr[ci] | plus: 0 %}
      {% assign lRunning = 0 %}
      {% for row in rows %}
        {% assign rc = row["geo.dest"].value %}
        {% if rc == c %}
          {% assign resp = row["response.keyword"].value %}
          {% assign cnt = row["count"].value %}
          {% comment %} find right node index {% endcomment %}
          {% assign rIdx = -1 %}
          {% assign k = 0 %}
          {% for rr in respList %}
            {% if rr == resp %}{% assign rIdx = k %}{% endif %}
            {% assign k = k | plus: 1 %}
          {% endfor %}
          {% if rIdx >= 0 %}
            {% assign thickL = cnt | times: pxLeftF %}
            {% assign thickR = cnt | times: pxRightF %}
            {% comment %} left y position {% endcomment %}
            {% assign lTop = lY0 | plus: lRunning %}
            {% assign lBot = lTop | plus: thickL %}
            {% assign lRunning = lRunning | plus: thickL %}
            {% comment %} right offset for this response {% endcomment %}
            {% assign roArr = rightOffsets | split: "|" %}
            {% assign rOff = roArr[rIdx] | plus: 0 %}
            {% assign rY0 = rightYarr[rIdx] | plus: 0 %}
            {% assign rTop = rY0 | plus: rOff %}
            {% assign rBot = rTop | plus: thickR %}
            {% comment %} update right offsets string {% endcomment %}
            {% assign newRO = "" %}
            {% assign j = 0 %}
            {% for oo in roArr %}
              {% if j == rIdx %}
                {% assign nv = rOff | plus: thickR %}
                {% assign newRO = newRO | append: nv | append: "|" %}
              {% else %}
                {% assign newRO = newRO | append: oo | append: "|" %}
              {% endif %}
              {% assign j = j | plus: 1 %}
            {% endfor %}
            {% assign rightOffsets = newRO | remove_last: "|" %}

            {% assign x1 = 232 %}
            {% assign x2 = 768 %}
            {% assign mid = 500 %}
            {% assign tipX = 480 %}
            {% assign tipY = lTop | plus: rTop | divided_by: 2 | plus: 6 %}

            <g class="ribbon-group">
              <path class="ribbon"
                d="M {{ x1 }} {{ lTop }}
                   C {{ mid }} {{ lTop }}, {{ mid }} {{ rTop }}, {{ x2 }} {{ rTop }}
                   L {{ x2 }} {{ rBot }}
                   C {{ mid }} {{ rBot }}, {{ mid }} {{ lBot }}, {{ x1 }} {{ lBot }}
                   Z"
                fill="{{ lColor }}"></path>
              <g class="tip">
                <rect class="tip-bg" x="{{ tipX | minus: 6 }}" y="{{ tipY | minus: 13 }}" width="150" height="20" rx="4"></rect>
                <text class="tip-text" x="{{ tipX }}" y="{{ tipY }}">{{ c }} → {{ resp }}: {{ cnt }}</text>
              </g>
            </g>
          {% endif %}
        {% endif %}
      {% endfor %}
    {% endfor %}

  </svg>
  </div>
  {% endif %}
  ```
</dropdown>


## Flowchart

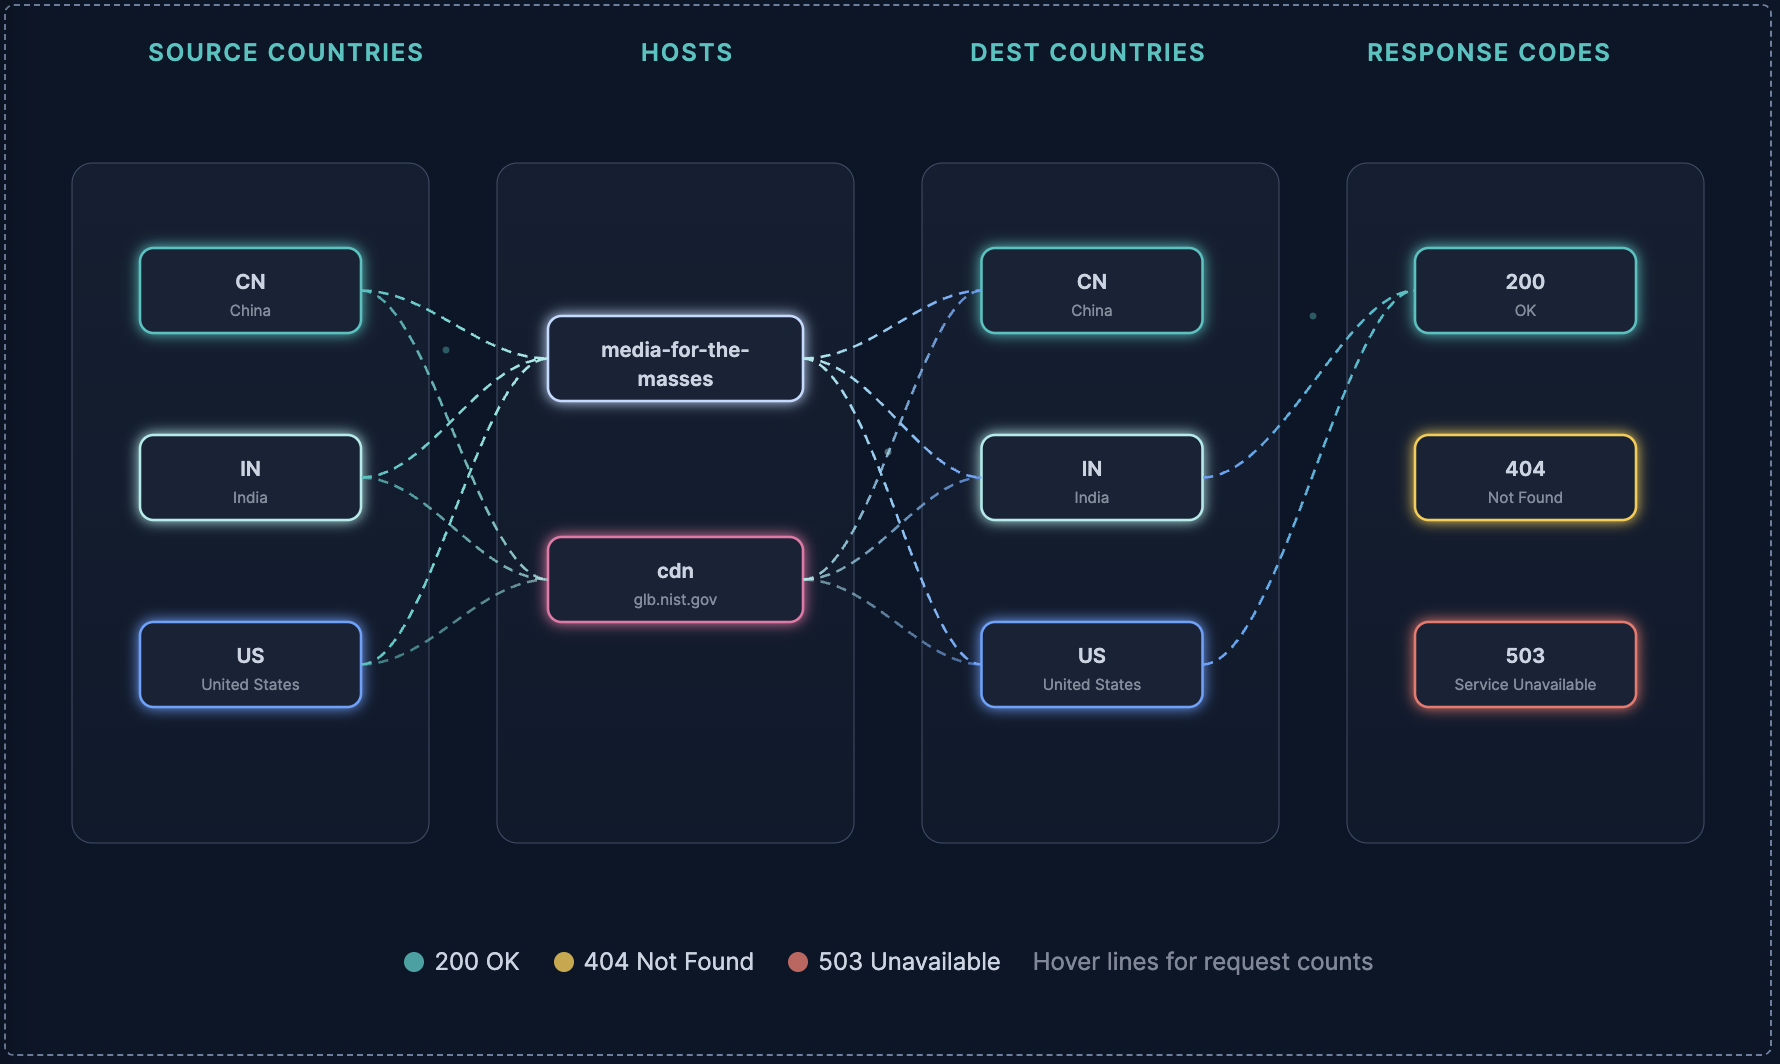
Web traffic drawn as four stages, from source country through host and destination country to response code. The dashed connections come from the query, are colored by response class, and show the request count in a tooltip when you hover them. Data: web server logs in a `logstash*` index with `geo.src`, `host`, `geo.dest`, and `response` fields.
![Flowchart with four columns of boxes for source countries, hosts, destination countries, and response codes, connected by dashed curved lines](https://docs-v3-preview.elastic.dev/elastic/docs-content/pull/8169/explore-analyze/images/custom-panels-example-flowchart.png)

<dropdown title="Prompt">
  Elastic Agent Builder generated the panel from **Generate with chat** with this prompt.
  ```text
  Add a flowchart panel showing how the data is flowing in logstash* and add a tooltip when hovering the lines to see number of requests.
  ```
</dropdown>

<dropdown title="Query">
  To run the example on the **Sample web logs** instead, use `FROM kibana_sample_data_logs` and replace `response` with `response.keyword` in the query and in the template.
  ```esql
  FROM logstash*
  | STATS count = COUNT(*) BY geo.src, host.keyword, geo.dest, response
  | SORT count DESC
  | LIMIT 50
  ```
</dropdown>

<dropdown title="Template">
  The boxes are fixed in the template, with the countries, hosts, and response codes the agent found in the data. Only the connections between them come from the query rows. The tooltips use the SVG `title` element, which needs no JavaScript.
  ```html
  <style>
    body {
      margin: 0;
      padding: 16px;
      box-sizing: border-box;
      font-family: Inter, system-ui, sans-serif;
      color: var(--cc-color-text);
      background: var(--cc-color-background);
    }
    .flow-container {
      width: 100%;
      overflow-x: auto;
    }
    .stage-labels {
      display: flex;
      justify-content: space-around;
      padding: 0 24px;
      margin-bottom: 8px;
    }
    .stage-label {
      font-size: 0.75rem;
      font-weight: 600;
      text-transform: uppercase;
      letter-spacing: 0.08em;
      color: var(--cc-color-accent);
      text-align: center;
      flex: 1;
    }
    .flow-svg {
      width: 100%;
      height: 420px;
      display: block;
    }
    .node-rect {
      rx: 8;
      ry: 8;
      stroke-width: 1.5;
    }
    .node-label {
      font-family: inherit;
      font-size: 12px;
      font-weight: 600;
      fill: var(--cc-color-text);
      text-anchor: middle;
      dominant-baseline: central;
      pointer-events: none;
    }
    .node-sublabel {
      font-family: inherit;
      font-size: 9px;
      fill: var(--cc-color-text);
      opacity: 0.6;
      text-anchor: middle;
      dominant-baseline: central;
      pointer-events: none;
    }
    .connection-path {
      fill: none;
      stroke-width: 1.5;
      opacity: 0.35;
      stroke-dasharray: 6 4;
      stroke-dashoffset: 0;
      animation: flowDash 2s linear infinite;
    }
    .connection-path:hover {
      opacity: 0.85;
      stroke-width: 2.5;
      transition: opacity 150ms cubic-bezier(.32, .72, 0, 1), stroke-width 150ms cubic-bezier(.32, .72, 0, 1);
    }
    @keyframes flowDash {
      to {
        stroke-dashoffset: -20;
      }
    }
    .stage-col-bg {
      rx: 12;
      ry: 12;
    }
    .tooltip-group .tooltip-box {
      opacity: 0;
      transition: opacity 150ms cubic-bezier(.32, .72, 0, 1);
      pointer-events: none;
    }
    .tooltip-group:hover .tooltip-box {
      opacity: 1;
    }
    .node-group {
      cursor: default;
    }
    .glow-0 { filter: drop-shadow(0 0 4px var(--cc-color-primary)); }
    .glow-1 { filter: drop-shadow(0 0 4px var(--cc-color-accent-2)); }
    .glow-2 { filter: drop-shadow(0 0 4px var(--cc-color-accent)); }
    .glow-3 { filter: drop-shadow(0 0 4px color-mix(in srgb, var(--cc-color-primary) 55%, var(--cc-color-accent))); }
    .glow-4 { filter: drop-shadow(0 0 4px color-mix(in srgb, var(--cc-color-accent-2) 55%, var(--cc-color-accent))); }
    .glow-danger { filter: drop-shadow(0 0 4px var(--cc-color-danger)); }
    .glow-warning { filter: drop-shadow(0 0 4px var(--cc-color-warning)); }
    .glow-accent { filter: drop-shadow(0 0 4px var(--cc-color-accent)); }
  </style>
  {% if rows.size == 0 %}
  <div style="display:flex;align-items:center;justify-content:center;height:300px;color:var(--cc-color-text);opacity:0.5;font-size:0.875rem;">
    No data available
  </div>
  {% else %}
  <div class="flow-container">
    <div class="stage-labels">
      <span class="stage-label">Source Countries</span>
      <span class="stage-label">Hosts</span>
      <span class="stage-label">Dest Countries</span>
      <span class="stage-label">Response Codes</span>
    </div>
    <svg class="flow-svg" viewBox="0 0 1000 420" preserveAspectRatio="xMidYMid meet">
      <defs>
        <linearGradient id="col-bg-grad" x1="0" y1="0" x2="0" y2="1">
          <stop offset="0%" stop-color="var(--cc-color-surface)" stop-opacity="0.7"/>
          <stop offset="100%" stop-color="var(--cc-color-surface)" stop-opacity="0.3"/>
        </linearGradient>
        <linearGradient id="conn-grad-01" x1="0" y1="0" x2="1" y2="0">
          <stop offset="0%" stop-color="var(--cc-color-primary)"/>
          <stop offset="100%" stop-color="var(--cc-color-accent-2)"/>
        </linearGradient>
        <linearGradient id="conn-grad-12" x1="0" y1="0" x2="1" y2="0">
          <stop offset="0%" stop-color="var(--cc-color-accent-2)"/>
          <stop offset="100%" stop-color="var(--cc-color-accent)"/>
        </linearGradient>
        <linearGradient id="conn-grad-2g" x1="0" y1="0" x2="1" y2="0">
          <stop offset="0%" stop-color="var(--cc-color-accent)"/>
          <stop offset="100%" stop-color="var(--cc-color-accent)"/>
        </linearGradient>
        <linearGradient id="conn-grad-2w" x1="0" y1="0" x2="1" y2="0">
          <stop offset="0%" stop-color="var(--cc-color-accent)"/>
          <stop offset="100%" stop-color="var(--cc-color-warning)"/>
        </linearGradient>
        <linearGradient id="conn-grad-2d" x1="0" y1="0" x2="1" y2="0">
          <stop offset="0%" stop-color="var(--cc-color-accent)"/>
          <stop offset="100%" stop-color="var(--cc-color-danger)"/>
        </linearGradient>
      </defs>
      <!-- Column backgrounds -->
      <rect class="stage-col-bg" x="20" y="10" width="210" height="400" fill="url(#col-bg-grad)" stroke="var(--cc-color-border)" stroke-width="0.5"/>
      <rect class="stage-col-bg" x="270" y="10" width="210" height="400" fill="url(#col-bg-grad)" stroke="var(--cc-color-border)" stroke-width="0.5"/>
      <rect class="stage-col-bg" x="520" y="10" width="210" height="400" fill="url(#col-bg-grad)" stroke="var(--cc-color-border)" stroke-width="0.5"/>
      <rect class="stage-col-bg" x="770" y="10" width="210" height="400" fill="url(#col-bg-grad)" stroke="var(--cc-color-border)" stroke-width="0.5"/>
      <!-- ========== STAGE 1: Source Countries ========== -->
      <g class="node-group glow-0">
        <rect class="node-rect" x="60" y="60" width="130" height="50" fill="var(--cc-color-surface)" stroke="var(--cc-color-primary)"/>
        <text class="node-label" x="125" y="80">CN</text>
        <text class="node-sublabel" x="125" y="97">China</text>
      </g>
      <g class="node-group glow-1">
        <rect class="node-rect" x="60" y="170" width="130" height="50" fill="var(--cc-color-surface)" stroke="var(--cc-color-accent-2)"/>
        <text class="node-label" x="125" y="190">IN</text>
        <text class="node-sublabel" x="125" y="207">India</text>
      </g>
      <g class="node-group glow-2">
        <rect class="node-rect" x="60" y="280" width="130" height="50" fill="var(--cc-color-surface)" stroke="var(--cc-color-accent)"/>
        <text class="node-label" x="125" y="300">US</text>
        <text class="node-sublabel" x="125" y="317">United States</text>
      </g>
      <!-- ========== STAGE 2: Hosts ========== -->
      <g class="node-group glow-3">
        <rect class="node-rect" x="300" y="100" width="150" height="50" fill="var(--cc-color-surface)" stroke="color-mix(in srgb, var(--cc-color-primary) 55%, var(--cc-color-accent))"/>
        <text class="node-label" x="375" y="120" font-size="10">media-for-the-</text>
        <text class="node-label" x="375" y="137" font-size="10">masses</text>
      </g>
      <g class="node-group glow-4">
        <rect class="node-rect" x="300" y="230" width="150" height="50" fill="var(--cc-color-surface)" stroke="color-mix(in srgb, var(--cc-color-accent-2) 55%, var(--cc-color-accent))"/>
        <text class="node-label" x="375" y="250">cdn</text>
        <text class="node-sublabel" x="375" y="267">glb.nist.gov</text>
      </g>
      <!-- ========== STAGE 3: Dest Countries ========== -->
      <g class="node-group glow-0">
        <rect class="node-rect" x="555" y="60" width="130" height="50" fill="var(--cc-color-surface)" stroke="var(--cc-color-primary)"/>
        <text class="node-label" x="620" y="80">CN</text>
        <text class="node-sublabel" x="620" y="97">China</text>
      </g>
      <g class="node-group glow-1">
        <rect class="node-rect" x="555" y="170" width="130" height="50" fill="var(--cc-color-surface)" stroke="var(--cc-color-accent-2)"/>
        <text class="node-label" x="620" y="190">IN</text>
        <text class="node-sublabel" x="620" y="207">India</text>
      </g>
      <g class="node-group glow-2">
        <rect class="node-rect" x="555" y="280" width="130" height="50" fill="var(--cc-color-surface)" stroke="var(--cc-color-accent)"/>
        <text class="node-label" x="620" y="300">US</text>
        <text class="node-sublabel" x="620" y="317">United States</text>
      </g>
      <!-- ========== STAGE 4: Response Codes ========== -->
      <g class="node-group glow-accent">
        <rect class="node-rect" x="810" y="60" width="130" height="50" fill="var(--cc-color-surface)" stroke="var(--cc-color-accent)"/>
        <text class="node-label" x="875" y="80" fill="var(--cc-color-accent)">200</text>
        <text class="node-sublabel" x="875" y="97">OK</text>
      </g>
      <g class="node-group glow-warning">
        <rect class="node-rect" x="810" y="170" width="130" height="50" fill="var(--cc-color-surface)" stroke="var(--cc-color-warning)"/>
        <text class="node-label" x="875" y="190" fill="var(--cc-color-warning)">404</text>
        <text class="node-sublabel" x="875" y="207">Not Found</text>
      </g>
      <g class="node-group glow-danger">
        <rect class="node-rect" x="810" y="280" width="130" height="50" fill="var(--cc-color-surface)" stroke="var(--cc-color-danger)"/>
        <text class="node-label" x="875" y="300" fill="var(--cc-color-danger)">503</text>
        <text class="node-sublabel" x="875" y="317">Service Unavailable</text>
      </g>
      <!-- ========== CONNECTIONS (data-driven) ========== -->
      {% for row in rows %}
        {% if row["geo.src"].value == "CN" %}
          {% assign srcY = 85 %}
        {% elsif row["geo.src"].value == "IN" %}
          {% assign srcY = 195 %}
        {% else %}
          {% assign srcY = 305 %}
        {% endif %}
        {% assign hostStr = row["host.keyword"].value | slice: 0, 5 %}
        {% if hostStr == "media" %}
          {% assign hostY = 125 %}
        {% else %}
          {% assign hostY = 255 %}
        {% endif %}
        {% if row["geo.dest"].value == "CN" %}
          {% assign destY = 85 %}
        {% elsif row["geo.dest"].value == "IN" %}
          {% assign destY = 195 %}
        {% else %}
          {% assign destY = 305 %}
        {% endif %}
        {% assign respVal = row["response"].value | plus: 0 %}
        {% if respVal == 200 %}
          {% assign respY = 85 %}
          {% assign respGrad = "url(#conn-grad-2g)" %}
        {% elsif respVal == 404 %}
          {% assign respY = 195 %}
          {% assign respGrad = "url(#conn-grad-2w)" %}
        {% else %}
          {% assign respY = 305 %}
          {% assign respGrad = "url(#conn-grad-2d)" %}
        {% endif %}
        <g class="tooltip-group">
          <path class="connection-path" d="M 190 {{ srcY }} C 230 {{ srcY }}, 260 {{ hostY }}, 300 {{ hostY }}" stroke="url(#conn-grad-01)">
            <title>{{ row["geo.src"].value }} → {{ row["host.keyword"].value }}: {{ row["count"].value }} requests</title>
          </path>
        </g>
        <g class="tooltip-group">
          <path class="connection-path" d="M 450 {{ hostY }} C 490 {{ hostY }}, 520 {{ destY }}, 555 {{ destY }}" stroke="url(#conn-grad-12)">
            <title>{{ row["host.keyword"].value }} → {{ row["geo.dest"].value }}: {{ row["count"].value }} requests</title>
          </path>
        </g>
        <g class="tooltip-group">
          <path class="connection-path" d="M 685 {{ destY }} C 730 {{ destY }}, 770 {{ respY }}, 810 {{ respY }}" stroke="{{ respGrad }}">
            <title>{{ row["geo.dest"].value }} → {{ row["response"].value }}: {{ row["count"].value }} requests</title>
          </path>
        </g>
      {% endfor %}
      <circle cx="240" cy="120" r="2" fill="var(--cc-color-primary)" opacity="0.4"/>
      <circle cx="500" cy="180" r="2" fill="var(--cc-color-accent-2)" opacity="0.4"/>
      <circle cx="750" cy="100" r="2" fill="var(--cc-color-accent)" opacity="0.4"/>
    </svg>
    <!-- Legend -->
    <div style="display:flex; gap:16px; justify-content:center; margin-top:12px; flex-wrap:wrap;">
      <div style="display:flex; align-items:center; gap:4px; font-size:0.75rem;">
        <svg width="12" height="12"><circle cx="6" cy="6" r="5" fill="var(--cc-color-accent)" opacity="0.8"/></svg>
        <span>200 OK</span>
      </div>
      <div style="display:flex; align-items:center; gap:4px; font-size:0.75rem;">
        <svg width="12" height="12"><circle cx="6" cy="6" r="5" fill="var(--cc-color-warning)" opacity="0.8"/></svg>
        <span>404 Not Found</span>
      </div>
      <div style="display:flex; align-items:center; gap:4px; font-size:0.75rem;">
        <svg width="12" height="12"><circle cx="6" cy="6" r="5" fill="var(--cc-color-danger)" opacity="0.8"/></svg>
        <span>503 Unavailable</span>
      </div>
      <div style="display:flex; align-items:center; gap:4px; font-size:0.75rem; opacity:0.6;">
        <span>Hover lines for request counts</span>
      </div>
    </div>
  </div>
  {% endif %}
  ```
</dropdown>


## Banner with a logo

A dashboard header with a logo, a title, and an animated mascot. The logo is an inline SVG path, so it travels with the dashboard when you export it. CSS animations run inside the panel. Sample data: none, the panel has no query.

![Dark banner with the Elastic logo, the title Sample logs ops center, and an animated elk mascot](https://docs-v3-preview.elastic.dev/elastic/docs-content/pull/8169/explore-analyze/images/custom-panels-example-banner.png)

<dropdown title="Template">
  This template uses fixed colors instead of the theme properties, so the banner looks the same in the light and dark themes.
  ```html
  <!DOCTYPE html>
  <html lang="en">
  <head>
  <meta charset="UTF-8">
  <style>
    * { box-sizing: border-box; }
    body {
      margin: 0;
      padding: 0;
      font-family: Inter, system-ui, sans-serif;
      color: #ffffff;
      background: #16171C;
    }
    .banner {
      display: flex;
      align-items: center;
      padding: 16px 28px;
      background: linear-gradient(90deg, #16171C 0%, #1D1E24 100%);
      border-bottom: 1px solid #00BFB3;
      width: 100%;
    }
    .col-left {
      flex: 0 0 200px;
      display: flex;
      align-items: center;
    }
    .col-center {
      flex: 1 1 auto;
      text-align: center;
    }
    .col-right {
      flex: 0 0 200px;
      display: flex;
      flex-direction: column;
      align-items: flex-end;
      justify-content: center;
    }
    .title {
      font-size: 26px;
      font-weight: 700;
      letter-spacing: 2px;
      color: #ffffff;
      margin: 0;
    }
    .subtitle {
      font-size: 13px;
      color: #98A2B3;
      margin-top: 6px;
    }
    .elky-box {
      width: 130px;
      height: 130px;
      background: transparent;
      overflow: hidden;
      display: flex;
      align-items: center;
      justify-content: center;
    }
    .elk-head {
      transform-origin: 100px 130px;
      animation: headBob 4s ease-in-out infinite;
    }
    @keyframes headBob {
      0%, 100% { transform: translateY(0) rotate(0deg); }
      50% { transform: translateY(-4px) rotate(-2deg); }
    }
    .eye {
      transform-origin: center;
      animation: blink 5s infinite;
    }
    .eye-l { transform-origin: 82px 92px; }
    .eye-r { transform-origin: 118px 92px; }
    @keyframes blink {
      0%, 93%, 100% { transform: scaleY(1); }
      95% { transform: scaleY(0.1); }
    }
    .puff {
      animation: puff 4s ease-out infinite;
      opacity: 0;
    }
    .puff2 { animation-delay: 1.3s; }
    .puff3 { animation-delay: 2.6s; }
    @keyframes puff {
      0% { transform: translate(0,0) scale(1); opacity: 0.7; }
      100% { transform: translate(22px,-14px) scale(1.4); opacity: 0; }
    }
    .spark {
      transform-origin: center;
      animation: twinkle 3s ease-in-out infinite;
    }
    .spark2 { animation-delay: 0.7s; }
    .spark3 { animation-delay: 1.4s; }
    .spark4 { animation-delay: 2.1s; }
    @keyframes twinkle {
      0%, 100% { opacity: 0.15; transform: scale(0.6); }
      50% { opacity: 1; transform: scale(1.2); }
    }
  </style>
  </head>
  <body>
  <div class="banner">
    <div class="col-left">
      <svg width="150" height="75" viewBox="0 0 600 300" fill="none" xmlns="http://www.w3.org/2000/svg"><path d="M291.464
        176.483L294.431 176.181L294.629 182.202C288.034 183.196 281.379 183.742 274.71 183.836C267.354 183.836 262.145
        181.706 259.083 177.446C256.021 173.186 254.488 166.563 254.482 157.579C254.482 139.672 261.6 130.716 275.837
        130.711C282.717 130.711 287.858 132.634 291.258 136.482C294.658 140.329 296.361 146.375 296.366 154.62L295.962
        160.443H262.248C262.248 166.096 263.269 170.284 265.31 173.008C267.351 175.731 270.912 177.093 275.992
        177.093C281.06 177.099 286.218 176.895 291.464 176.483ZM288.703 154.319C288.703 148.058 287.7 143.631 285.693
        141.04C283.686 138.448 280.433 137.155 275.932 137.161C271.402 137.161 267.996 138.523 265.714 141.246C263.432
        143.97 262.251 148.327 262.171 154.319H288.703Z" fill="white"/><path d="M307.048
        183.888V116.09H314.711V183.888H307.048Z" fill="white"/><path d="M362.96 147.172V172.974C362.96 175.554 369.324
        175.425 369.324 175.425L368.929 182.193C363.545 182.193 359.09 182.641 356.415 180.052C350.631 182.624 344.365
        183.931 338.036 183.888C333.34 183.888 329.765 182.557 327.311 179.897C324.857 177.237 323.63 173.424 323.63
        168.458C323.63 163.487 324.891 159.826 327.414 157.475C329.937 155.125 333.887 153.691 339.266 153.175L355.297
        151.636V147.249C355.297 143.775 354.549 141.289 353.052 139.793C352.237 139.02 351.273 138.422 350.218
        138.035C349.164 137.647 348.042 137.479 346.92 137.539H326.795V130.719H346.456C352.247 130.719 356.452 132.049
        359.073 134.71C361.693 137.37 362.989 141.524 362.96 147.172ZM331.499 168.011C331.499 174.272 334.08 177.403
        339.24 177.403C343.901 177.398 348.527 176.604 352.923 175.055L355.271 174.195V157.381L340.177 158.817C337.116
        159.087 334.902 159.97 333.538 161.466C332.179 162.971 331.499 165.147 331.499 168.011Z" fill="white"/><path
        d="M392.898 137.565C385.479 137.565 381.766 140.145 381.761 145.306C381.761 147.685 382.621 149.371 384.341
        150.363C386.061 151.355 389.923 152.387 395.926 153.459C401.992 154.52 406.292 156.002 408.827 157.905C411.361
        159.809 412.619 163.384 412.602 168.63C412.602 173.877 410.919 177.724 407.554 180.172C404.188 182.62 399.266
        183.847 392.787 183.853C388.564 183.853 374.476 182.288 374.476 182.288L374.88 175.648C382.982 176.431 388.839
        177.007 392.787 177.007C396.734 177.007 399.753 176.379 401.826 175.115C403.898 173.851 404.948 171.744 404.948
        168.785C404.948 165.827 404.088 163.814 402.29 162.765C400.493 161.716 396.631 160.709 390.645 159.755C384.659
        158.8 380.393 157.398 377.873 155.566C375.353 153.734 374.098 150.32 374.098 145.349C374.098 140.378 375.818
        136.697 379.353 134.314C382.887 131.932 387.239 130.736 392.486 130.736C396.631 130.736 411.045 131.794 411.045
        131.794V138.477C403.443 138.116 397.199 137.565 392.898 137.565Z" fill="white"/><path d="M449.533
        138.382H433.321V162.799C433.321 168.659 433.748 172.506 434.602 174.341C435.462 176.182 437.475 177.102 440.683
        177.102L449.774 176.483L450.281 182.821C446.842 183.456 443.361 183.833 439.866 183.948C434.551 183.948 430.873
        182.652 428.831 180.06C426.79 177.469 425.767 172.532 425.761
        165.25V138.382H418.511V131.743H425.761V116.116H433.321V131.743H449.567L449.533 138.382Z" fill="white"/><path
        d="M460.18 124.974V116.09H467.843V124.974H460.18ZM460.18 183.827V132.13H467.843V183.827H460.18Z"
        fill="white"/><path d="M501.033 130.719C504.86 130.885 508.672 131.299 512.445 131.958L514.897 132.259L514.587
        138.494C510.591 137.986 506.573 137.679 502.546 137.574C496.755 137.574 492.822 138.953 490.746 141.711C488.671
        144.469 487.633 149.577 487.633 157.037C487.633 164.491 488.602 169.682 490.54 172.612C492.478 175.542 496.514
        177.007 502.649 177.007L514.69 176.087L515 182.417C510.305 183.217 505.561 183.697 500.8 183.853C492.836 183.853
        487.338 181.809 484.305 177.721C481.271 173.633 479.755 166.753 479.755 157.08C479.755 147.367 481.389 140.555
        484.657 136.645C487.925 132.735 493.384 130.759 501.033 130.719Z" fill="white"/><path d="M233.264 153.459C233.28
        147.447 231.438 141.577 227.991 136.651C224.545 131.725 219.661 127.983 214.008 125.937C214.522 123.314 214.781
        120.647 214.782 117.973C214.802 109.104 212.007 100.458 206.797 93.2796C201.588 86.1017 194.234 80.763 185.796
        78.0331C177.357 75.3031 168.27 75.3229 159.843 78.0896C151.417 80.8562 144.086 86.2268 138.908 93.4274C135.087
        90.4666 130.405 88.8317 125.572 88.7706C120.738 88.7094 116.017 90.2252 112.122 93.0884C108.227 95.9515 105.372
        100.006 103.988 104.638C102.605 109.269 102.768 114.226 104.454 118.756C98.7789 120.823 93.8723 124.578 90.3944
        129.517C86.9165 134.456 85.034 140.341 85.0001 146.381C84.986 152.42 86.8419 158.315 90.313 163.257C93.7841
        168.198 98.7 171.944 104.386 173.98C103.883 176.605 103.627 179.271 103.62 181.944C103.624 190.781 106.431 199.39
        111.637 206.531C116.844 213.673 124.181 218.978 132.594 221.685C141.007 224.391 150.062 224.359 158.455
        221.593C166.849 218.827 174.149 213.47 179.305 206.292C183.114 209.268 187.79 210.919 192.624 210.995C197.457
        211.071 202.183 209.567 206.083 206.712C209.984 203.856 212.846 199.806 214.234 195.176C215.623 190.545 215.462
        185.588 213.776 181.058C219.453 178.998 224.365 175.249 227.849 170.315C231.333 165.381 233.223 159.499 233.264
        153.459ZM142.4 97.891C147.17 90.9399 154.193 85.8487 162.283 83.478C170.373 81.1073 179.034 81.6025 186.801
        84.8798C194.568 88.1572 200.966 94.0157 204.912 101.465C208.859 108.915 210.112 117.498 208.46 125.765L175.736
        154.448L143.286 139.698L136.956 126.135L142.4 97.891ZM125.964 94.253C129.808 94.2497 133.546 95.5098 136.603
        97.8394L131.735 123.116L109.503 117.87C108.539 115.218 108.227 112.372 108.593 109.574C108.96 106.776 109.993
        104.106 111.607 101.791C113.221 99.4758 115.367 97.5825 117.866 96.2706C120.365 94.9587 123.142 94.2667 125.964
        94.253ZM90.7022 146.45C90.7405 141.295 92.387 136.281 95.4121 132.107C98.4371 127.934 102.69 124.808 107.576
        123.168L131.976 128.93L137.704 141.169L106.501 169.361C101.862 167.589 97.8701 164.449 95.0549 160.358C92.2397
        156.266 90.7338 151.416 90.7366 146.45H90.7022ZM175.976 201.94C171.565 208.428 165.19 213.331 157.787
        215.928C150.384 218.526 142.343 218.681 134.845 216.372C127.347 214.062 120.787 209.41 116.128 203.097C111.469
        196.784 108.957 189.144 108.961 181.299C108.958 178.847 109.197 176.402 109.675 173.997L141.626 145.168L174.196
        160.013L181.412 173.773L175.976 201.94ZM192.266 205.561C188.434 205.551 184.713 204.279 181.678 201.94L186.512
        176.749L208.727 181.909C209.691 184.562 210.003 187.407 209.637 190.206C209.27 193.004 208.237 195.673 206.623
        197.988C205.009 200.304 202.863 202.197 200.364 203.509C197.865 204.821 195.088 205.513 192.266
        205.526V205.561ZM210.688 176.68L186.228 170.961L179.735 158.55L211.72 130.496C216.364 132.252 220.363 135.379
        223.186 139.462C226.01 143.546 227.524 148.391 227.528 153.356C227.502 158.514 225.865 163.535 222.846
        167.717C219.827 171.899 215.576 175.033 210.688 176.68Z" fill="white"/></svg>
    </div>

    <div class="col-center">
      <h1 class="title">SAMPLE LOGS OPS CENTER</h1>
      <div class="subtitle">Kibana Sample Web Logs · Live Overview</div>
    </div>

    <div class="col-right">
      <div class="elky-box">
        <svg width="130" height="130" viewBox="0 0 200 200" xmlns="http://www.w3.org/2000/svg">
          <!-- twinkling sparks -->
          <circle class="spark" cx="30" cy="40" r="3" fill="#1BA9F5"/>
          <circle class="spark spark2" cx="170" cy="50" r="3" fill="#00BFB3"/>
          <circle class="spark spark3" cx="40" cy="150" r="3" fill="#F04E98"/>
          <circle class="spark spark4" cx="165" cy="140" r="3" fill="#F5A700"/>

          <!-- breath puffs -->
          <circle class="puff" cx="118" cy="150" r="5" fill="#1BA9F5" opacity="0.7"/>
          <circle class="puff puff2" cx="120" cy="155" r="4" fill="#00BFB3" opacity="0.7"/>
          <circle class="puff puff3" cx="122" cy="148" r="4.5" fill="#F04E98" opacity="0.7"/>

          <g class="elk-head">
            <!-- antlers -->
            <path d="M78 60 C70 40 60 30 45 28 M60 42 C50 40 42 44 38 52 M65 50 C58 48 52 50 48 58"
                  stroke="#1BA9F5" stroke-width="6" fill="none" stroke-linecap="round" stroke-linejoin="round"/>
            <path d="M122 60 C130 40 140 30 155 28 M140 42 C150 40 158 44 162 52 M135 50 C142 48 148 50 152 58"
                  stroke="#1BA9F5" stroke-width="6" fill="none" stroke-linecap="round" stroke-linejoin="round"/>

            <!-- ears -->
            <ellipse cx="66" cy="78" rx="9" ry="16" fill="#00BFB3" transform="rotate(-25 66 78)"/>
            <ellipse cx="134" cy="78" rx="9" ry="16" fill="#00BFB3" transform="rotate(25 134 78)"/>

            <!-- face -->
            <path d="M100 70 C122 70 134 88 134 112 C134 140 118 158 100 158 C82 158 66 140 66 112 C66 88 78 70 100 70 Z"
              fill="#2d3436"/>

            <!-- muzzle -->
            <ellipse cx="100" cy="138" rx="20" ry="16" fill="#4b5457"/>

            <!-- nostrils -->
            <ellipse cx="93" cy="138" rx="2.5" ry="3.5" fill="#E6E9F0"/>
            <ellipse cx="107" cy="138" rx="2.5" ry="3.5" fill="#E6E9F0"/>

            <!-- eyes -->
            <g class="eye eye-l">
              <ellipse cx="82" cy="92" rx="8" ry="10" fill="#E6E9F0"/>
              <circle cx="82" cy="93" r="4" fill="#1BA9F5"/>
            </g>
            <g class="eye eye-r">
              <ellipse cx="118" cy="92" rx="8" ry="10" fill="#E6E9F0"/>
              <circle cx="118" cy="93" r="4" fill="#1BA9F5"/>
            </g>
          </g>
        </svg>
      </div>
    </div>
  </div>
  </body>
  </html>
  ```
</dropdown>


## Multi-metric card with tabs

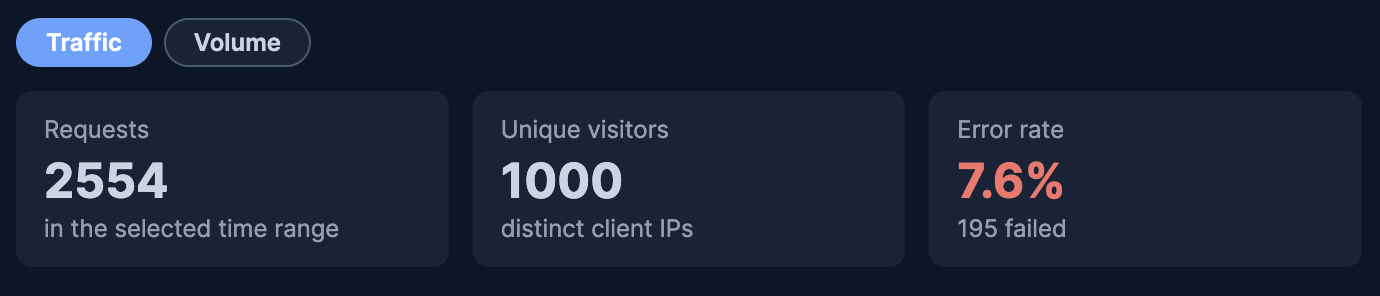
Six metrics from one query, split into two views that the reader switches with tabs. The tabs are hidden radio inputs and `:checked` rules, so they work without JavaScript. The error rate turns red above 5%. Sample data: **Sample web logs**.
![Card with Traffic and Volume tabs, showing three tiles for requests, unique visitors, and a red error rate](https://docs-v3-preview.elastic.dev/elastic/docs-content/pull/8169/explore-analyze/images/custom-panels-example-metric-card.png)

<dropdown title="Query">
  ```esql
  FROM kibana_sample_data_logs
  | WHERE @timestamp >= ?_tstart AND @timestamp < ?_tend
  | STATS requests = COUNT(*),
          errors = COUNT(*) WHERE response != "200",
          visitors = COUNT_DISTINCT(clientip),
          bytes = SUM(bytes),
          avg_bytes = AVG(bytes),
          max_bytes = MAX(bytes)
  | EVAL error_rate = ROUND(errors * 100.0 / requests, 1),
         mb = ROUND(bytes / 1048576.0, 2),
         avg_kb = ROUND(avg_bytes / 1024.0, 1),
         max_kb = ROUND(max_bytes / 1024.0, 1)
  ```
</dropdown>

<dropdown title="Template">
  ```html
  <style>
    body { margin: 0; padding: 12px; font-family: Inter, system-ui, sans-serif; color: var(--cc-color-text); background: var(--cc-color-background); }
    input[type=radio] { display: none; }
    .tabs { display: flex; gap: 6px; margin-bottom: 12px; }
    .tabs label { padding: 4px 14px; border-radius: 999px; font-size: 12px; font-weight: 600; background: var(--cc-color-surface); border: 1px solid var(--cc-color-border); cursor: pointer; }
    .pane { display: none; grid-template-columns: repeat(3, 1fr); gap: 12px; }
    #traffic:checked ~ .pane.traffic, #volume:checked ~ .pane.volume { display: grid; }
    #traffic:checked ~ .tabs label[for=traffic], #volume:checked ~ .tabs label[for=volume] { background: var(--cc-color-primary); color: #fff; border-color: var(--cc-color-primary); }
    .tile { background: var(--cc-color-surface); border-radius: 8px; padding: 12px 14px; }
    .label { font-size: 12px; opacity: 0.7; }
    .value { font-size: 24px; font-weight: 700; margin-top: 4px; line-height: 1.2; }
    .sub { font-size: 12px; opacity: 0.7; margin-top: 2px; }
    .bad { color: var(--cc-color-danger); }
  </style>
  {% if rows.size == 0 %}<p>No requests in the selected time range.</p>{% endif %}
  {% for row in rows %}
  <input type="radio" name="view" id="traffic" checked>
  <input type="radio" name="view" id="volume">
  <div class="tabs">
    <label for="traffic">Traffic</label>
    <label for="volume">Volume</label>
  </div>
  <div class="pane traffic">
    <div class="tile"><div class="label">Requests</div><div class="value">{{ row["requests"].value }}</div><div class="sub">in the selected time range</div></div>
    <div class="tile"><div class="label">Unique visitors</div><div class="value">{{ row["visitors"].value }}</div><div class="sub">distinct client IPs</div></div>
    <div class="tile"><div class="label">Error rate</div><div class="value {% if row["error_rate"].value > 5 %}bad{% endif %}">{{ row["error_rate"].value }}%</div><div class="sub">{{ row["errors"].value }} failed</div></div>
  </div>
  <div class="pane volume">
    <div class="tile"><div class="label">Data transferred</div><div class="value">{{ row["mb"].value }} MB</div><div class="sub">response bytes sent</div></div>
    <div class="tile"><div class="label">Average response</div><div class="value">{{ row["avg_kb"].value }} KB</div><div class="sub">per request</div></div>
    <div class="tile"><div class="label">Largest response</div><div class="value">{{ row["max_kb"].value }} KB</div><div class="sub">single response</div></div>
  </div>
  {% endfor %}
  ```
</dropdown>


## Narrative summary

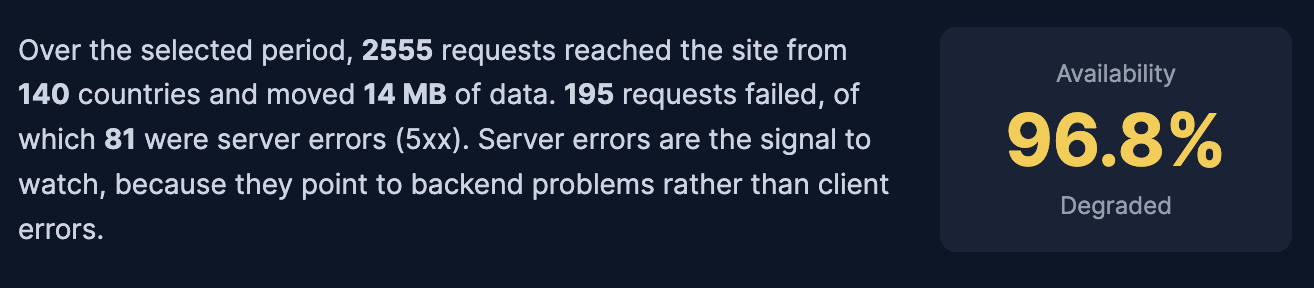
A paragraph that reads like a report, with live values in bold, next to an availability score that changes color and label with its value. Sample data: **Sample web logs**.
![Paragraph summarizing requests, countries, data volume, and failures next to an availability score of 96.8% labeled Degraded](https://docs-v3-preview.elastic.dev/elastic/docs-content/pull/8169/explore-analyze/images/custom-panels-example-summary.png)

<dropdown title="Query">
  ```esql
  FROM kibana_sample_data_logs
  | WHERE @timestamp >= ?_tstart AND @timestamp < ?_tend
  | STATS requests = COUNT(*),
          errors = COUNT(*) WHERE response != "200",
          server_errors = COUNT(*) WHERE TO_INTEGER(response) >= 500,
          countries = COUNT_DISTINCT(geo.dest),
          bytes = SUM(bytes)
  | EVAL availability = ROUND((requests - server_errors) * 100.0 / requests, 1),
         mb = ROUND(bytes / 1048576.0, 1)
  ```
</dropdown>

<dropdown title="Template">
  ```html
  <style>
    body { margin: 0; padding: 16px; font-family: Inter, system-ui, sans-serif; color: var(--cc-color-text); background: var(--cc-color-background); }
    .wrap { display: flex; gap: 24px; align-items: center; }
    .text { flex: 1; font-size: 14px; line-height: 1.6; }
    .text b { font-weight: 700; }
    .score { flex: 0 0 160px; text-align: center; background: var(--cc-color-surface); border-radius: 8px; padding: 16px 8px; }
    .score .label { font-size: 12px; opacity: 0.7; }
    .score .value { font-size: 36px; font-weight: 700; margin: 4px 0; }
    .ok { color: var(--cc-color-accent); }
    .warn { color: var(--cc-color-warning); }
    .bad { color: var(--cc-color-danger); }
  </style>
  {% if rows.size == 0 %}<p>No requests in the selected time range.</p>{% endif %}
  {% for row in rows %}
  {% assign availability = row["availability"].value %}
  <div class="wrap">
    <div class="text">
      Over the selected period, <b>{{ row["requests"].value }}</b> requests reached the site from
      <b>{{ row["countries"].value }}</b> countries and moved <b>{{ row["mb"].value }} MB</b> of data.
      <b>{{ row["errors"].value }}</b> requests failed, of which <b>{{ row["server_errors"].value }}</b> were
      server errors (5xx). Server errors are the signal to watch, because they point to backend problems
      rather than client errors.
    </div>
    <div class="score">
      <div class="label">Availability</div>
      <div class="value {% if availability >= 99 %}ok{% elsif availability >= 95 %}warn{% else %}bad{% endif %}">{{ availability }}%</div>
      <div class="label">
        {% if availability >= 99 %}Healthy{% elsif availability >= 95 %}Degraded{% else %}Critical{% endif %}
      </div>
    </div>
  </div>
  {% endfor %}
  ```
</dropdown>


## Status board

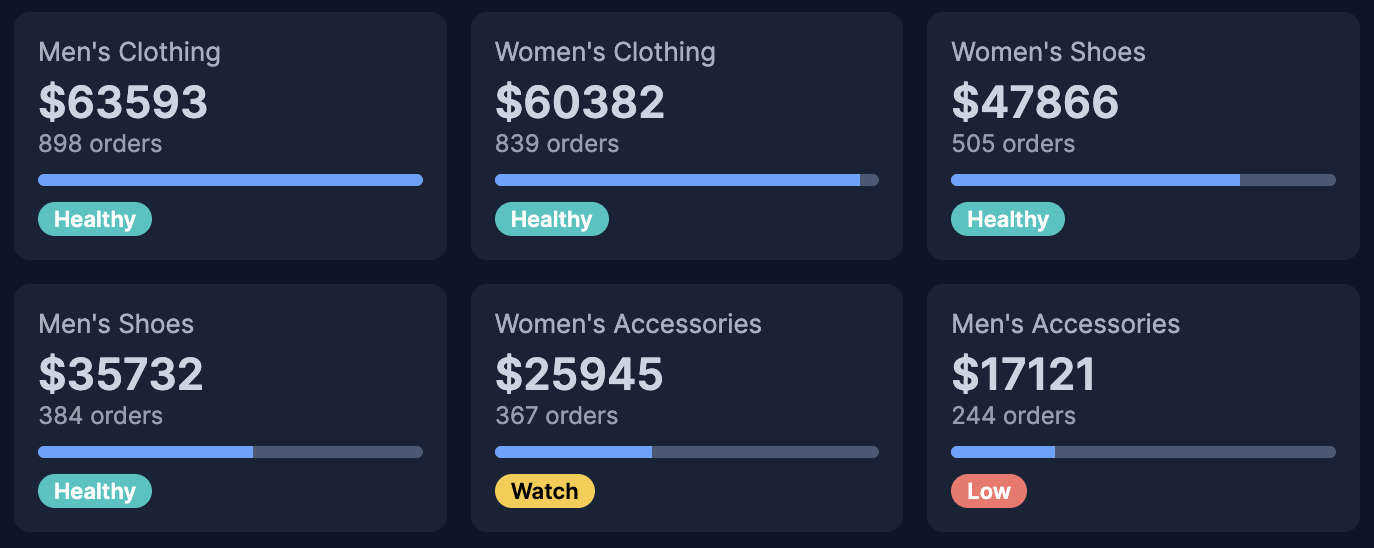
One card per product category, with revenue, order count, a bar relative to the best category, and a badge that changes with the revenue. Sample data: **Sample eCommerce orders**.
![Six category cards with revenue, order count, a progress bar, and Healthy, Watch, or Low badges](https://docs-v3-preview.elastic.dev/elastic/docs-content/pull/8169/explore-analyze/images/custom-panels-example-status-board.png)

<dropdown title="Query">
  Sample data timestamps are relative to the installation time, so the revenue per category, and therefore the badges, depend on when you installed the data set and on the selected time range.
  ```esql
  FROM kibana_sample_data_ecommerce
  | WHERE order_date >= ?_tstart AND order_date < ?_tend
  | STATS revenue = SUM(taxful_total_price), orders = COUNT(*) BY category
  | SORT revenue DESC
  ```
</dropdown>

<dropdown title="Template">
  ```html
  <style>
    body { margin: 0; padding: 12px; font-family: Inter, system-ui, sans-serif; color: var(--cc-color-text); background: var(--cc-color-background); }
    .grid { display: grid; grid-template-columns: repeat(auto-fill, minmax(180px, 1fr)); gap: 12px; }
    .card { background: var(--cc-color-surface); border-radius: 8px; padding: 12px; }
    .name { font-size: 13px; opacity: 0.8; margin-bottom: 4px; }
    .value { font-size: 22px; font-weight: 600; }
    .orders { font-size: 12px; opacity: 0.7; }
    .badge { display: inline-block; margin-top: 8px; padding: 2px 8px; border-radius: 999px; font-size: 11px; font-weight: 600; color: #fff; }
    .ok { background: var(--cc-color-accent); }
    .warn { background: var(--cc-color-warning); color: #000; }
    .bad { background: var(--cc-color-danger); }
    .track { height: 6px; background: var(--cc-color-border); border-radius: 3px; margin-top: 8px; overflow: hidden; }
    .fill { height: 100%; background: var(--cc-color-primary); }
    .empty { opacity: 0.6; padding: 12px; }
  </style>
  {% if rows.size == 0 %}
    <div class="empty">No orders in the selected time range.</div>
  {% endif %}
  <div class="grid">
  {% for row in rows %}
    {% assign revenue = row["revenue"].value %}
    <div class="card">
      <div class="name">{{ row["category"].value }}</div>
      <div class="value">${{ revenue | round: 0 }}</div>
      <div class="orders">{{ row["orders"].value }} orders</div>
      <div class="track"><div class="fill" style="width: {{ row["revenue"].pct }}%"></div></div>
      {% if revenue >= 30000 %}
        <span class="badge ok">Healthy</span>
      {% elsif revenue >= 20000 %}
        <span class="badge warn">Watch</span>
      {% else %}
        <span class="badge bad">Low</span>
      {% endif %}
    </div>
  {% endfor %}
  </div>
  ```
</dropdown>


## Related pages

- [Custom panels for Kibana dashboards](https://docs-v3-preview.elastic.dev/elastic/docs-content/pull/8169/explore-analyze/visualize/custom-panels)
- [Dashboards and visualizations in Elastic Agent Builder chat](https://docs-v3-preview.elastic.dev/elastic/docs-content/pull/8169/explore-analyze/ai-features/agent-builder/agent-builder-dashboards-and-visualizations)
- [Use ES|QL in the Kibana UI](https://docs-v3-preview.elastic.dev/elastic/docs-content/pull/8169/explore-analyze/query-filter/languages/esql-kibana)
- [LiquidJS documentation](https://liquidjs.com/tutorials/intro-to-liquid.html)