---
title: Custom panels for Kibana dashboards
description: Add custom HTML panels to Kibana dashboards with Liquid templates and ES|QL queries. Generate the panel with Agent Builder chat or write the template yourself.
url: https://docs-v3-preview.elastic.dev/elastic/docs-content/pull/8169/explore-analyze/visualize/custom-panels
products:
- Kibana
applies_to:
- Elastic Cloud Serverless: Preview
- Elastic Stack: Planned
---
# Custom panels for Kibana dashboards
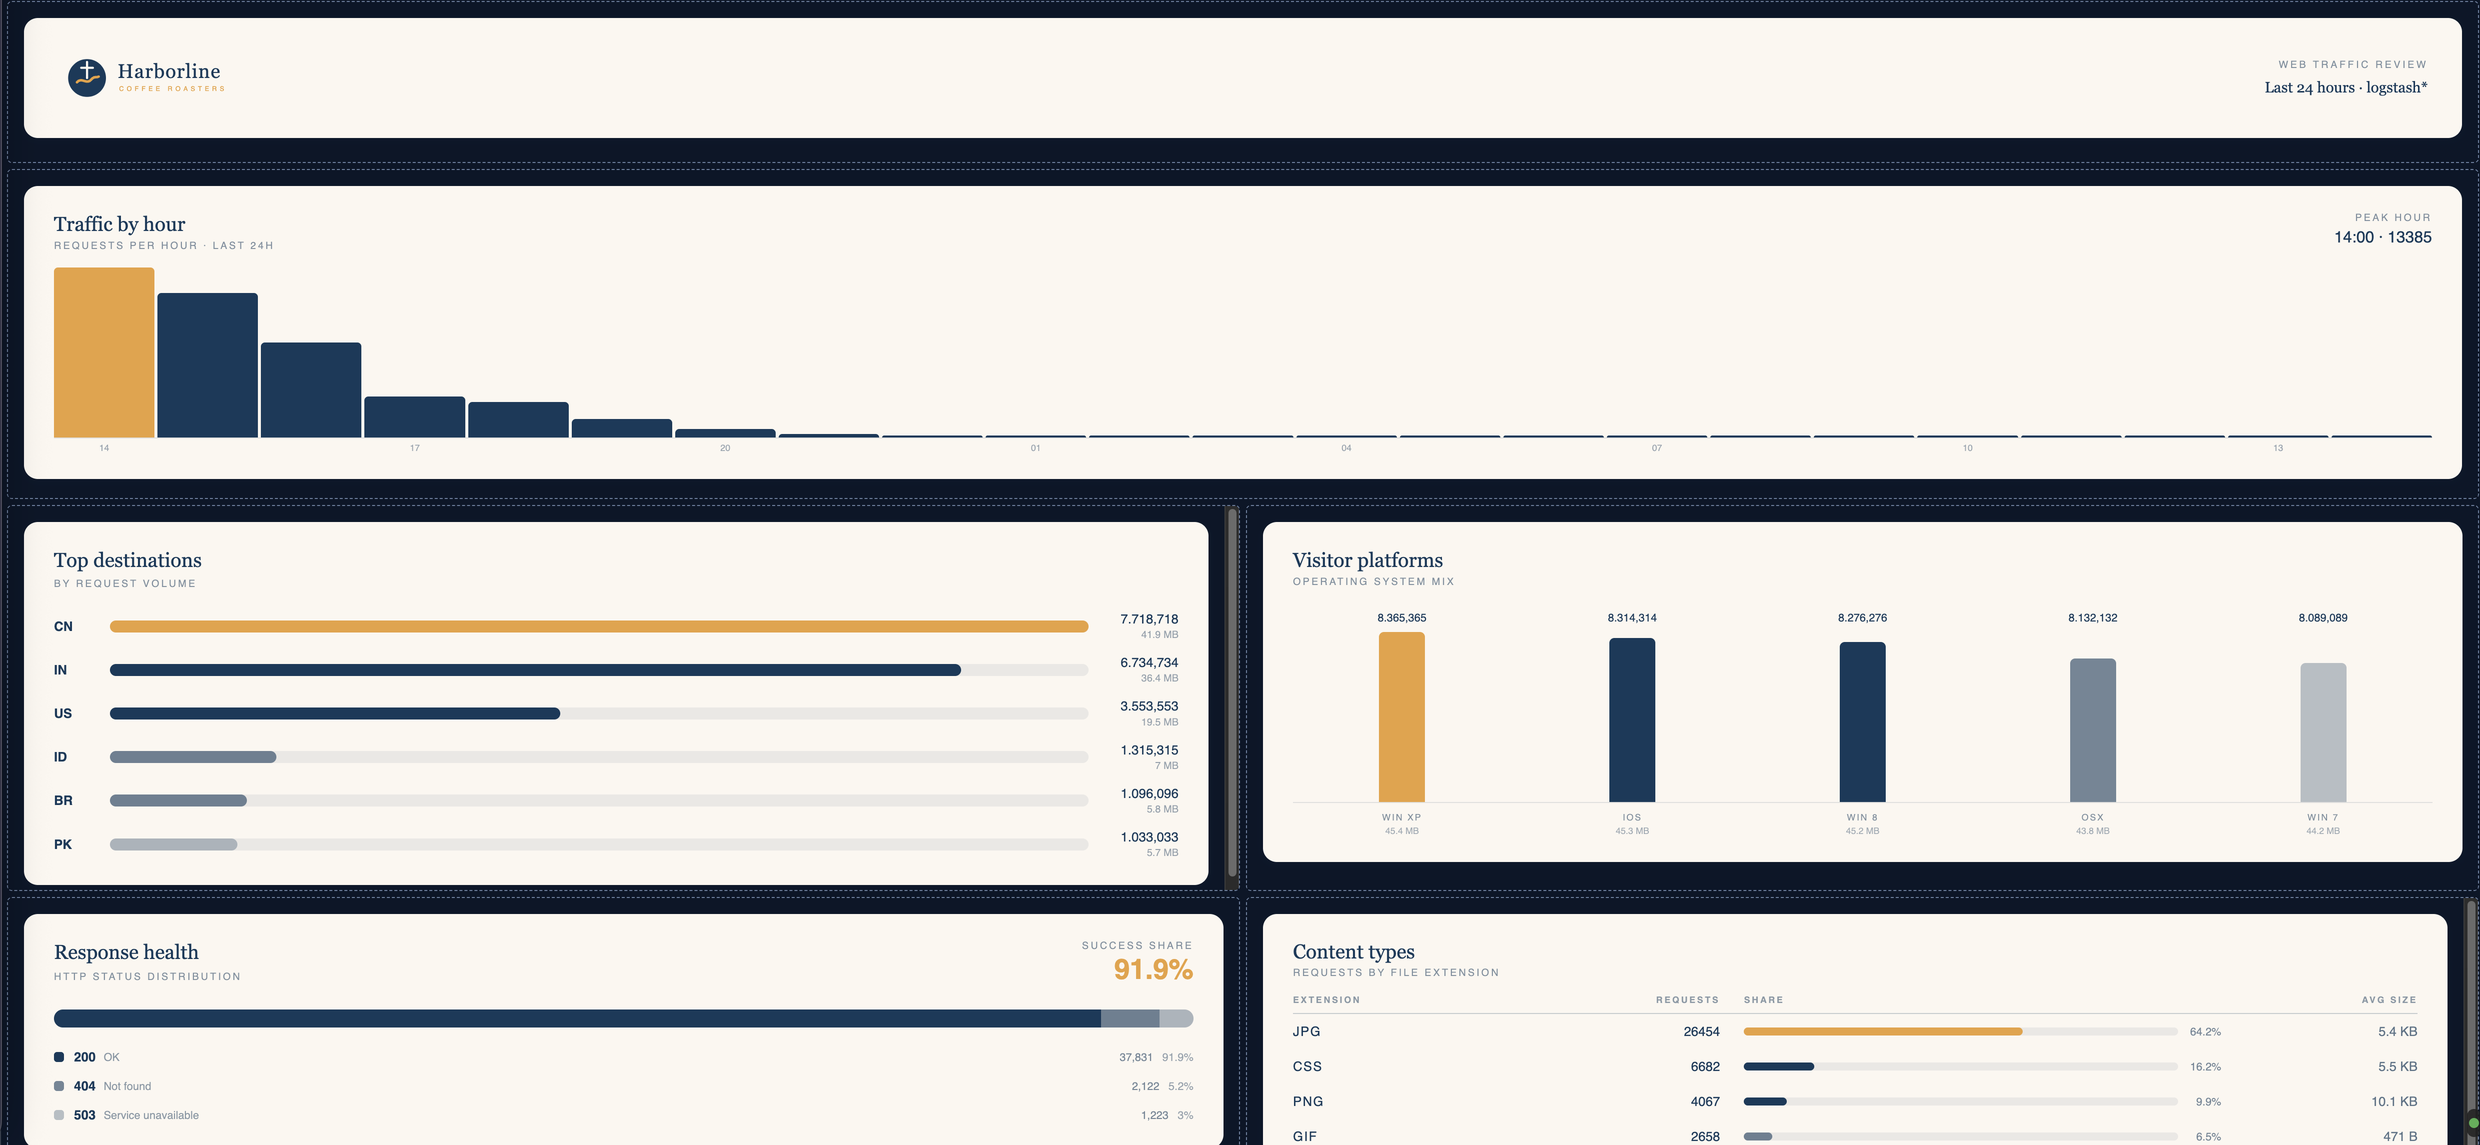
With a custom panel, you add layouts to a Kibana dashboard that other panel types can't produce: status boards, scorecards with colored badges, branded banners, or blocks that mix text with live values. You describe the panel in Elastic Agent Builder chat, or write the HTML and CSS template yourself. To show live data, add an ES|QL query and place its results in the template with [Liquid](https://liquidjs.com/) tags, a template syntax for inserting values into HTML.
## Requirements
To add custom panels to a dashboard, you need:
- **All** privilege for the **Dashboard** feature in Kibana.
- [Elastic Agent Builder set up](https://docs-v3-preview.elastic.dev/elastic/docs-content/pull/8169/explore-analyze/ai-features/agent-builder/get-started) in your deployment, if you want to generate or refine panels with chat. Without it, you can still write templates yourself.
- Data that you can query with ES|QL, if you want the panel to show live values. If you're new to ES|QL, refer to [Use ES|QL in the Kibana UI](https://docs-v3-preview.elastic.dev/elastic/docs-content/pull/8169/explore-analyze/query-filter/languages/esql-kibana).
## When to use a custom panel
Use the panel type that fits your data, and choose a custom panel only when none of the standard types does:
- For standard charts such as time series, bar, pie, metric, or tables, use [Visualizations](https://docs-v3-preview.elastic.dev/elastic/docs-content/pull/8169/explore-analyze/visualize/lens), with or without an [ES|QL query](https://docs-v3-preview.elastic.dev/elastic/docs-content/pull/8169/explore-analyze/visualize/esorql).
- For scatter plots, small multiples, or layered charts, use [Vega](https://docs-v3-preview.elastic.dev/elastic/docs-content/pull/8169/explore-analyze/visualize/custom-visualizations-with-vega).
- For text without data, use a [Markdown text panel](https://docs-v3-preview.elastic.dev/elastic/docs-content/pull/8169/explore-analyze/visualize/text-panels).
- For any other layout that HTML and CSS can express, use a custom panel. For example:
- Chart types that aren't available in Visualizations and are complex to build as Vega visualizations, such as flowcharts, Sankey diagrams, or Gantt charts.
- Tables with conditional formatting, where a cell or row changes color when a value crosses a threshold.
- Banners with your logo or brand colors. Place the logo as inline SVG in the template and it travels with the dashboard when you export it to another space or deployment. Uploaded [image panels](https://docs-v3-preview.elastic.dev/elastic/docs-content/pull/8169/explore-analyze/visualize/image-panels) lose their files on export.
- Summary cards that combine several metrics, with badges, thresholds, or CSS-only tabs that switch between views.
When you ask Elastic Agent Builder to build a dashboard, the agent follows the same order and creates a custom panel only when nothing else fits.
## How custom panels work
A custom panel stores two things:
- A **template**: HTML, CSS, and, when the panel has a query, Liquid tags that insert the query results. The template is what renders.
- An optional **ES|QL query**. When the panel has a query, Kibana runs it and fills the template with the results.
When chat generates a panel, it writes the template once, at creation or edit time. Rendering never calls the model again, so the panel loads as fast as any other ES|QL panel. Templates render in a sandbox that blocks scripts and external resources. For details, refer to [Limitations](#custom-panels-limitations).
## Create a custom panel
A custom panel needs a template and, to show live data, an ES|QL query. You can write the template yourself or generate it with Elastic Agent Builder. Start from the dashboard to add the panel where you want it and work in the flyout. Start from a conversation to let the agent build the panel, or a whole dashboard, for you.
### Start from the dashboard
1. Open your dashboard in **Edit** mode.
2. Select **Add** in the application menu and, if required, **New panel**.
3. Select **Custom**.
Kibana adds an empty panel and opens the **Create custom panel** flyout.
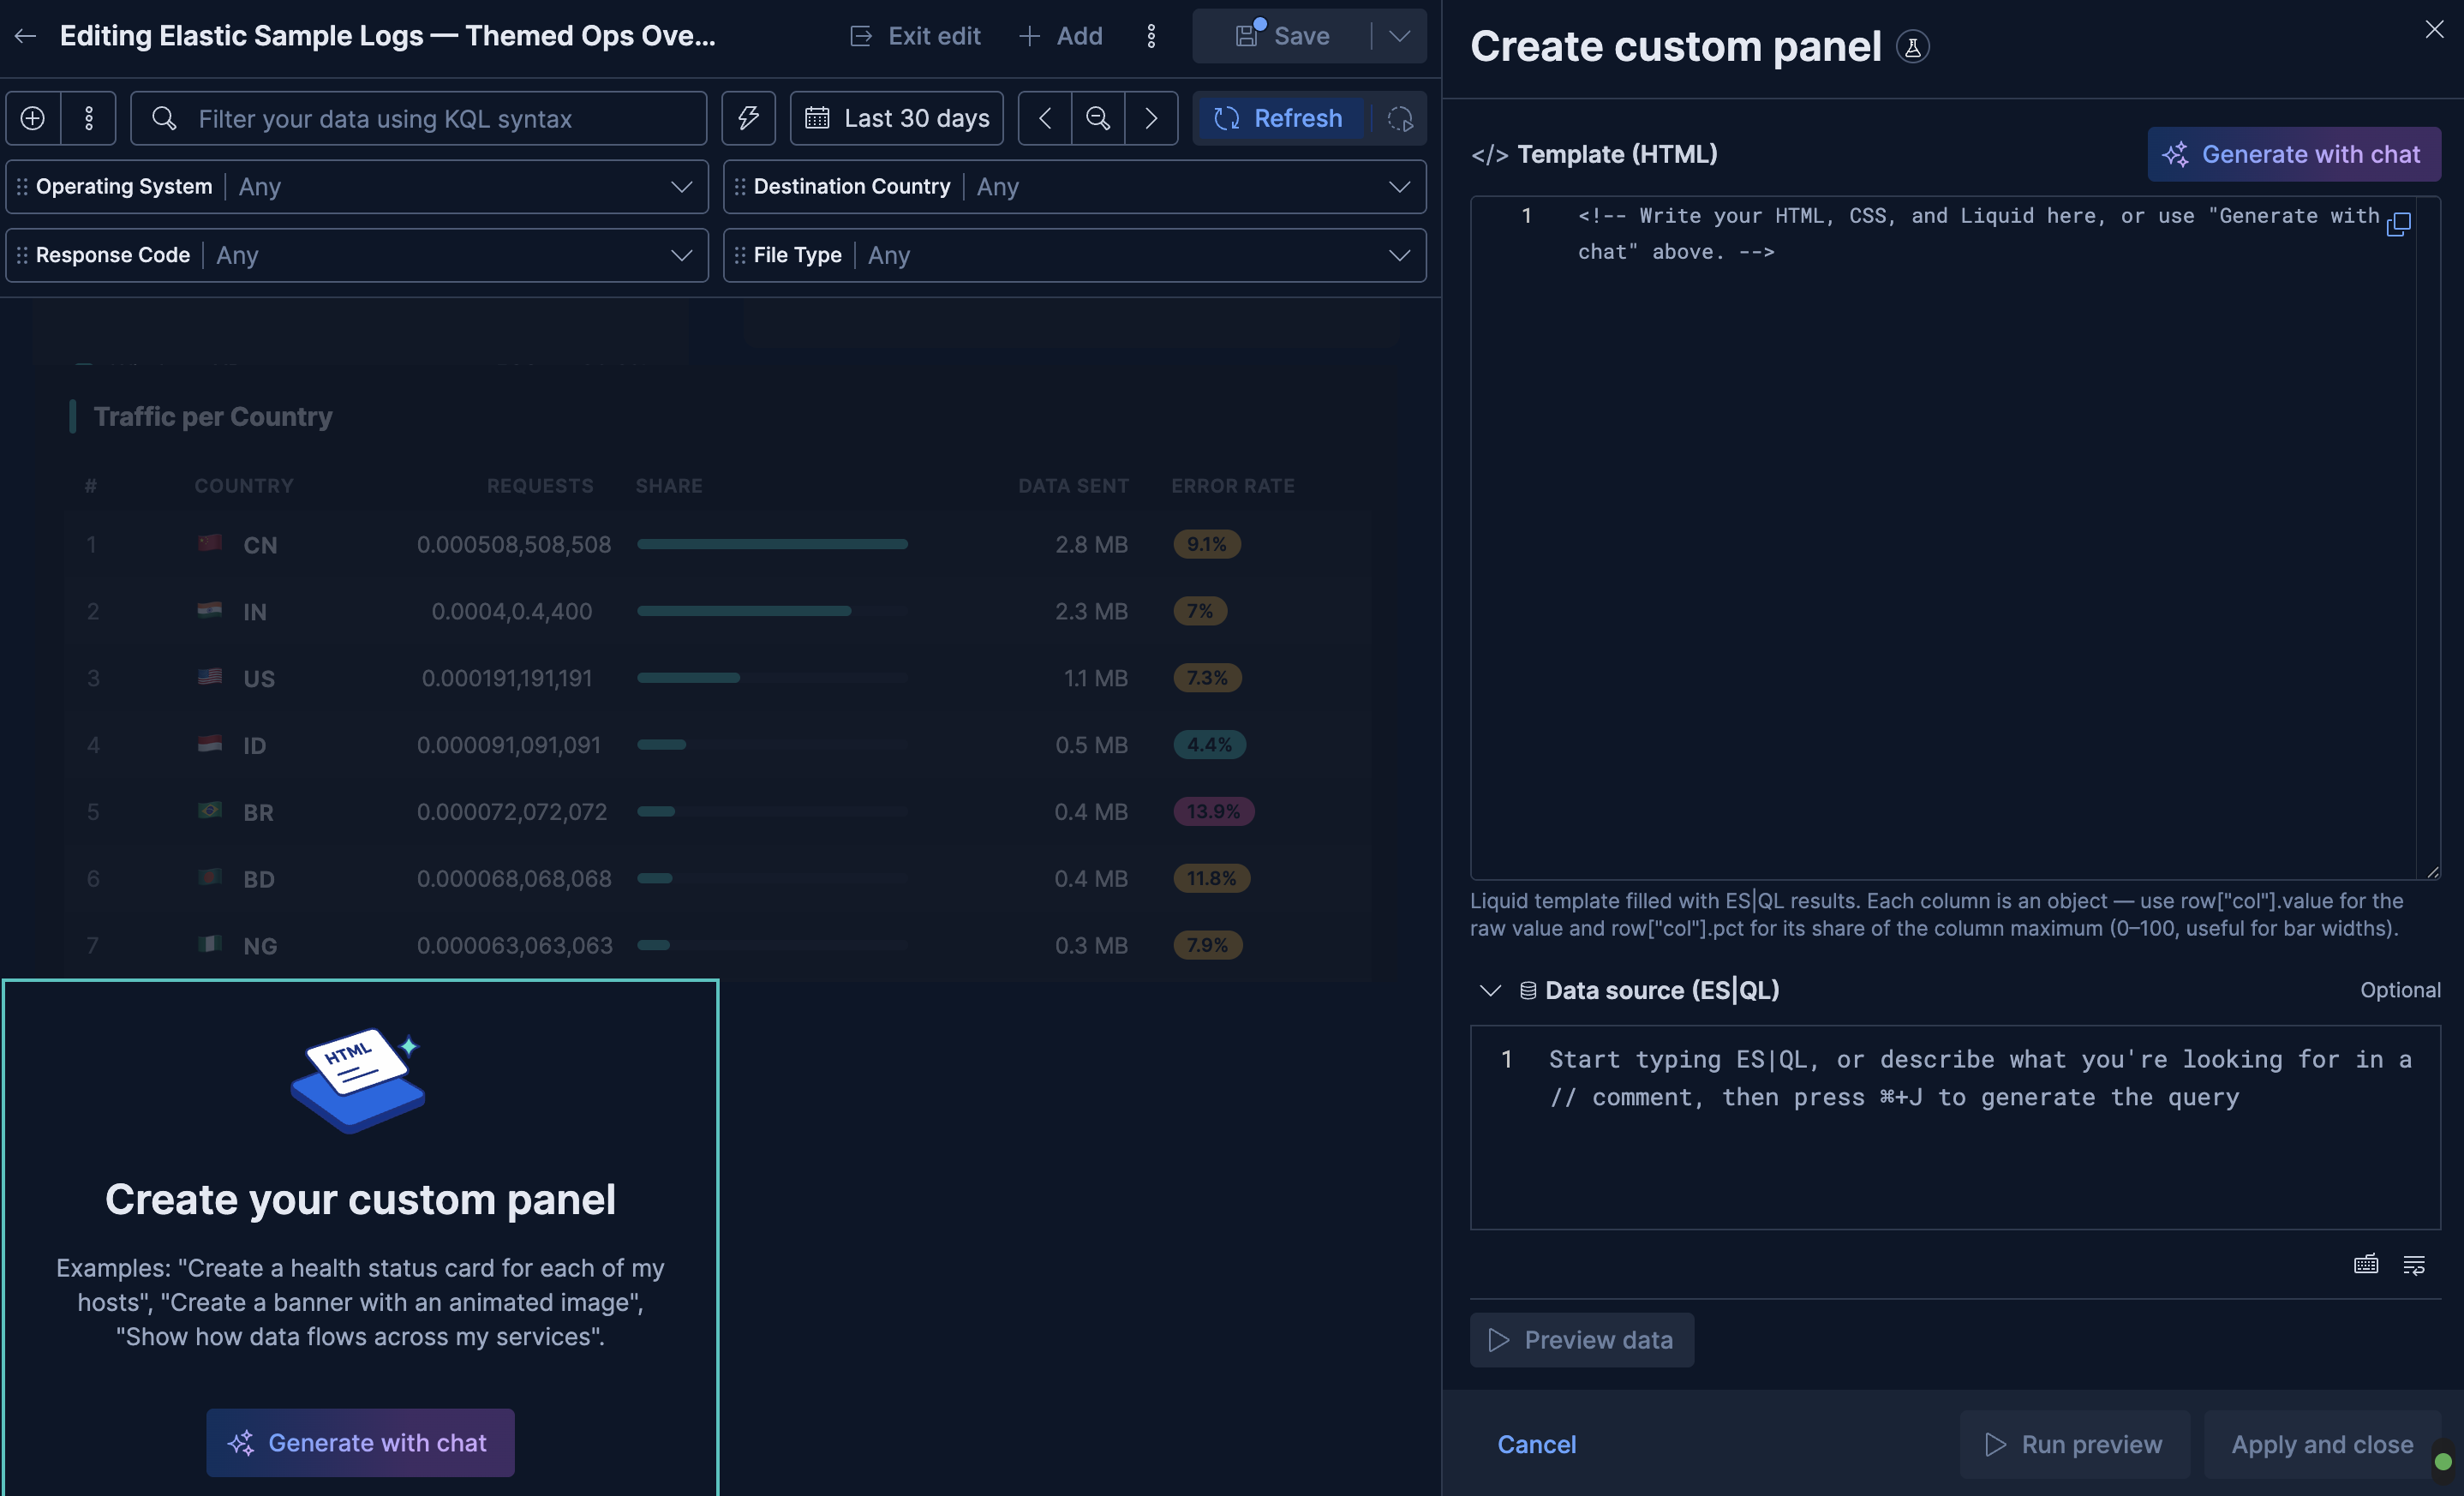
4. Provide the template in one of two ways:
- Enter it in **Template (HTML)**. For the syntax, refer to [Write a template](#custom-panels-write-a-template).
- Select **Generate with chat** and describe the panel. The flyout closes, the empty panel stays on the dashboard, and a new conversation opens with the panel attached. When the answer completes, the panel shows the generated template and, when the panel needs live data, its query. The remaining steps apply when you enter the template yourself. To adjust a generated panel, refer to [Refine a custom panel with chat](#custom-panels-refine-with-chat).
5. Optional: to show live data, expand **Data source (ES|QL)** and enter a query. Select **Preview data** to check the returned columns. The preview shows the first rows of the result.
You can switch between the template and the query until the column names match.
If the flyout reports that the query isn't connected to the dashboard time filter, add a `WHERE` clause with the `?_tstart` and `?_tend` parameters on your time field. Refer to [Connect the panel to the time filter](#custom-panels-time-filter).
6. Select **Run preview** to render your draft in the panel without saving it.
If the query or the template is invalid, the panel shows **Failed to render panel** with the ES|QL or Liquid error.
7. Select **Apply and close**.
If you select **Cancel** instead, Kibana removes the new panel.
8. Save the dashboard.
The panel now shows your content. If it has a query, change the dashboard time range to confirm that the content updates.
### Start from a conversation
1. Open [Elastic Agent Builder chat](https://docs-v3-preview.elastic.dev/elastic/docs-content/pull/8169/explore-analyze/ai-features/agent-builder/chat). To add the panel to an existing dashboard, open that dashboard first and select the **AI Agent** button in the header bar, which opens the [chat sidebar](/elastic/docs-content/pull/8169/explore-analyze/ai-features/agent-builder/standalone-and-flyout-modes#sidebar-mode) with the dashboard attached. From a conversation without a dashboard, the agent creates a new dashboard for the panel.
2. Describe the panel you want. The agent chooses the panel type and uses a custom panel only when a standard visualization doesn't fit. If you want a custom panel, say so in the prompt by asking for a custom panel or an HTML panel. For example:
- "Create a custom panel with a health status card for each host."
- "Create an HTML banner with an animated image."
- "Create a custom panel that shows how data flows across the services."
3. Review the result. When the panel needs live data, the agent writes the ES|QL query, samples its results, and generates a template that matches the returned columns. The panel renders on the dashboard, or in the dashboard preview of the conversation.
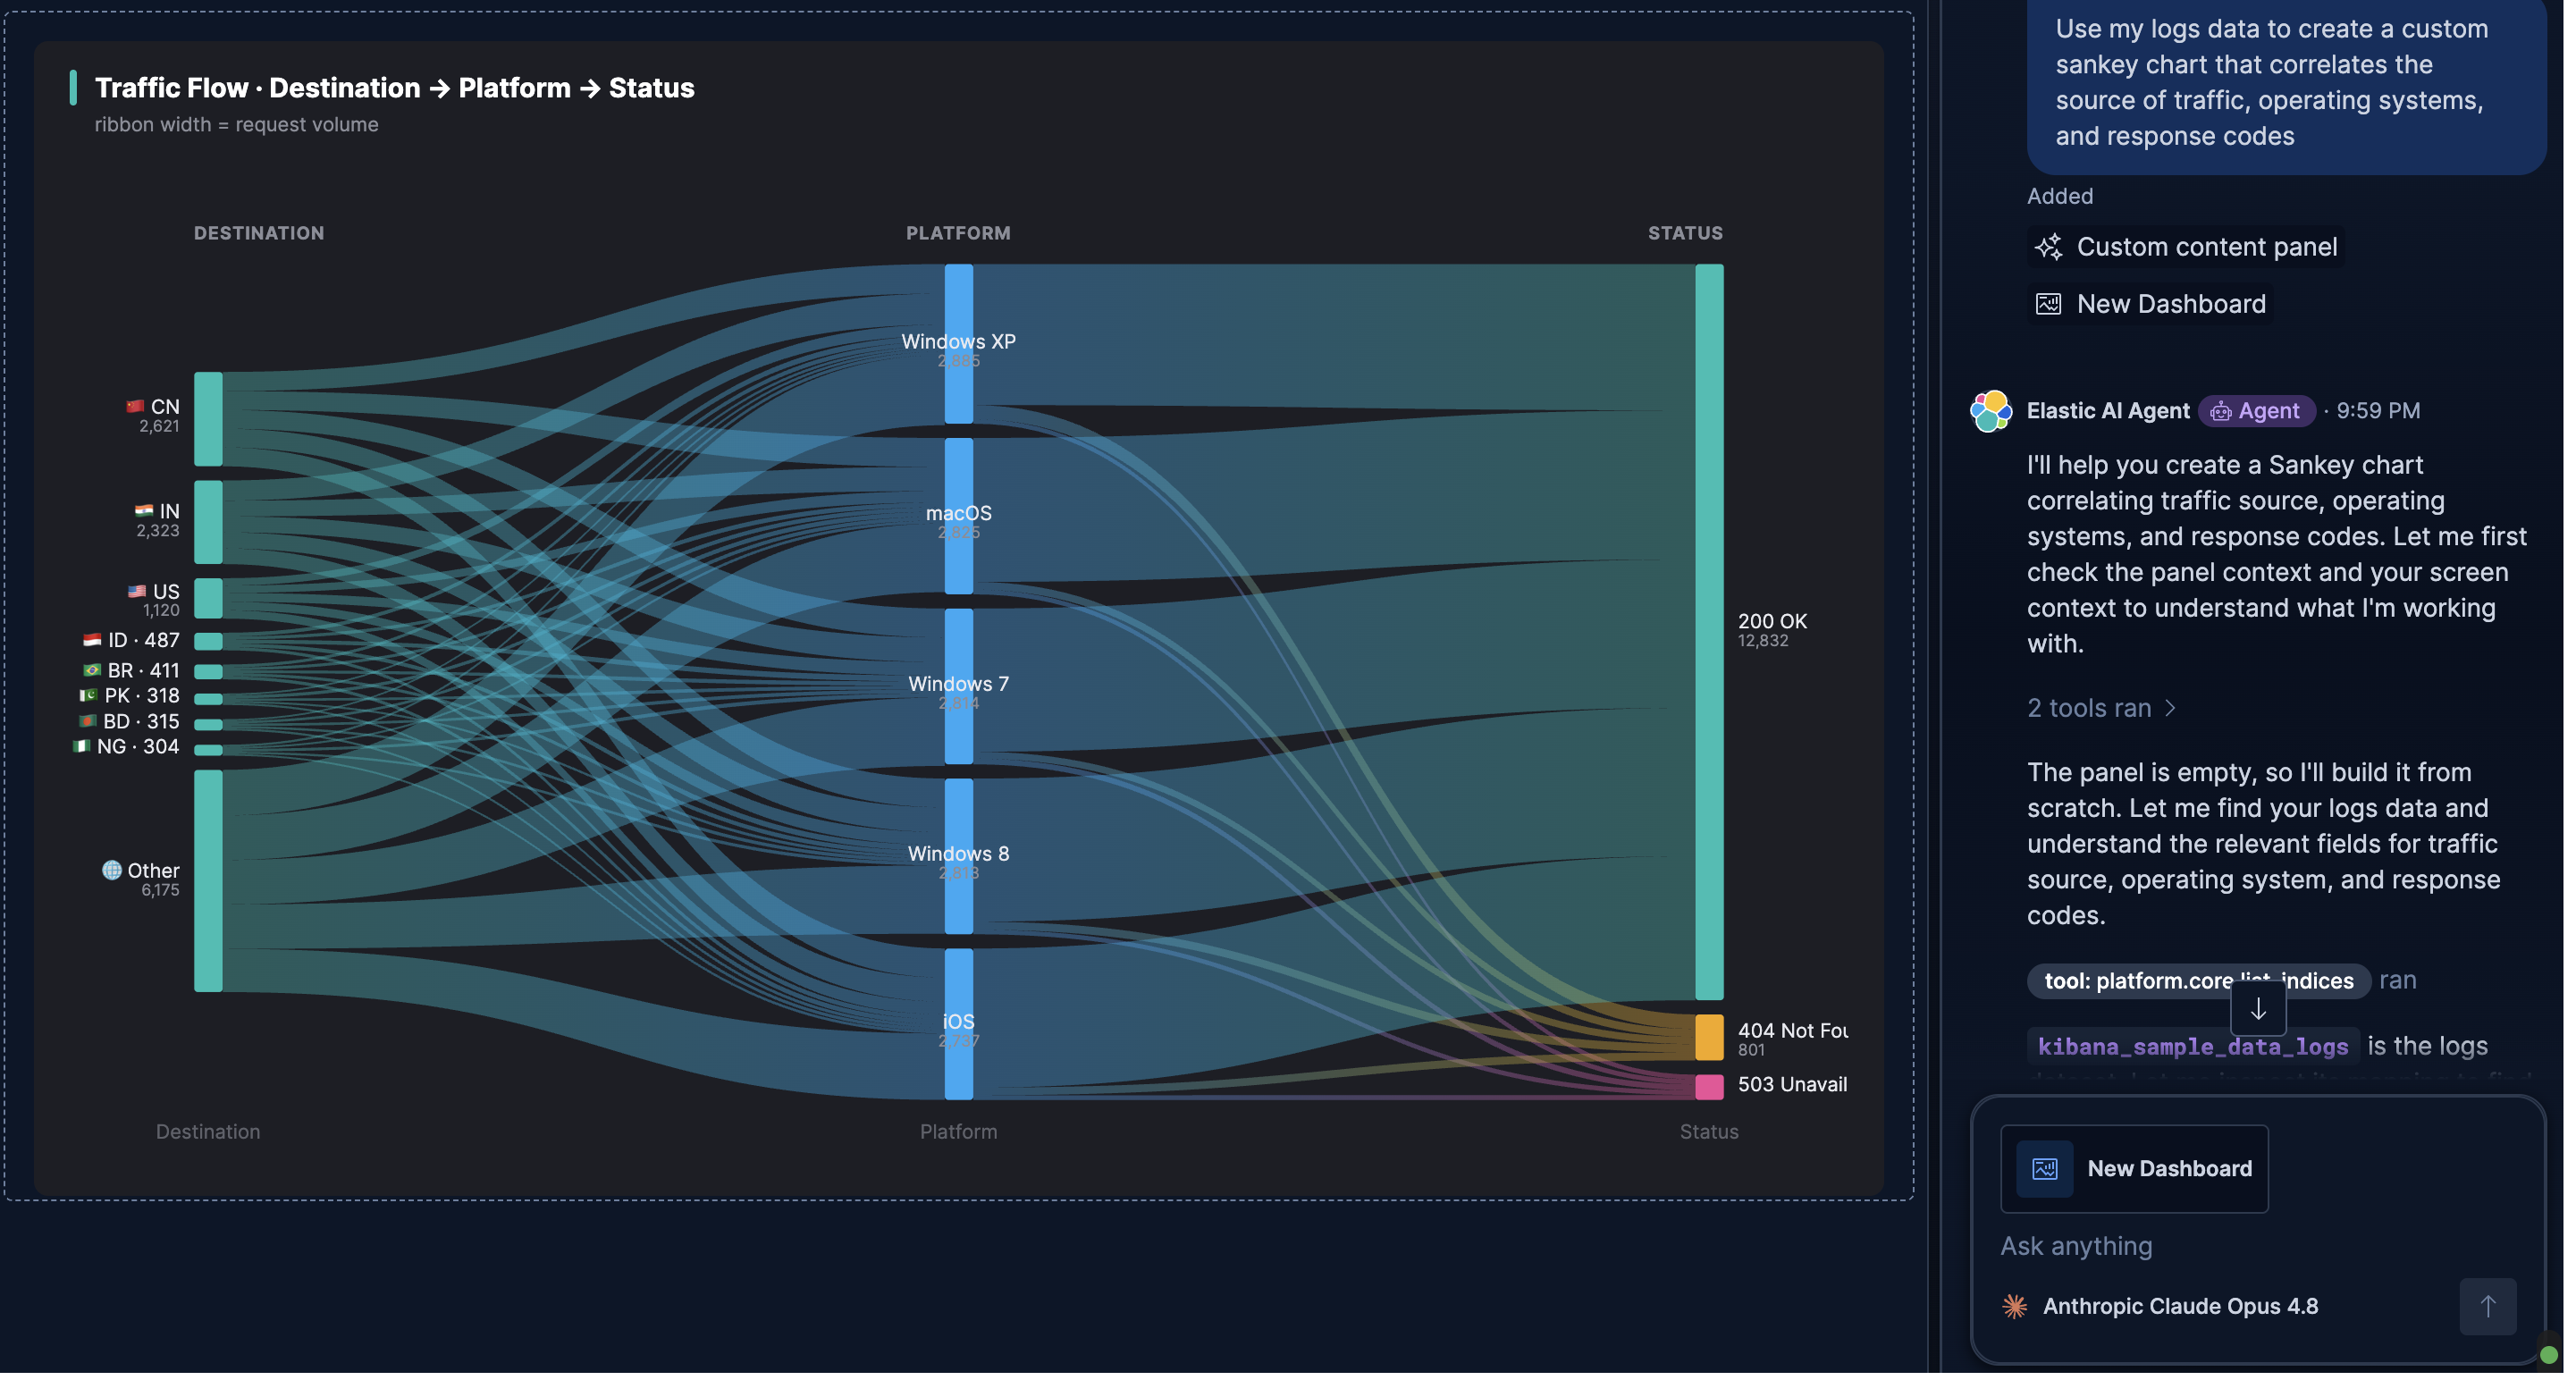
4. Save the dashboard, or keep chatting to change the panel.
For saving, previewing, and syncing agent-created dashboards, refer to [Dashboards and visualizations in Elastic Agent Builder chat](https://docs-v3-preview.elastic.dev/elastic/docs-content/pull/8169/explore-analyze/ai-features/agent-builder/agent-builder-dashboards-and-visualizations).
## Edit a custom panel
1. In **Edit** mode, hover over the panel and select `pencil` **Edit Custom content configuration**.
The **Edit custom panel** flyout opens with the current template and query.
2. Change the template, the query, or both. Use **Preview data** to check the query results and **Run preview** to render your draft in the panel.
If you change only the query, Kibana fills the existing template with the new results. Make sure the column names in the template match the new query output.
If the query or the template is invalid, the panel shows **Failed to render panel** with the ES|QL or Liquid error. Select **Preview data** before you apply to catch query errors early. For a template that chat generated, paste the error into the conversation and the agent corrects the template.
3. Select **Apply and close**, then save the dashboard.
The panel shows the updated content. If you changed the query, change the dashboard time range to confirm that the content updates.
To reuse a template in another panel, select the `copy` **Copy template** button in the editor to copy it to your clipboard.
## Refine a custom panel with chat
When a panel is attached to a conversation, the agent can change its template and query, and each answer keeps a version you can go back to. To attach a panel, select **Refine with chat** in the **Edit custom panel** flyout. On an empty panel, the button reads **Generate with chat**. A new conversation opens with the panel attached as **Custom content panel**.
1. Describe the panel or the change you want. The agent updates the template, the query, or both, and the panel on the dashboard updates when the answer completes.
2. To go back to an earlier version, select **Preview** on the card of that answer. Each answer adds a card for its version, and the newest version is already applied to the panel. Keep the dashboard open while you do this.
3. Save the dashboard to keep the result.
The panel shows the version you applied last, and that version is what the dashboard saves.
## Write a template
A template is HTML with inline CSS in `
{% if rows.size == 0 %}No data for the selected time range.
{% endif %}
{% for row in rows %}
{{ row["category"].value }}
{{ row["revenue"].value | round: 2 }}
{% endfor %}
```
Keep the following in mind when you write templates:
- Grouping, sorting, and aggregation must happen in the ES|QL query, for example with `STATS ... BY`. The template receives the rows exactly as the query returns them.
- A column that the query doesn't return has no value. Its `.value` and `.pct` render as empty strings, and filters such as `round` turn it into `0`. If the panel shows zeros or full-width bars after a query change, check the column names in the template.
- Missing rows are not an error. Check `rows.size` to render an empty state.
For complete templates with their queries and screenshots, refer to [Custom panel examples](https://docs-v3-preview.elastic.dev/elastic/docs-content/pull/8169/explore-analyze/visualize/custom-panel-examples).
### Match the Kibana theme
Kibana injects the following CSS custom properties into every custom panel. Use them instead of hard-coded colors so the panel follows the light or dark theme without reloading its data.
| Property | Use for |
|-------------------------|--------------------------------|
| `--cc-color-text` | Text |
| `--cc-color-background` | Panel background |
| `--cc-color-surface` | Card and container backgrounds |
| `--cc-color-primary` | Primary accent |
| `--cc-color-accent` | Secondary accent |
| `--cc-color-accent-2` | Additional accent |
| `--cc-color-warning` | Warning states |
| `--cc-color-danger` | Error and danger states |
| `--cc-color-border` | Borders |
There is no dedicated property for a healthy or success state. For a three-state status board, pick one of the accent properties for the healthy state, or set your own color.
## Dashboard interactions
When a custom panel has a query, it responds to the dashboard like other ES|QL panels:
- The time filter. Refer to [Connect the panel to the time filter](#custom-panels-time-filter).
- The query bar and filter pills. The query fields are also available for suggestions in the query bar and filter editor.
- [Controls](https://docs-v3-preview.elastic.dev/elastic/docs-content/pull/8169/explore-analyze/visualize/dashboard-controls), including [ES|QL variable controls](https://docs-v3-preview.elastic.dev/elastic/docs-content/pull/8169/explore-analyze/visualize/add-variable-controls).
- [Fast mode](/elastic/docs-content/pull/8169/explore-analyze/query-filter/languages/esql-kibana#esql-kibana-fast-mode-toggle) for approximate `STATS` results.
A panel without a query renders the same content regardless of the dashboard state.
### Connect the panel to the time filter
When the queried indices have a field named `@timestamp`, the dashboard time filter applies to the query automatically. For any other time field, add a `WHERE` clause with the `?_tstart` and `?_tend` parameters so the query follows the time filter. When a query has neither, the **Data source (ES|QL)** section of the flyout shows a hint. The following query follows the time filter through `my_date_field`:
```esql
FROM my-index
| WHERE my_date_field >= ?_tstart AND my_date_field < ?_tend
| STATS revenue = SUM(amount) BY category
```
For details, refer to [Custom time parameters](/elastic/docs-content/pull/8169/explore-analyze/query-filter/languages/esql-kibana#_custom_time_parameters).
## Limitations
Custom panels render in a sandbox that protects the dashboard and your browser:
- JavaScript doesn't run. `