---
title: Example: Install Fleet-managed Elastic Agent on Kubernetes using Helm
description: This example demonstrates how to install a Fleet-managed Elastic Agent on a Kubernetes system using a Helm chart, collect Kubernetes metrics and logs...
url: https://docs-v3-preview.elastic.dev/elastic/docs-content/pull/9230/reference/fleet/example-kubernetes-fleet-managed-agent-helm
products:
- Elastic Agent
- Elastic Documentation
- Fleet
applies_to:
- Elastic Cloud Serverless: Generally available
- Elastic Stack: Generally available
---
# Example: Install Fleet-managed Elastic Agent on Kubernetes using Helm
This example demonstrates how to install a Fleet-managed Elastic Agent on a Kubernetes system using a Helm chart, collect Kubernetes metrics and logs using the [Kubernetes Integration](https://docs-v3-preview.elastic.dev/elastic/integration-docs/tree/main/reference/kubernetes), and send the data to an Elasticsearch cluster in Elastic Cloud for visualization in Kibana.
Although this tutorial uses an Elastic Cloud Hosted deployment, the same steps can be adapted for other deployment types. For self-managed, Elastic Cloud on Kubernetes, or Elastic Cloud Enterprise deployments, you might need to provide the Fleet Server CA certificate during the Elastic Agent installation, as outlined below.
For an overview of the Elastic Agent Helm chart and its benefits, refer to [Install Elastic Agent on Kubernetes using Helm](https://docs-v3-preview.elastic.dev/elastic/docs-content/pull/9230/reference/fleet/install-on-kubernetes-using-helm).
This guide takes you through these steps:
- [Add the Elastic Helm repository](#preparations)
- [Create a Fleet policy and install Elastic Agent](#agent-fleet-managed-helm-example-install-agent)
- [Install the Kubernetes integration](#agent-fleet-managed-helm-example-install-integration)
- [Tidy up](#agent-fleet-managed-helm-example-tidy-up)
## Prerequisites
To get started, you need:
- A local install of the [Helm](https://helm.sh/) Kubernetes package manager.
- An [Elastic Cloud Hosted](https://cloud.elastic.co/registration?page=docs&placement=docs-body) Elasticsearch cluster on version 8.18 or higher, with an [Integrations Server](/elastic/docs-content/pull/9230/deploy-manage/deploy/elastic-cloud/ec-customize-deployment-components#ec_integrations_server) component. An Elastic Cloud Serverless project also meets this requirement.
- An active Kubernetes cluster.
- Elastic Stack: Generally available since 9.5 For Red Hat OpenShift clusters, the permissions listed in [Install on OpenShift](#agent-fleet-managed-helm-install-openshift).
## Installation overview
The installation and configuration steps shown in this example deploys the following components to monitor your Kubernetes cluster:
- A default installation of [`kube-state-metrics` (KSM)](https://github.com/kubernetes/kube-state-metrics), configured as a dependency of the Helm chart. KSM is required by the Kubernetes integration to collect cluster-level metrics.
- A group of Elastic Agents deployed as a [Kubernetes DaemonSet](https://kubernetes.io/docs/concepts/workloads/controllers/daemonset/), connected to Fleet, and configured through a Fleet policy to collect the following metrics and logs:
- Host-level metrics and logs through the [System integration](https://docs-v3-preview.elastic.dev/elastic/integration-docs/tree/main/reference/system): This enables the monitoring of your Kubernetes nodes at OS level. Elastic Agent Pods will collect system metrics and logs from their own hosts.
- Kubernetes metrics and logs through the [Kubernetes integration](https://docs-v3-preview.elastic.dev/elastic/integration-docs/tree/main/reference/kubernetes): This enables Kubernetes monitoring at both cluster and node levels. All Elastic Agent Pods will collect node-level Kubernetes metrics and logs from their own hosts, while one of the agents will also collect cluster-level metrics and events, acting as a [leader](https://docs-v3-preview.elastic.dev/elastic/docs-content/pull/9230/reference/fleet/kubernetes_leaderelection-provider).
By default, all resources are installed in the namespace defined by your current `kubectl` context. You can override this by specifying a different namespace using the `--namespace` option during installation.
The proposed approach of a single Elastic Agent DaemonSet to collect all metrics works well for small to medium-sized Kubernetes clusters.For larger clusters, or when kube-state-metrics (KSM) metrics collection becomes a performance bottleneck, we recommend a more scalable architecture: move the KSM metric collection to a separate set of agents deployed as sidecars alongside KSM, with autosharding enabled.This can be easily implemented with the Helm chart. For details, refer to the [KSM autosharding example](https://github.com/elastic/elastic-agent/tree/main/deploy/helm/elastic-agent/examples/fleet-managed-ksm-sharding).
## Step 1: Add the Elastic Helm repository
Before installing, add the Elastic Helm repository to your local Helm configuration and verify the available versions of the `elastic-agent` chart. If the repository is already configured, run `helm repo update` to ensure you have the latest package information.
1. Set up Helm repository:
```sh
helm repo add elastic https://helm.elastic.co/
helm repo update
```
2. Verify chart versions:
```sh
helm search repo elastic-agent --versions
```
The previous command returns something similar to:
```sh
NAME CHART VERSION APP VERSION DESCRIPTION
elastic/elastic-agent 9.0.0 9.0.0 Elastic-Agent Helm Chart
elastic/elastic-agent 8.18.0 8.18.0 Elastic-Agent Helm Chart
```
## Step 2: Create a Fleet policy and install Elastic Agent
### Create a policy and obtain enrollment details
1. Open your Elastic Cloud deployment, and from the navigation menu select **Fleet**.
2. From the **Agents** tab, select **Add agent**.
3. In the **Add agent** UI, specify a policy name and select **Create policy**. Leave the **Collect system logs and metrics** option selected.
4. Scroll down in the **Add agent** flyout to the **Install Elastic Agent on your host** section.
5. Select the **Linux TAR** tab and copy the values for `url` and `enrollment-token`. You’ll use these when you run the `helm install` command.
6. Open a terminal shell on your local system where the Helm tool is installed and you have access to the Kubernetes cluster.
### Install on Kubernetes
If you're installing on OpenShift, review the requirements in [Install on OpenShift](#agent-fleet-managed-helm-install-openshift) before you run the command.
1. Copy and prepare the command to install the chart:
```sh
helm install demo elastic/elastic-agent \
--set agent.fleet.enabled=true \
--set system.enabled=true \
--set agent.fleet.url= \
--set agent.fleet.token= \
--set agent.fleet.preset=perNode
```
The command has these properties:
- `helm install`: Runs the Helm CLI install tool. You can use `helm upgrade` to modify or update an installed release.
- `demo`: The name for this specific installation of the chart, known as the **release name**. You can choose any name you like.
- `elastic/elastic-agent`: The name of the chart to install, using the format `/`.
- `--set agent.fleet.enabled=true`: Enables Fleet-managed Elastic Agent, which is disabled (`false`) by default.
- `--set system.enabled=true`: Adds the required volumes and mounts to enable host monitoring through the System integration.
- `--set agent.fleet.url=`: Specifies the address where Elastic Agent connects to Fleet Server in your Elastic Cloud deployment.
- `--set agent.fleet.token=`: Sets the enrollment token that Elastic Agent uses to authenticate with Fleet Server.
- `--set agent.fleet.preset=perNode`: Runs the agent as a `DaemonSet`, which is required for the purpose of this example. Refer to [Install Elastic Agent on Kubernetes using Helm](https://docs-v3-preview.elastic.dev/elastic/docs-content/pull/9230/reference/fleet/install-on-kubernetes-using-helm) for more details and use cases for this parameter.
After your updates, the command should be similar to:
```sh
helm install demo elastic/elastic-agent \
--set agent.fleet.enabled=true \
--set system.enabled=true \
--set agent.fleet.url=https://256575858845283fxxxxxxxd5265d2b4.fleet.us-central1.gcp.foundit.no:443 \
--set agent.fleet.token=eSVvFDUvSUNPFldFdhhZNFwvS5xxxxxxxxxxxxFEWB1eFF1YedUQ1NWFXwr== \
--set agent.fleet.preset=perNode
```
For a full list of all available values settings and descriptions, refer to the [Elastic Agent Helm Chart Readme](https://github.com/elastic/elastic-agent/tree/main/deploy/helm/elastic-agent) and default [values.yaml](https://github.com/elastic/elastic-agent/blob/main/deploy/helm/elastic-agent/values.yaml).The following options could be useful for special use cases:
- `--namespace `: Allows to install all resources in a specific namespace.
- `--version `: Installs a specific version of the Helm chart and Elastic Agent. Refer to [Preparations](#preparations) to check available versions.
- `--set agent.version=`: Installs a specific version of Elastic Agent. By default, the chart installs the agent version that matches its own.
- `--set-file agent.fleet.ca.value=/local-path/to/fleet-ca.crt`: Provides the CA certificate used by the Fleet Server. This is typically needed when the server uses a certificate signed by a private CA. Not required for Fleet Servers running on Elastic Cloud.
- `--set agent.fleet.insecure=true`: Use this option to skip the Fleet certificate verification if your Fleet Server uses a self-signed certificate, such as when installed in quickstart mode. Not required for Fleet Servers running on Elastic Cloud. This option is not recommended for production environments.
- `--set kube-state-metrics.enabled=false`: In case you already have KSM installed in your cluster, and you don't want to install a second instance.
- `--set kube-state-metrics.fullnameOverride=ksm`: If you want to deploy KSM with a different release name (it defaults to `kube-state-metrics`). This can be useful if you have already a default installation of KSM and you want a second one.
2. Run the command.
The command output should confirm that Elastic Agent has been installed:
```sh
...
Installed agent:
- perNode [daemonset - managed mode]
...
```
### Install on OpenShift
- Elastic Stack: Generally available since 9.5
Starting with version 9.5.6, the Elastic Agent Helm chart supports Red Hat OpenShift. On OpenShift, the chart configures the security context constraints (SCCs) that Elastic Agent needs to run. The SCC depends on the `agent.unprivileged` setting:
- By default (`agent.unprivileged=false`), Elastic Agent runs as `root`, and the chart grants the agent service accounts the built-in `privileged` SCC.
- With `agent.unprivileged=true`, Elastic Agent runs as a non-root user, and the chart creates a custom SCC with the minimum permissions Elastic Agent needs. This SCC doesn't allow privileged containers or access to the host PID and IPC namespaces. Use this option if your security policies don't allow the `privileged` SCC.
To install Elastic Agent on OpenShift:
1. Make sure you have the `cluster-admin` role, or equivalent permissions. With the default settings, the chart creates role bindings to the `privileged` SCC in the release namespace, which requires permission to create role bindings and either `use` on that SCC or `bind` on the referenced cluster role. For an unprivileged installation, the chart also creates an SCC and a cluster role.
2. Follow the [Kubernetes installation steps](#agent-fleet-managed-helm-install-kubernetes). Run `helm repo update` first to make sure you install version 9.5.6 or later of the chart. To run Elastic Agent with the minimum permissions, add `--set agent.unprivileged=true` to the installation command.
The chart detects OpenShift automatically by querying the cluster APIs. If you render the chart without access to the cluster, for example with `helm template` or a GitOps tool such as Argo CD, detection doesn't work and the chart doesn't create the OpenShift resources. In that case, add `--set agent.openshift.enabled=true` to the command.
If your organization requires administrators to manage SCCs and role bindings separately, add `--set agent.openshift.securityContextConstraints.create=false` to the command. An administrator then needs to create the resources the chart would otherwise create before you install. To review these resources, render the chart with `helm template` and `--set agent.openshift.enabled=true`, or refer to the [OpenShift examples](https://github.com/elastic/elastic-agent/tree/main/deploy/helm/elastic-agent/examples/kubernetes-openshift-unprivileged) in the Elastic Agent repository.
### Verify the installation and enrollment
1. Run the `kubectl get pods -n default` command to confirm that the Elastic Agent Pods are running. You should see one Elastic Agent Pod running on each Kubernetes node:
```sh
NAME READY STATUS RESTARTS AGE
agent-pernode-demo-86mst 1/1 Running 0 12s
```
If your Kubernetes nodes have [`taints`](https://kubernetes.io/docs/concepts/scheduling-eviction/taint-and-toleration/) configured, you may need to add `tolerations` to the Elastic Agent DaemonSet during installation to ensure the Pods can run on tainted nodes.You can do this by setting the `presets.perNode.tolerations[]` value, which accepts standard Kubernetes toleration definitions.
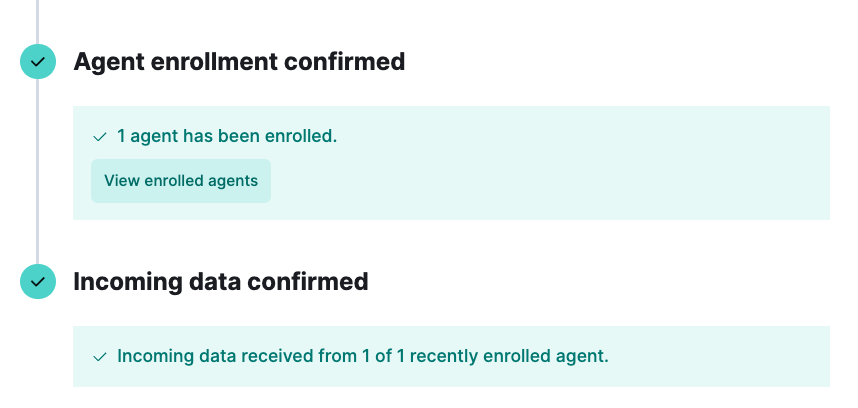
2. In the **Add agent** flyout, wait a minute or so for confirmation that Elastic Agent has successfully enrolled with Fleet and that data is flowing:
3. In Fleet, open the **Agents** tab and see that an **Agent-pernode-demo-#** agent is running.
4. Select the agent to view its details.
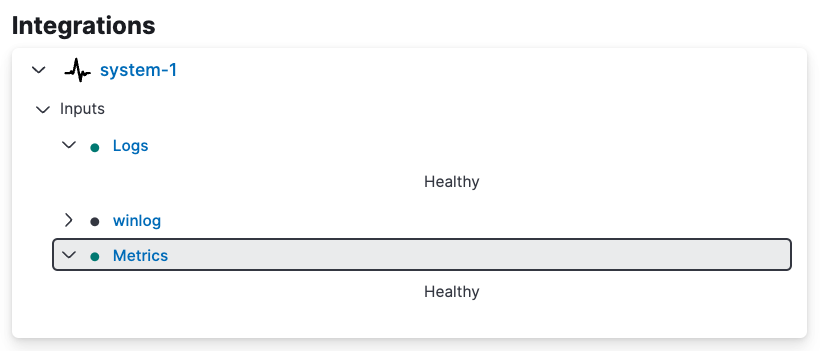
5. On the **Agent details** tab, on the **Integrations** pane, expand `system-1` to confirm that logs and metrics are incoming. You can click either the `Logs` or `Metrics` link to view details.
## Step 3: Install the Kubernetes integration
Now that you’ve Elastic Agent and data is flowing, you can set up the Kubernetes integration.
1. In your Elastic Cloud deployment, from the Kibana menu open the **Integrations** page.
2. Run a search for `Kubernetes` and then select the Kubernetes integration card.
3. On the Kubernetes integration page, click **Add Kubernetes** to add the integration to your Elastic Agent policy.
4. Scroll to the bottom of **Add Kubernetes integration** page. Under **Where to add this integration?** select the **Existing hosts** tab. On the **Agent policies** menu, select the agent policy that you created previously in the [Install Elastic Agent](#agent-fleet-managed-helm-example-install-agent) steps.
You can leave all other integration settings at their default values. For details about the available inputs and data sets, refer to the [Kubernetes integration](https://docs-v3-preview.elastic.dev/elastic/integration-docs/tree/main/reference/kubernetes) documentation.
All inputs under the **Collect Kubernetes metrics from kube-state-metrics** section default to `kube-state-metrics:8080` as the destination host. This works if you deployed KSM (kube-state-metrics) alongside Elastic Agent during the chart installation, which is the default behavior, as both components are installed in the same namespace.If your KSM instance runs in a different namespace than Elastic Agent, or if it uses a different service name, update the `host` setting in each data set of the integration to point to the KSM service.
5. Click **Save and continue**. When prompted, select **Add Elastic Agent later**, because you’ve already added the agent using Helm.
6. On the Kubernetes integration page, open the **Assets** tab and select the **[Metrics Kubernetes] Pods** dashboard.
On the dashboard, you can view the status of your Kubernetes pods, including metrics on memory usage, CPU usage, and network throughput.
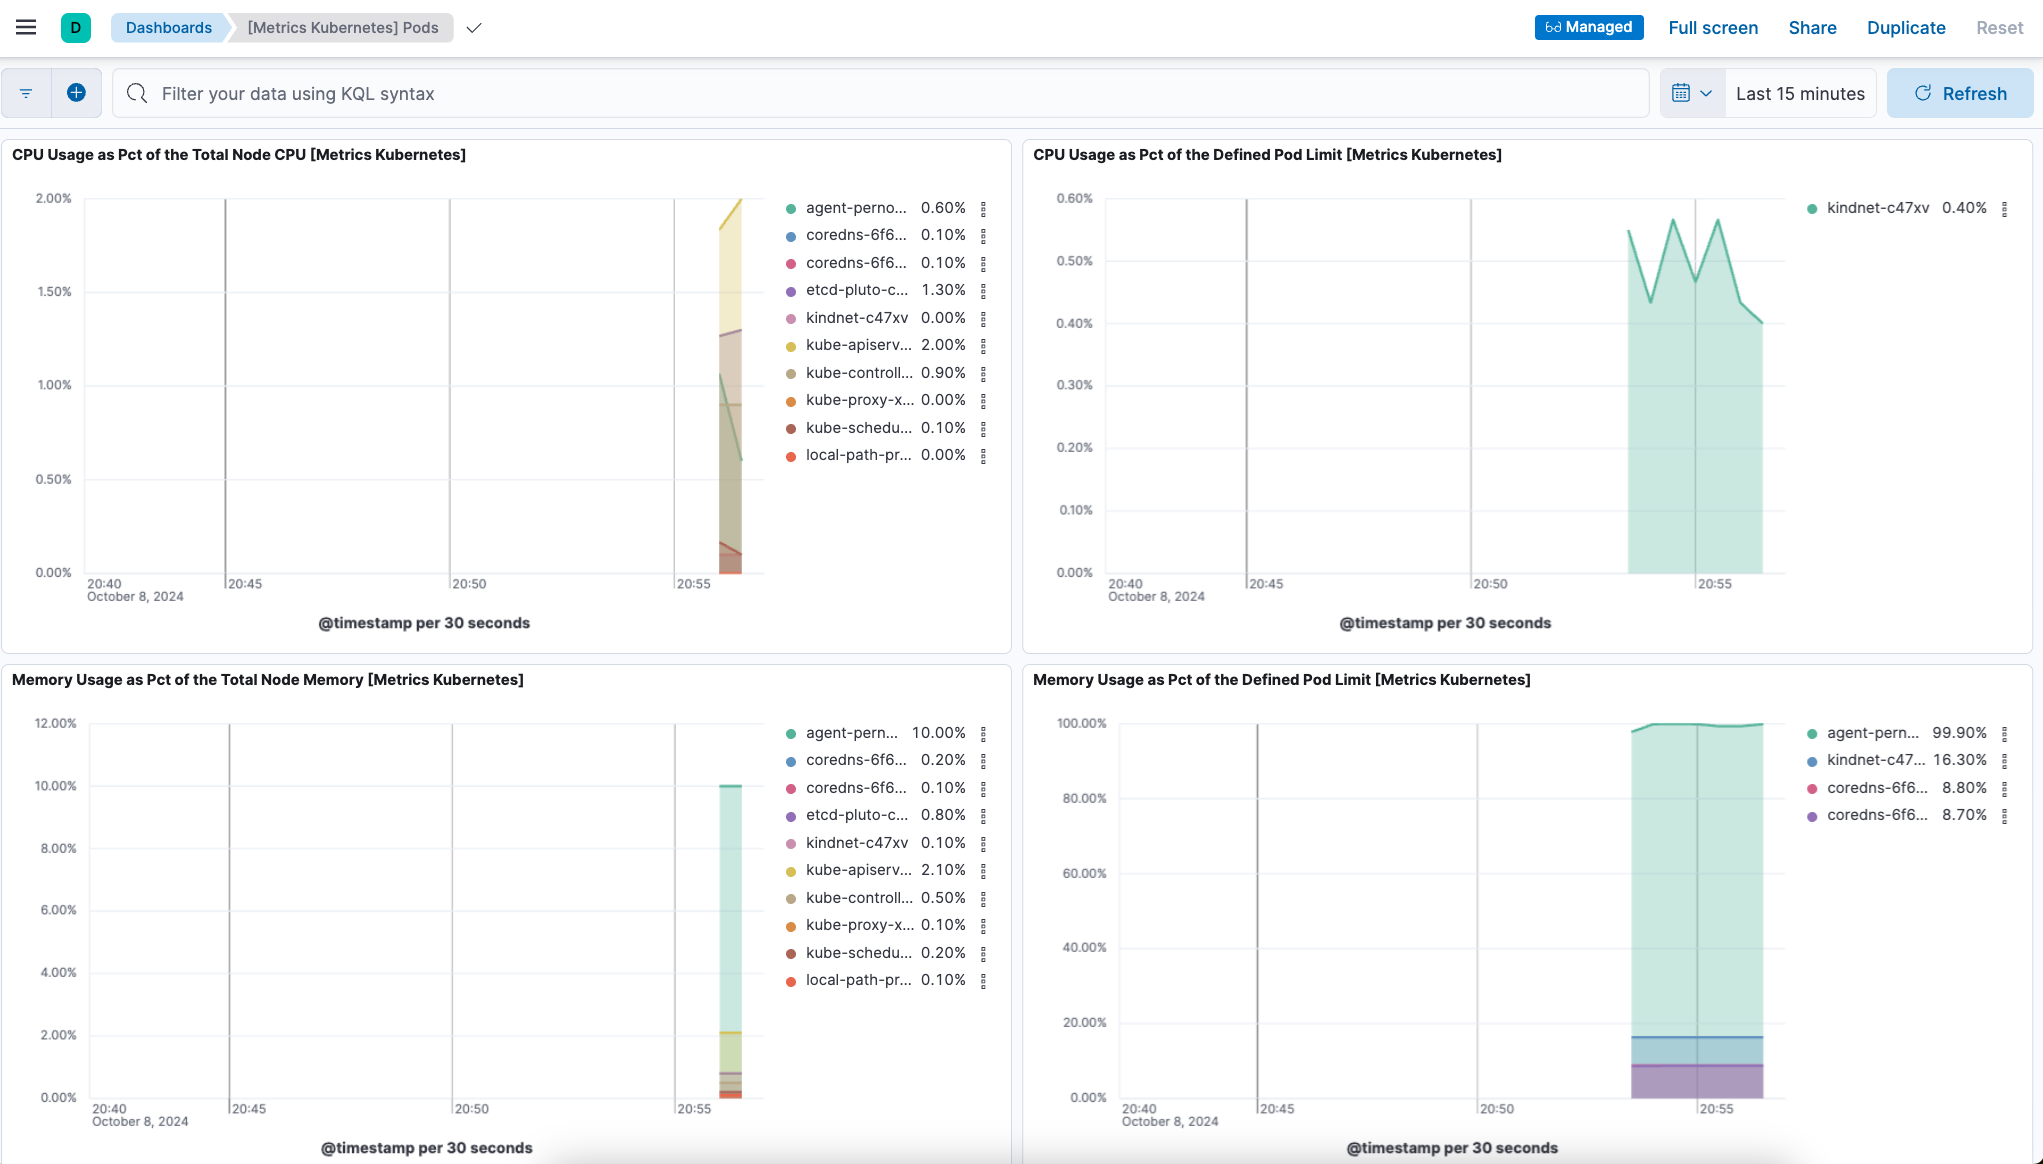
You’ve successfully installed Elastic Agent using Helm, and your Kubernetes metrics data is available for viewing in Kibana.
## Tidy up
After you’ve run through this example, run the `helm uninstall` command to uninstall Elastic Agent.
```sh
helm uninstall demo
```
The uninstall should be confirmed as shown:
```sh
release "demo" uninstalled
```
## Next steps
For full details about using the Elastic Agent Helm chart, refer to the [Elastic Agent Helm Chart Readme](https://github.com/elastic/elastic-agent/tree/main/deploy/helm/elastic-agent).
Refer to the [examples](https://github.com/elastic/elastic-agent/tree/main/deploy/helm/elastic-agent/examples) section of the GitHub repository for advanced use cases, such as integrating Elastic Agents with [KSM autosharding](https://github.com/elastic/elastic-agent/tree/main/deploy/helm/elastic-agent/examples/fleet-managed-ksm-sharding), or configuring [mutual TLS authentication](https://github.com/elastic/elastic-agent/tree/main/deploy/helm/elastic-agent/examples/fleet-managed-certificates) between Elastic Agents and the Fleet Server.