---
title: Apache Airflow OpenTelemetry Assets
description: Apache Airflow is a platform for programmatically authoring, scheduling, and monitoring workflows expressed as Directed Acyclic Graphs (DAGs). These assets...
url: https://docs-v3-preview.elastic.dev/elastic/integration-docs/tree/main/reference/airflow_otel
products:
- Elastic integrations
applies_to:
- Serverless Observability projects: Generally available
- Serverless Security projects: Generally available
- Elastic Stack: Generally available since 9.3
---
# Apache Airflow OpenTelemetry Assets
| | |
|-------------------------------------------------------------------------------------------------------------------------------|----------------------------------------------------------------|
| **Version** | 0.1.0 : Beta ([View all](#changelog)) |
| **Subscription level**[What's this?](https://www.elastic.co/subscriptions) | Basic |
| **Developed by**[What's this?](https://docs-v3-preview.elastic.dev/elastic/integration-docs/tree/main/reference/developed-by) | Elastic |
| **Minimum Kibana version(s)** | 9.3.0 |
To use beta integrations, go to the **Integrations** page in Kibana, scroll down, and toggle on the _Display beta integrations_ option.
Apache Airflow is a platform for programmatically authoring, scheduling, and monitoring workflows expressed as Directed Acyclic Graphs (DAGs). These assets provide prebuilt dashboards, alert rules, and SLO templates for Airflow metrics collected via the OpenTelemetry StatsD receiver, covering scheduler health, task execution, DAG processing, and capacity utilization.
## Compatibility
The Apache Airflow OpenTelemetry assets have been tested with OpenTelemetry Collector Contrib StatsD receiver v0.146.x.
Apache Airflow tested against:
- Apache Airflow 2.6, 2.7, 2.8, 3.0
## Requirements
You need Elasticsearch for storing and searching your data and Kibana for visualizing and managing it. You can use our hosted Elasticsearch Service on Elastic Cloud, which is recommended, or self-manage the Elastic Stack on your own hardware.
## Setup
### Prerequisites
Enable StatsD metrics in Airflow and point them at the OpenTelemetry Collector. In your `airflow.cfg` or via environment variables:
```ini
[metrics]
statsd_on = True
statsd_host =
statsd_port = 8125
statsd_prefix = airflow
```
Set `statsd_host` to the hostname or IP of the machine running the collector where the StatsD receiver listens (default port 8125). For tagged metrics (recommended for dashboards and alerts), enable Datadog or InfluxDB-style tags in Airflow:
```ini
[metrics]
statsd_datadog_enabled = True
# or
statsd_influxdb_enabled = True
```
Install the StatsD extra if needed: `pip install 'apache-airflow[statsd]'`.
### Configuration
Configure the OpenTelemetry Collector or Elastic Distribution of OpenTelemetry Collector (EDOT) to receive StatsD metrics from Airflow and export them to Elasticsearch. The example below shows a minimal pipeline.
Placeholder table:
| Placeholder | Description | Example |
|--------------------------------|-------------------------------------------------------------|------------------------------------------------------------|
| `` | Elasticsearch URL | `https://my-deployment.es.us-central1.gcp.cloud.es.io:443` |
| `${env:ELASTICSEARCH_API_KEY}` | Elasticsearch API key for authentication (from environment) | Set `ELASTICSEARCH_API_KEY` in your environment |
```yaml
receivers:
statsd:
endpoint: 0.0.0.0:8125
transport: udp
processors:
resource/dataset:
attributes:
- key: data_stream.dataset
value: airflow
action: upsert
batch:
timeout: 10s
send_batch_size: 1024
exporters:
elasticsearch/otel:
endpoints: []
api_key: ${env:ELASTICSEARCH_API_KEY}
mapping:
mode: otel
metrics_dynamic_index:
enabled: true
service:
pipelines:
metrics:
receivers: [statsd]
processors: [resource/dataset, batch]
exporters: [elasticsearch/otel]
```
## Reference
### Metrics
Refer to the [metadata.yaml](https://github.com/open-telemetry/opentelemetry-collector-contrib/blob/main/receiver/statsdreceiver/metadata.yaml) of the OpenTelemetry StatsD receiver for details on how StatsD metrics are mapped to OpenTelemetry. Airflow-specific metric names, types, and attributes are documented in the [Apache Airflow Metrics](https://airflow.apache.org/docs/apache-airflow/stable/administration-and-deployment/logging-monitoring/metrics.html) documentation.
## Dashboards
| Dashboard | Description |
|-----------------------------------------|--------------------------------------------------------------------------------------|
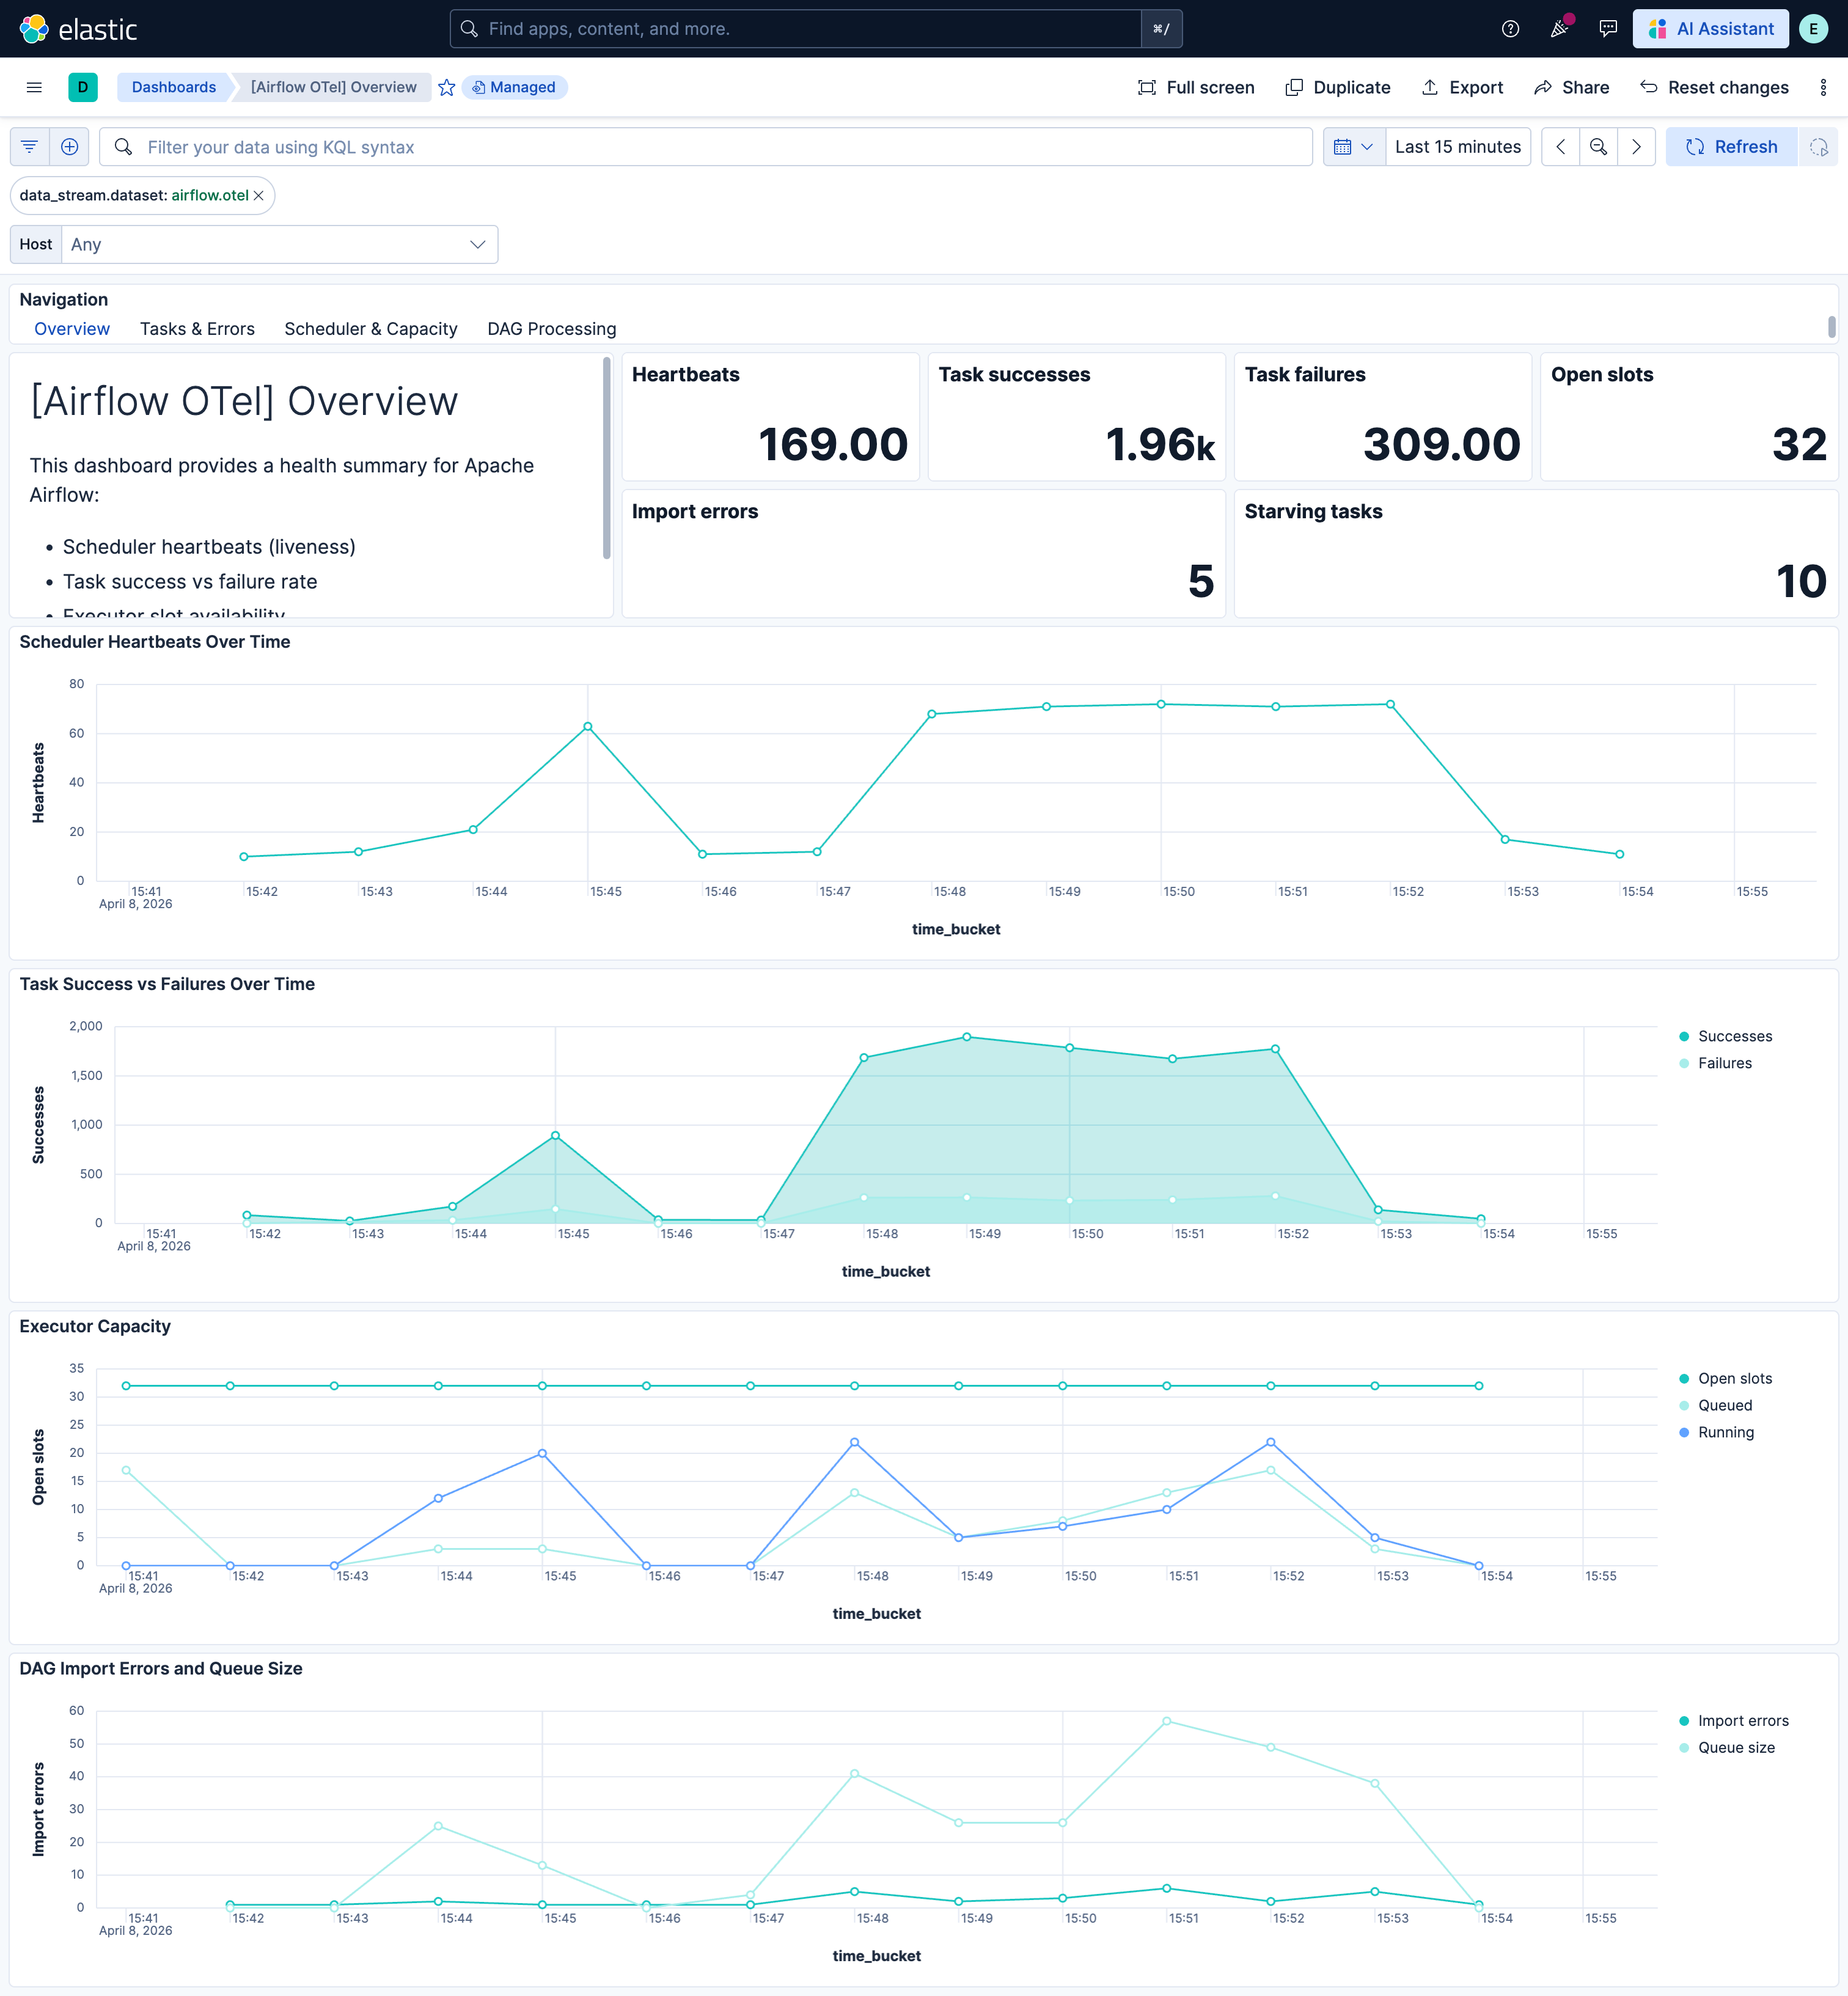
| **[Airflow OTel] Overview** | Scheduler health, task outcomes, executor capacity, and DAG processing at a glance. |
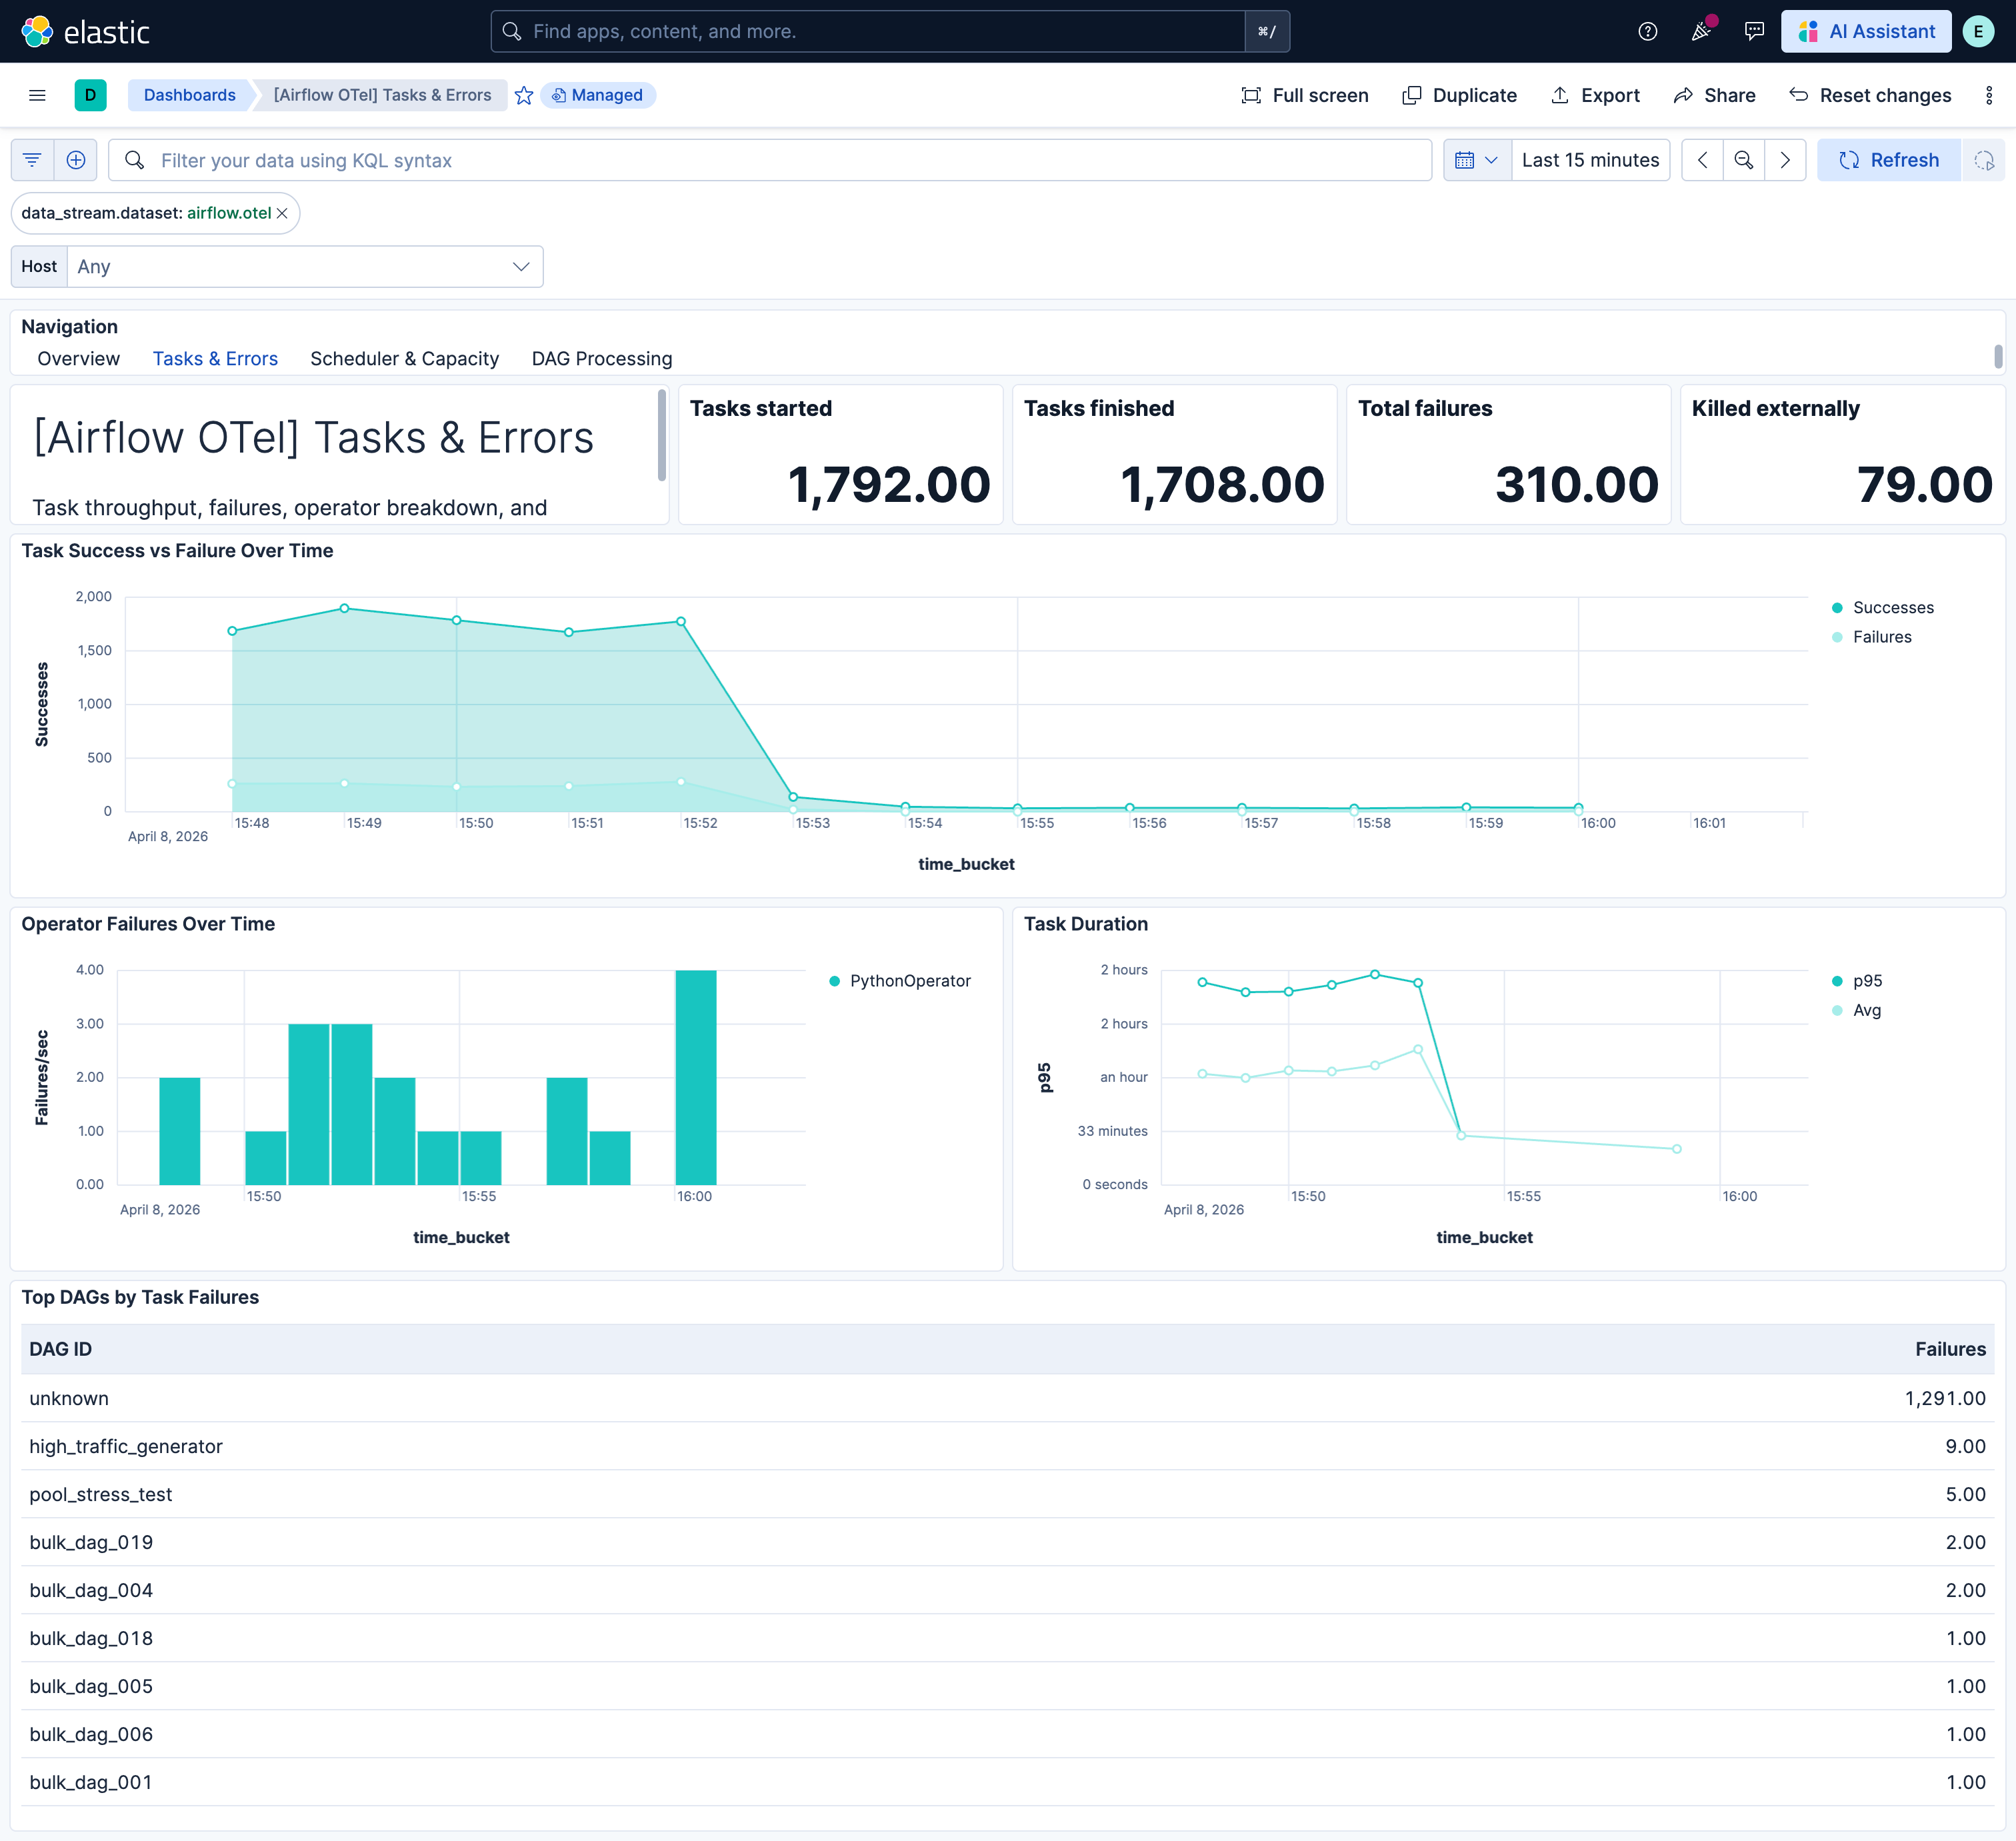
| **[Airflow OTel] Tasks & Errors** | Task throughput, failure rate, operator breakdown, and duration metrics. |
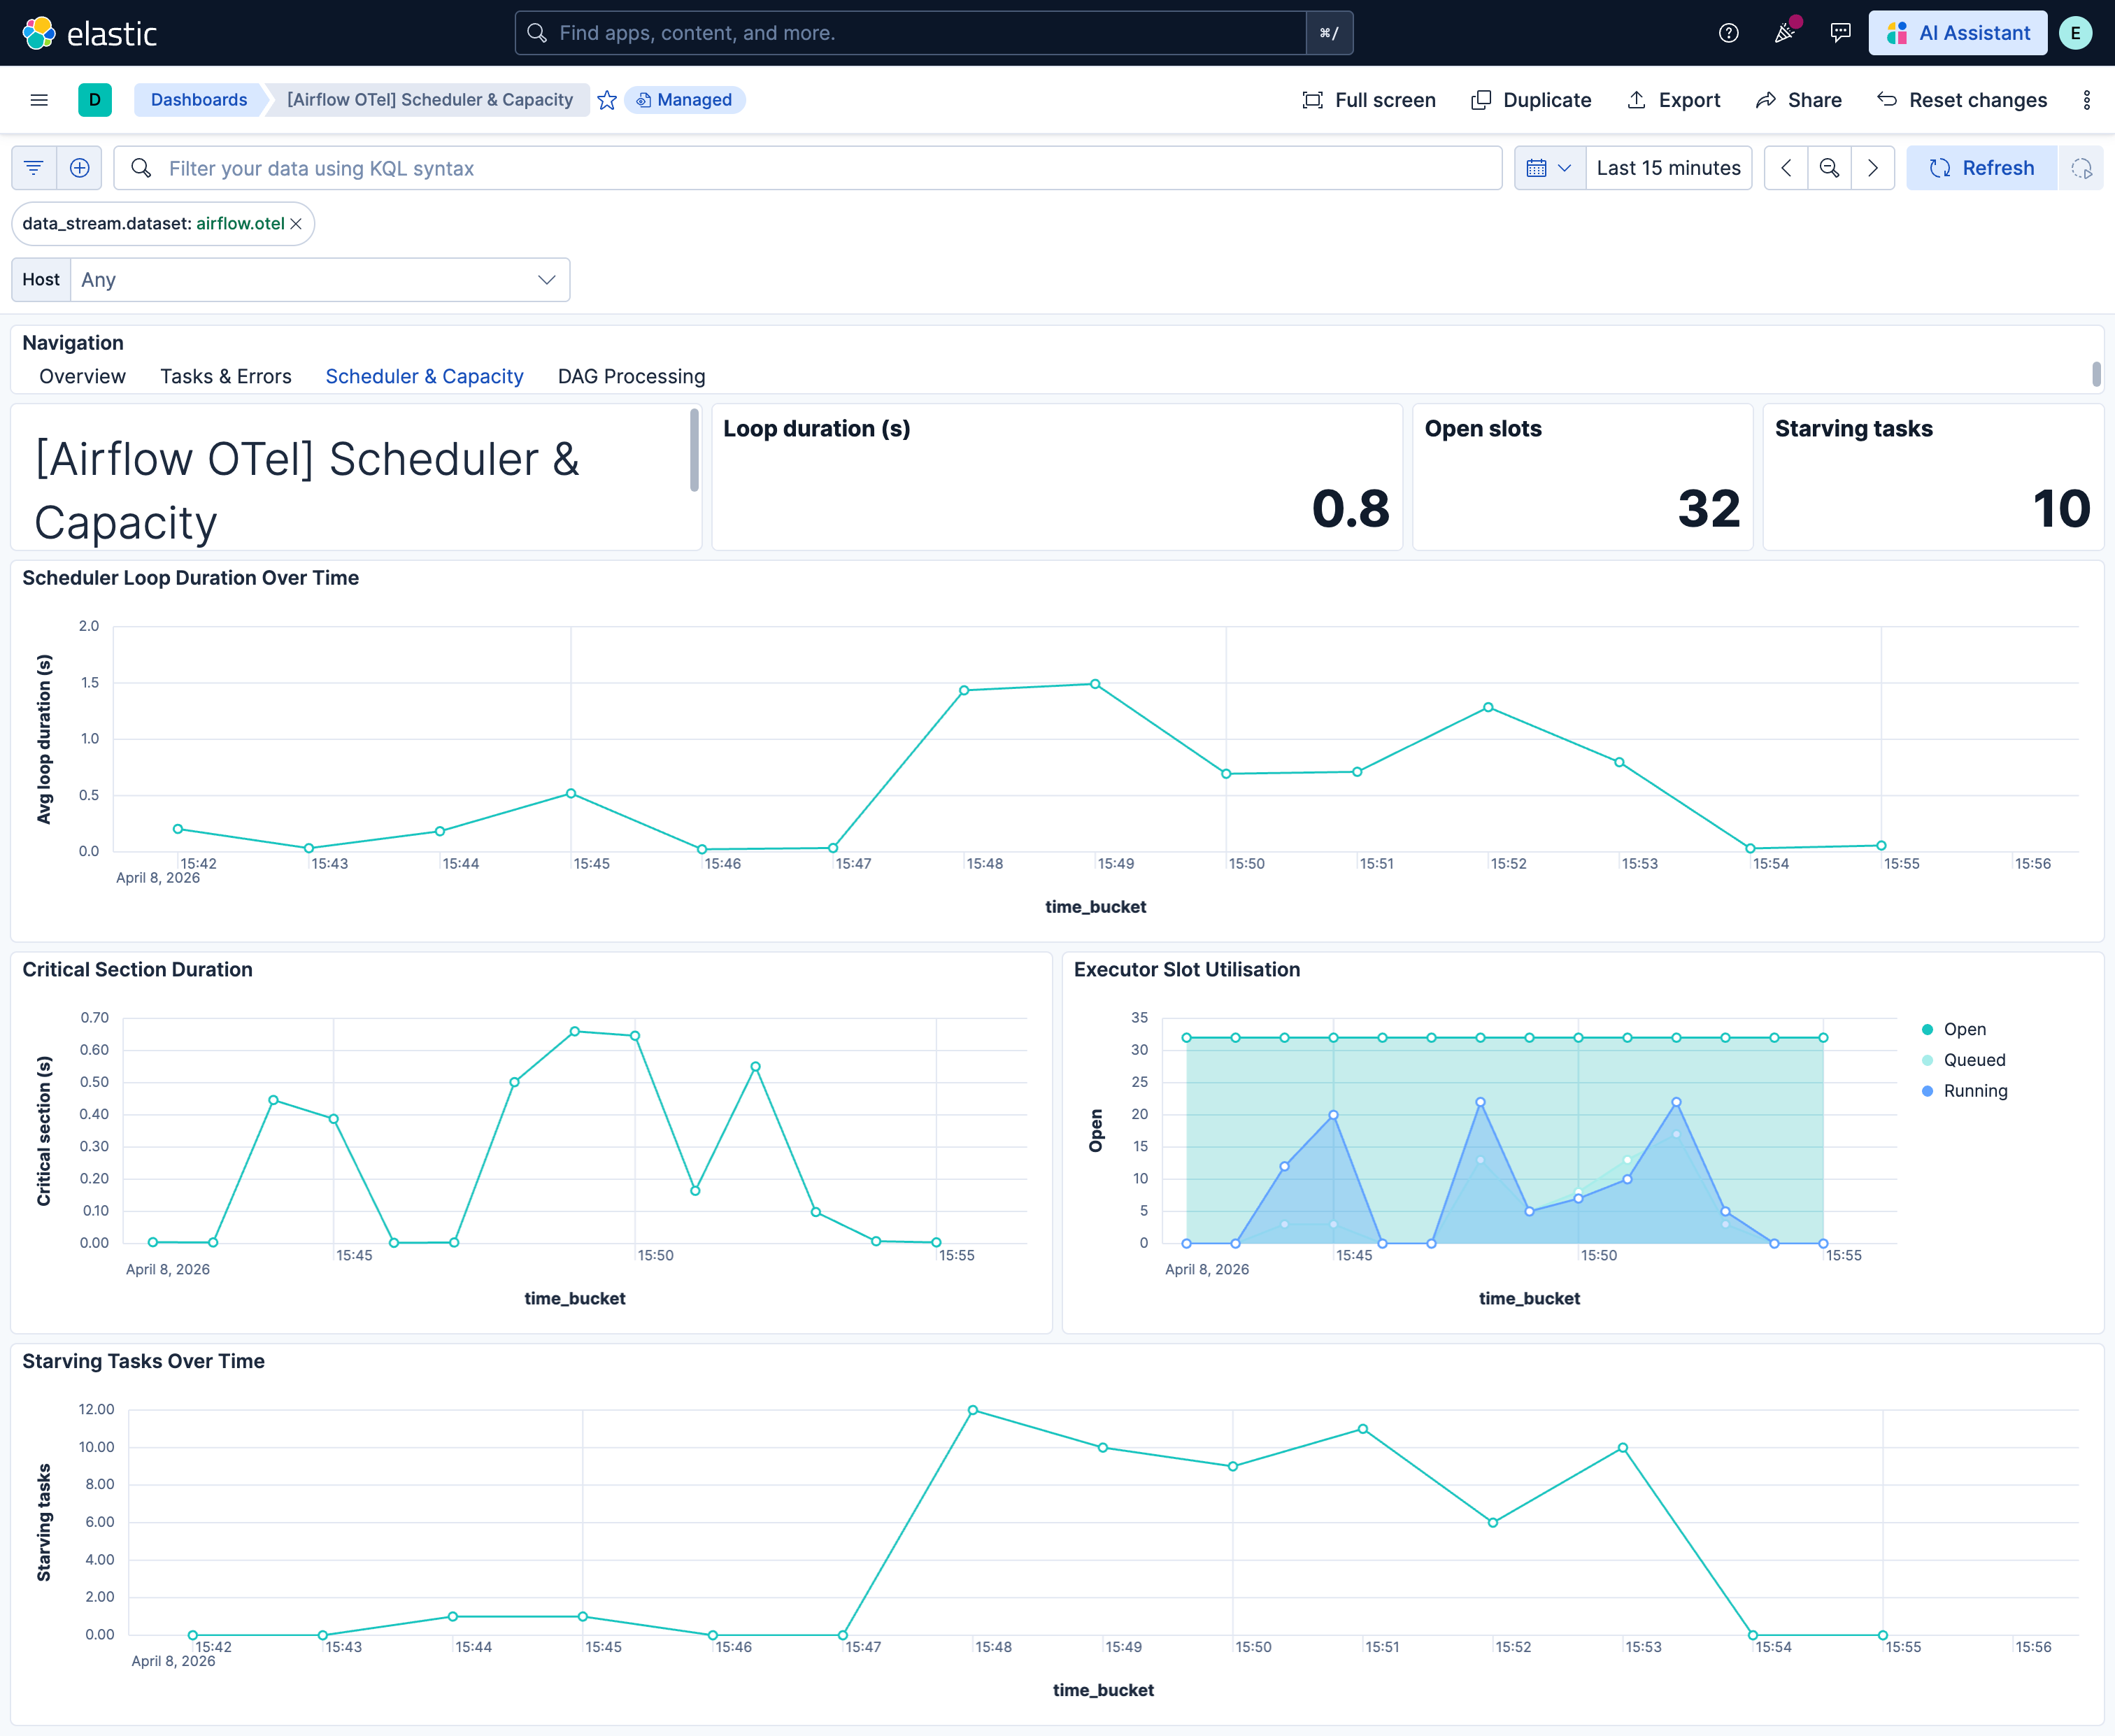
| **[Airflow OTel] Scheduler & Capacity** | Scheduler loop duration, critical section contention, executor and pool utilization. |
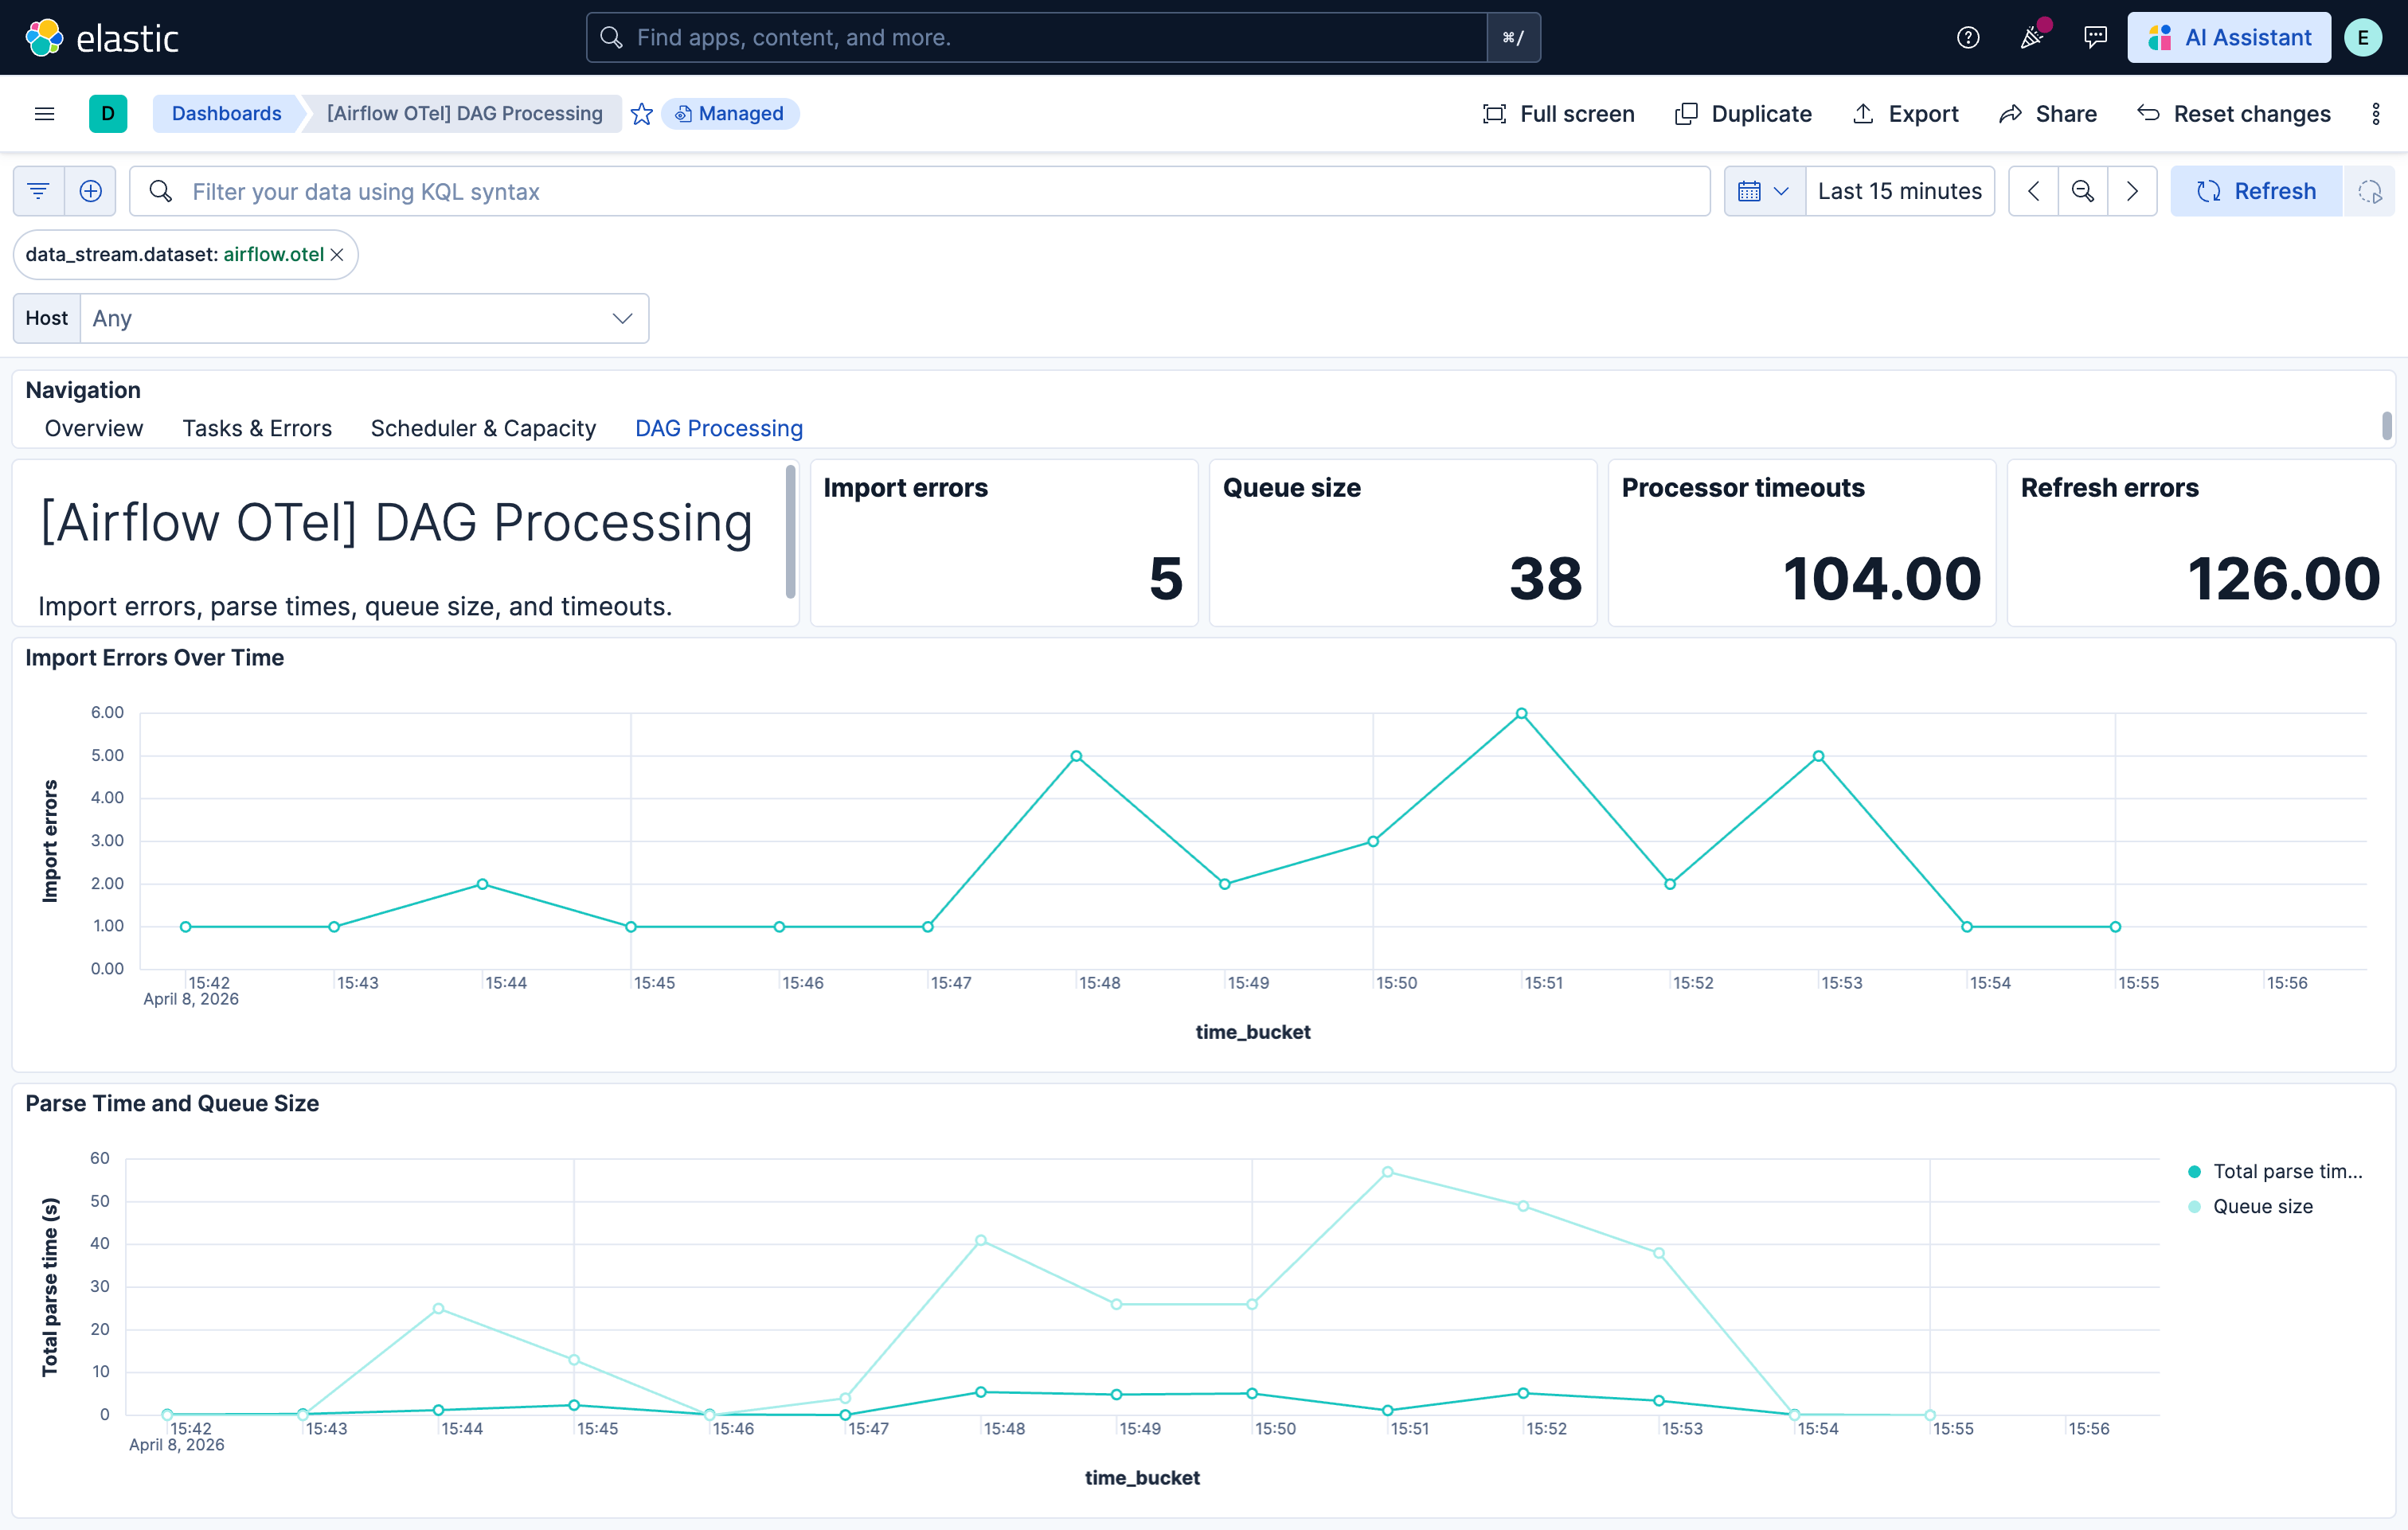
| **[Airflow OTel] DAG Processing** | DAG file import errors, parse times, queue size, and processor timeouts. |
## Alert rules
| Alert | Trigger | Severity |
|--------------------------------------------------------|------------------------------------------------------------|----------|
| **[Airflow OTel] Scheduler heartbeats critically low** | No scheduler heartbeats received in the evaluation window. | Critical |
| **[Airflow OTel] Executor open slots exhausted** | Executor open slots are zero on at least one host. | Critical |
| **[Airflow OTel] Scheduler job heartbeat failures** | SchedulerJob heartbeat failure count is non-zero. | High |
| **[Airflow OTel] Task failures above threshold** | One or more task instance failures observed. | High |
| **[Airflow OTel] Tasks killed externally** | Tasks killed by external processes (OOM, eviction). | High |
| **[Airflow OTel] DAG import errors present** | DAG import errors are non-zero. | High |
| **[Airflow OTel] DAG processor timeouts** | DAG processor timeouts detected. | High |
| **[Airflow OTel] DAG run schedule delay high** | DAG run schedule delay exceeds 5 minutes. | Medium |
| **[Airflow OTel] Scheduler loop duration excessive** | Scheduler loop duration exceeds 60 seconds. | Medium |
| **[Airflow OTel] Tasks starving due to pool limits** | Starving tasks (blocked by pool limits) exceed threshold. | Medium |
| **[Airflow OTel] DAG file processing queue large** | DAG file processing queue size exceeds 50. | Medium |
## SLO templates
SLO templates require Elastic Stack version 9.4.0 or later.
| SLO | Target | Window | Description |
|------------------------------------------------------------------|--------|----------------|----------------------------------------------------------------------|
| **[Airflow OTel] Task success rate 99.5% rolling 30 days** | 99.5% | 30-day rolling | Proportion of task instances that complete successfully vs failures. |
| **[Airflow OTel] DAG import errors zero 99.5% rolling 30 days** | 99.5% | 30-day rolling | DAG files parse without import errors. |
| **[Airflow OTel] Scheduler loop duration 99.5% rolling 30 days** | 99.5% | 30-day rolling | Scheduler loop completes within acceptable duration. |
## Screenshots
This integration includes one or more Kibana dashboards that visualizes the data collected by the integration. The screenshots below illustrate how the ingested data is displayed.
## Changelog
| Version | Details | Minimum Kibana version |
|-----------|----------------------------------------------------------------------------------------------------------|------------------------|
| **0.1.0** | **Enhancement** ([View pull request](https://github.com/elastic/integrations/pull/17786))initial release | 9.3.0 |