---
title: Apache Tomcat OpenTelemetry Assets
description: Apache Tomcat is a Java servlet container and web server that implements the Jakarta Servlet, Jakarta Server Pages, and WebSocket specifications, widely...
url: https://docs-v3-preview.elastic.dev/elastic/integration-docs/tree/main/reference/apache_tomcat_otel
products:
- Elastic integrations
applies_to:
- Serverless Observability projects: Generally available
- Serverless Security projects: Generally available
- Elastic Stack: Generally available since 9.2
---
# Apache Tomcat OpenTelemetry Assets
| | |
|-------------------------------------------------------------------------------------------------------------------------------|----------------------------------------------------------------|
| **Version** | 0.1.0 : Beta ([View all](#changelog)) |
| **Subscription level**[What's this?](https://www.elastic.co/subscriptions) | Basic |
| **Developed by**[What's this?](https://docs-v3-preview.elastic.dev/elastic/integration-docs/tree/main/reference/developed-by) | Elastic |
| **Minimum Kibana version(s)** | 9.2.1 |
To use beta integrations, go to the **Integrations** page in Kibana, scroll down, and toggle on the _Display beta integrations_ option.
Apache Tomcat is a Java servlet container and web server that implements the Jakarta Servlet, Jakarta Server Pages, and WebSocket specifications, widely deployed as the runtime for Java web applications.
These assets provide dashboards, alert rules, and SLO templates for monitoring Apache Tomcat via the OpenTelemetry Prometheus receiver scraping a Prometheus JMX Exporter, covering request processing, thread pool and connection management, JVM memory and garbage collection, session lifecycle, and OS-level resource utilization.
## Compatibility
The Apache Tomcat OpenTelemetry assets have been tested with:
- OpenTelemetry `prometheusreceiver` v0.144.0 from OpenTelemetry Collector Contrib.
- Apache Tomcat/9.0.115
## Requirements
You need Elasticsearch for storing and searching your data and Kibana for visualizing and managing it.
You can use our hosted Elasticsearch Service on Elastic Cloud, which is recommended, or self-manage
the Elastic Stack on your own hardware.
## Setup
### Prerequisites
You must attach the [Prometheus JMX Exporter](https://github.com/prometheus/jmx_exporter) Java agent to your Tomcat JVM process. This agent exposes Tomcat's JMX MBeans as Prometheus metrics on an HTTP endpoint (port 9404 by default).
1. Download the JMX Exporter agent JAR:
```bash
curl -L -o jmx_prometheus_javaagent.jar https://repo1.maven.org/maven2/io/prometheus/jmx/jmx_prometheus_javaagent/1.0.1/jmx_prometheus_javaagent-1.0.1.jar
```
1. Create a JMX Exporter configuration file (`jmx_exporter_config.yaml`). A minimal configuration that exposes all Catalina and JVM MBeans:
```yaml
rules:
- pattern: ".*"
```
1. Add the agent to your Tomcat startup by setting `CATALINA_OPTS` in `setenv.sh` (or equivalent):
```bash
export CATALINA_OPTS="$CATALINA_OPTS -javaagent:/path/to/jmx_prometheus_javaagent.jar=9404:/path/to/jmx_exporter_config.yaml"
```
1. Verify the metrics endpoint is accessible:
```bash
curl http://localhost:9404/metrics
```
You should see Prometheus-formatted metrics including `Catalina_*` and `java_lang_*` prefixed lines.
### Configuration
Configure your OpenTelemetry Collector (or EDOT Collector) with the following configuration to scrape Tomcat JMX Exporter metrics and export them to Elasticsearch.
Placeholders:
- `` — Hostname or IP address of the Tomcat instance running the JMX Exporter (e.g. `localhost`)
- `` — Port the JMX Exporter is listening on (e.g. `9404`)
- `` — Your Elasticsearch endpoint URL (e.g. `https://my-deployment.es.us-central1.gcp.cloud.es.io:443`)
- `${env:ES_API_KEY}` — Elasticsearch API key, set via the `ES_API_KEY` environment variable
```yaml
receivers:
prometheus/tomcat:
config:
scrape_configs:
- job_name: "tomcat"
scrape_interval: 10s
metrics_path: /metrics
params:
format: [prometheus]
scheme: http
static_configs:
- targets: [":"]
processors:
resource/dataset:
attributes:
- key: data_stream.dataset
value: tomcat
action: upsert
exporters:
elasticsearch/otel:
endpoint:
api_key: ${env:ES_API_KEY}
mapping:
mode: otel
logs_dynamic_index:
enabled: true
metrics_dynamic_index:
enabled: true
service:
pipelines:
metrics:
receivers: [prometheus/tomcat]
processors: [resource/dataset]
exporters: [elasticsearch/otel]
```
## Reference
### Metrics
Refer to the [Prometheus receiver](https://github.com/open-telemetry/opentelemetry-collector-contrib/blob/main/receiver/prometheusreceiver/README.md) documentation for details on the receiver configuration. The available Tomcat metrics are defined by the [Prometheus JMX Exporter](https://github.com/prometheus/jmx_exporter) configuration and the JMX MBeans exposed by your Tomcat instance, including `Catalina_*` (request processing, thread pools, sessions, servlets) and `java_lang_*` (JVM memory, garbage collection, threading, OS resources) metric families.
## Dashboards
| Dashboard | Description |
|---------------------------------------------|--------------------------------------------------------------------------------------------------------------------------------------------------------|
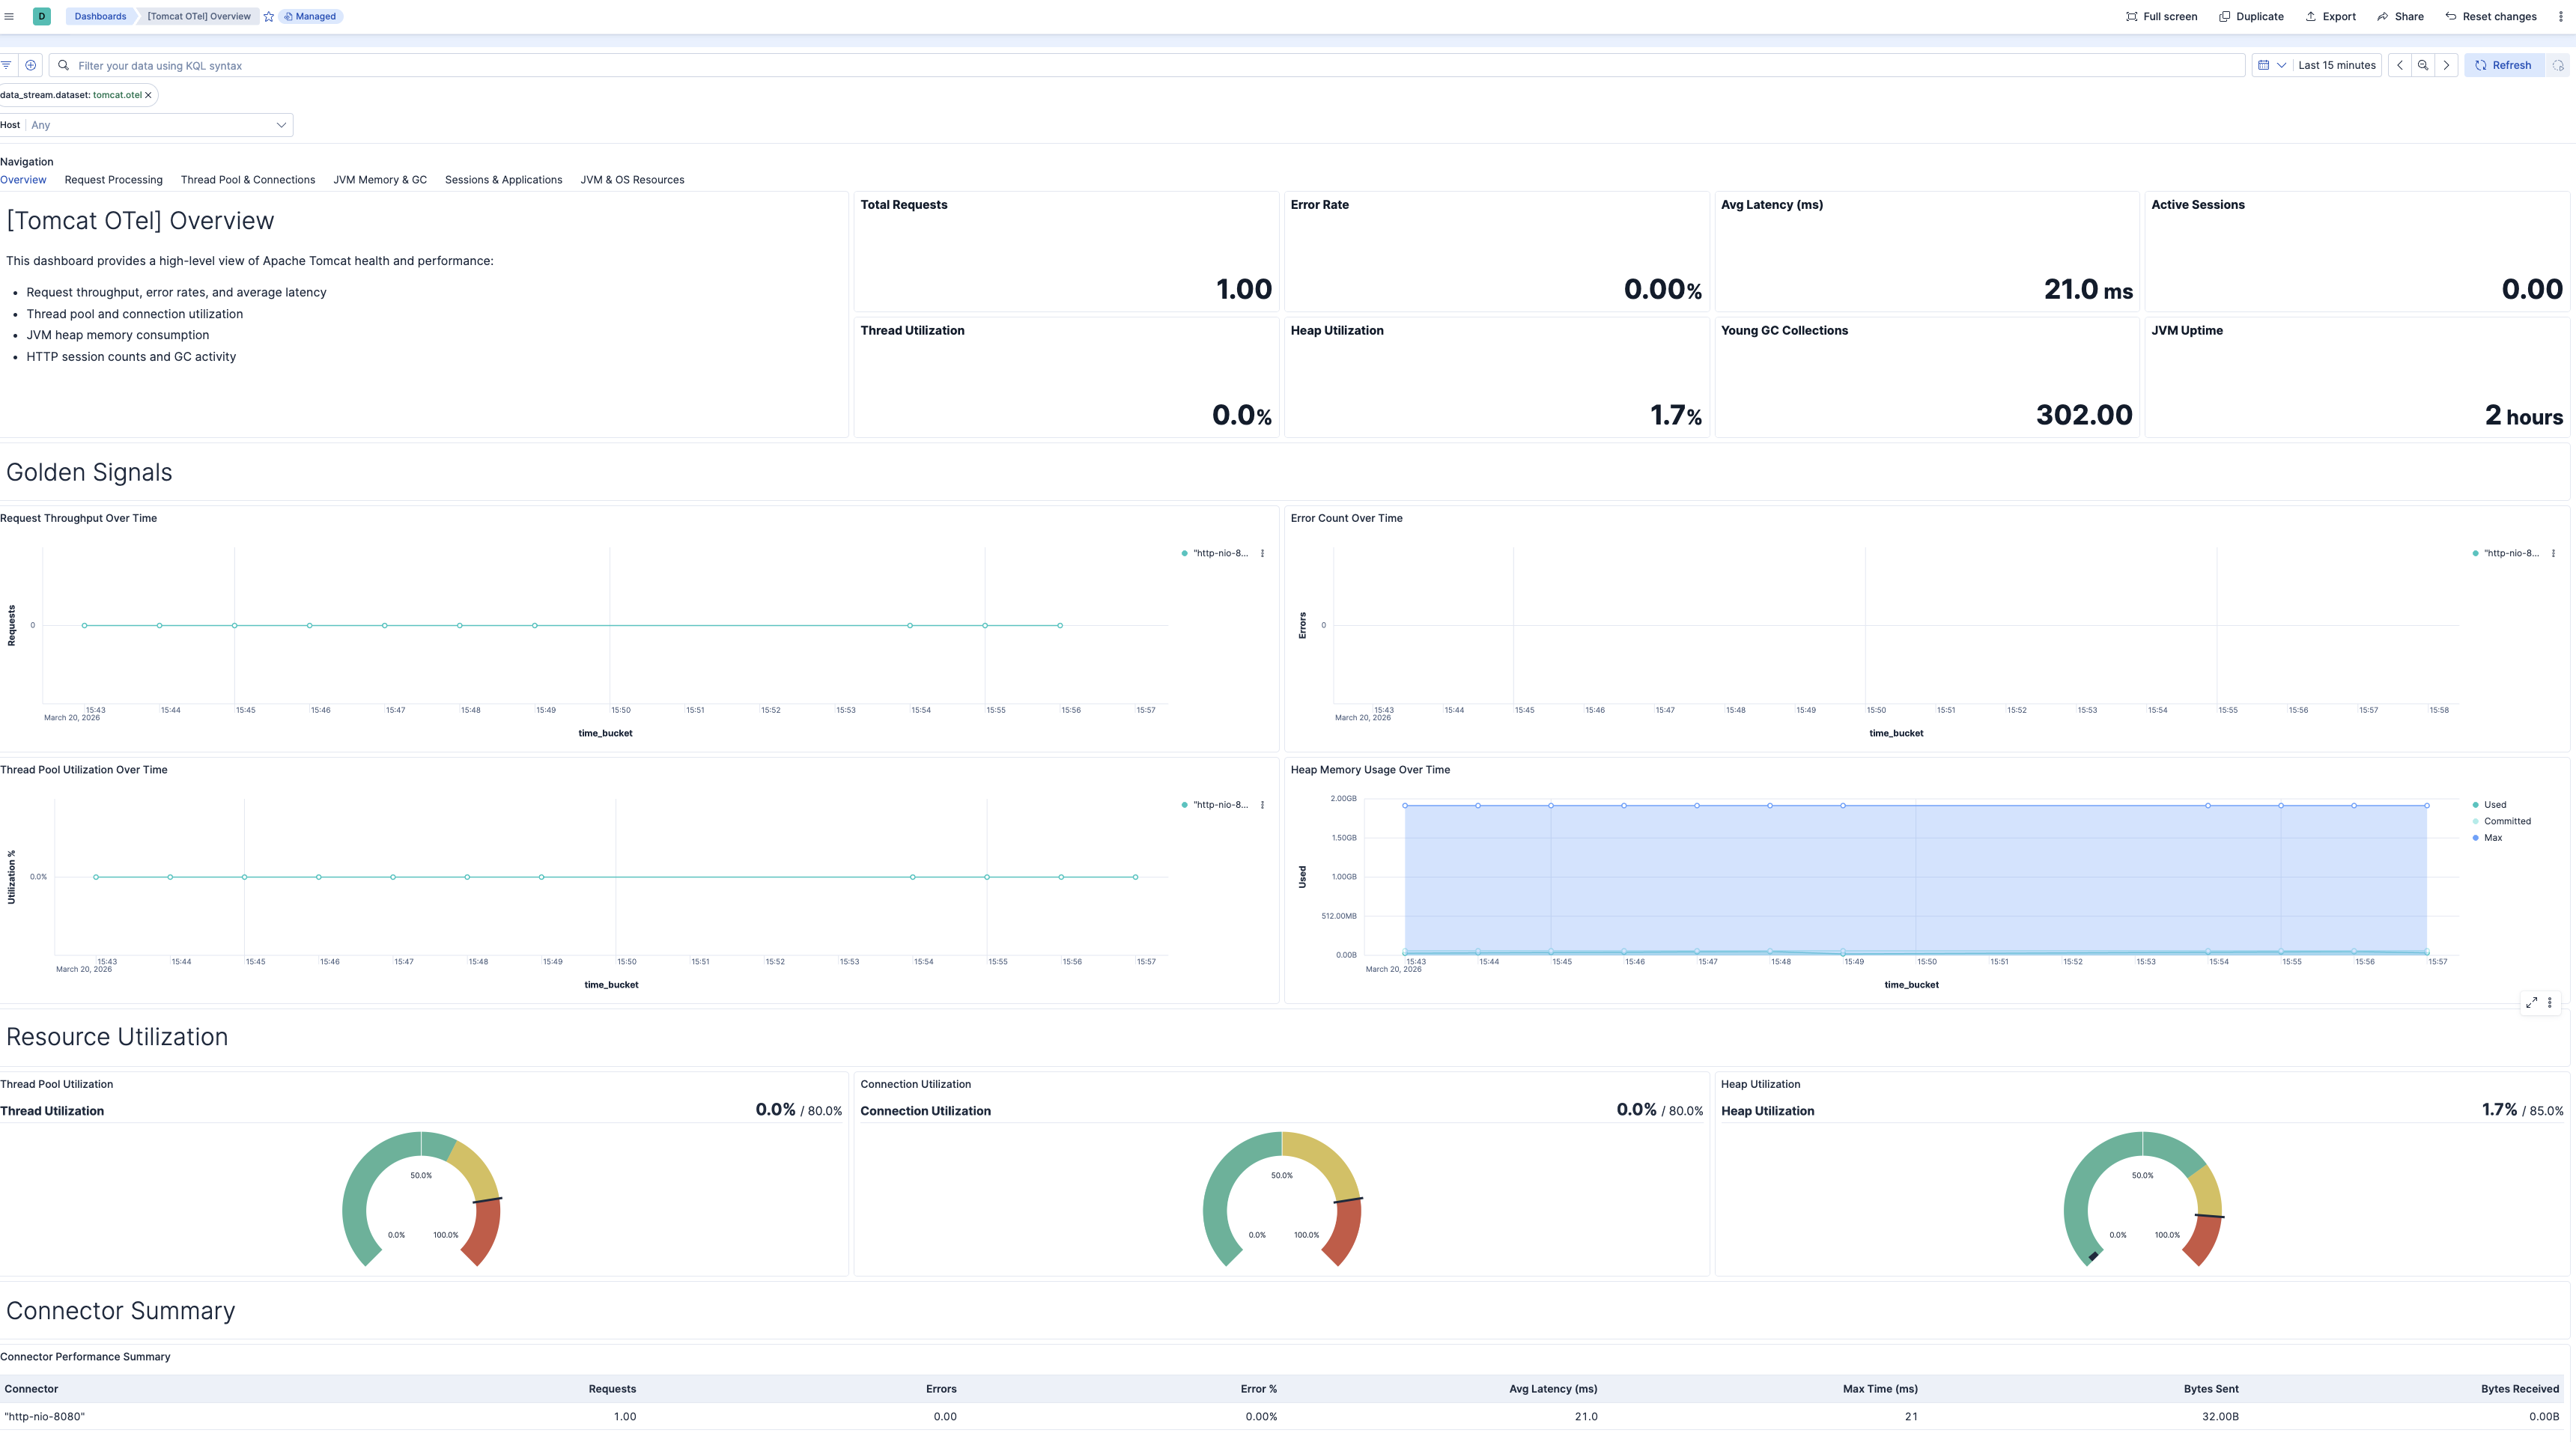
| **[Tomcat OTel] Overview** | High-level health and performance overview covering golden signals: latency, traffic, errors, and saturation. |
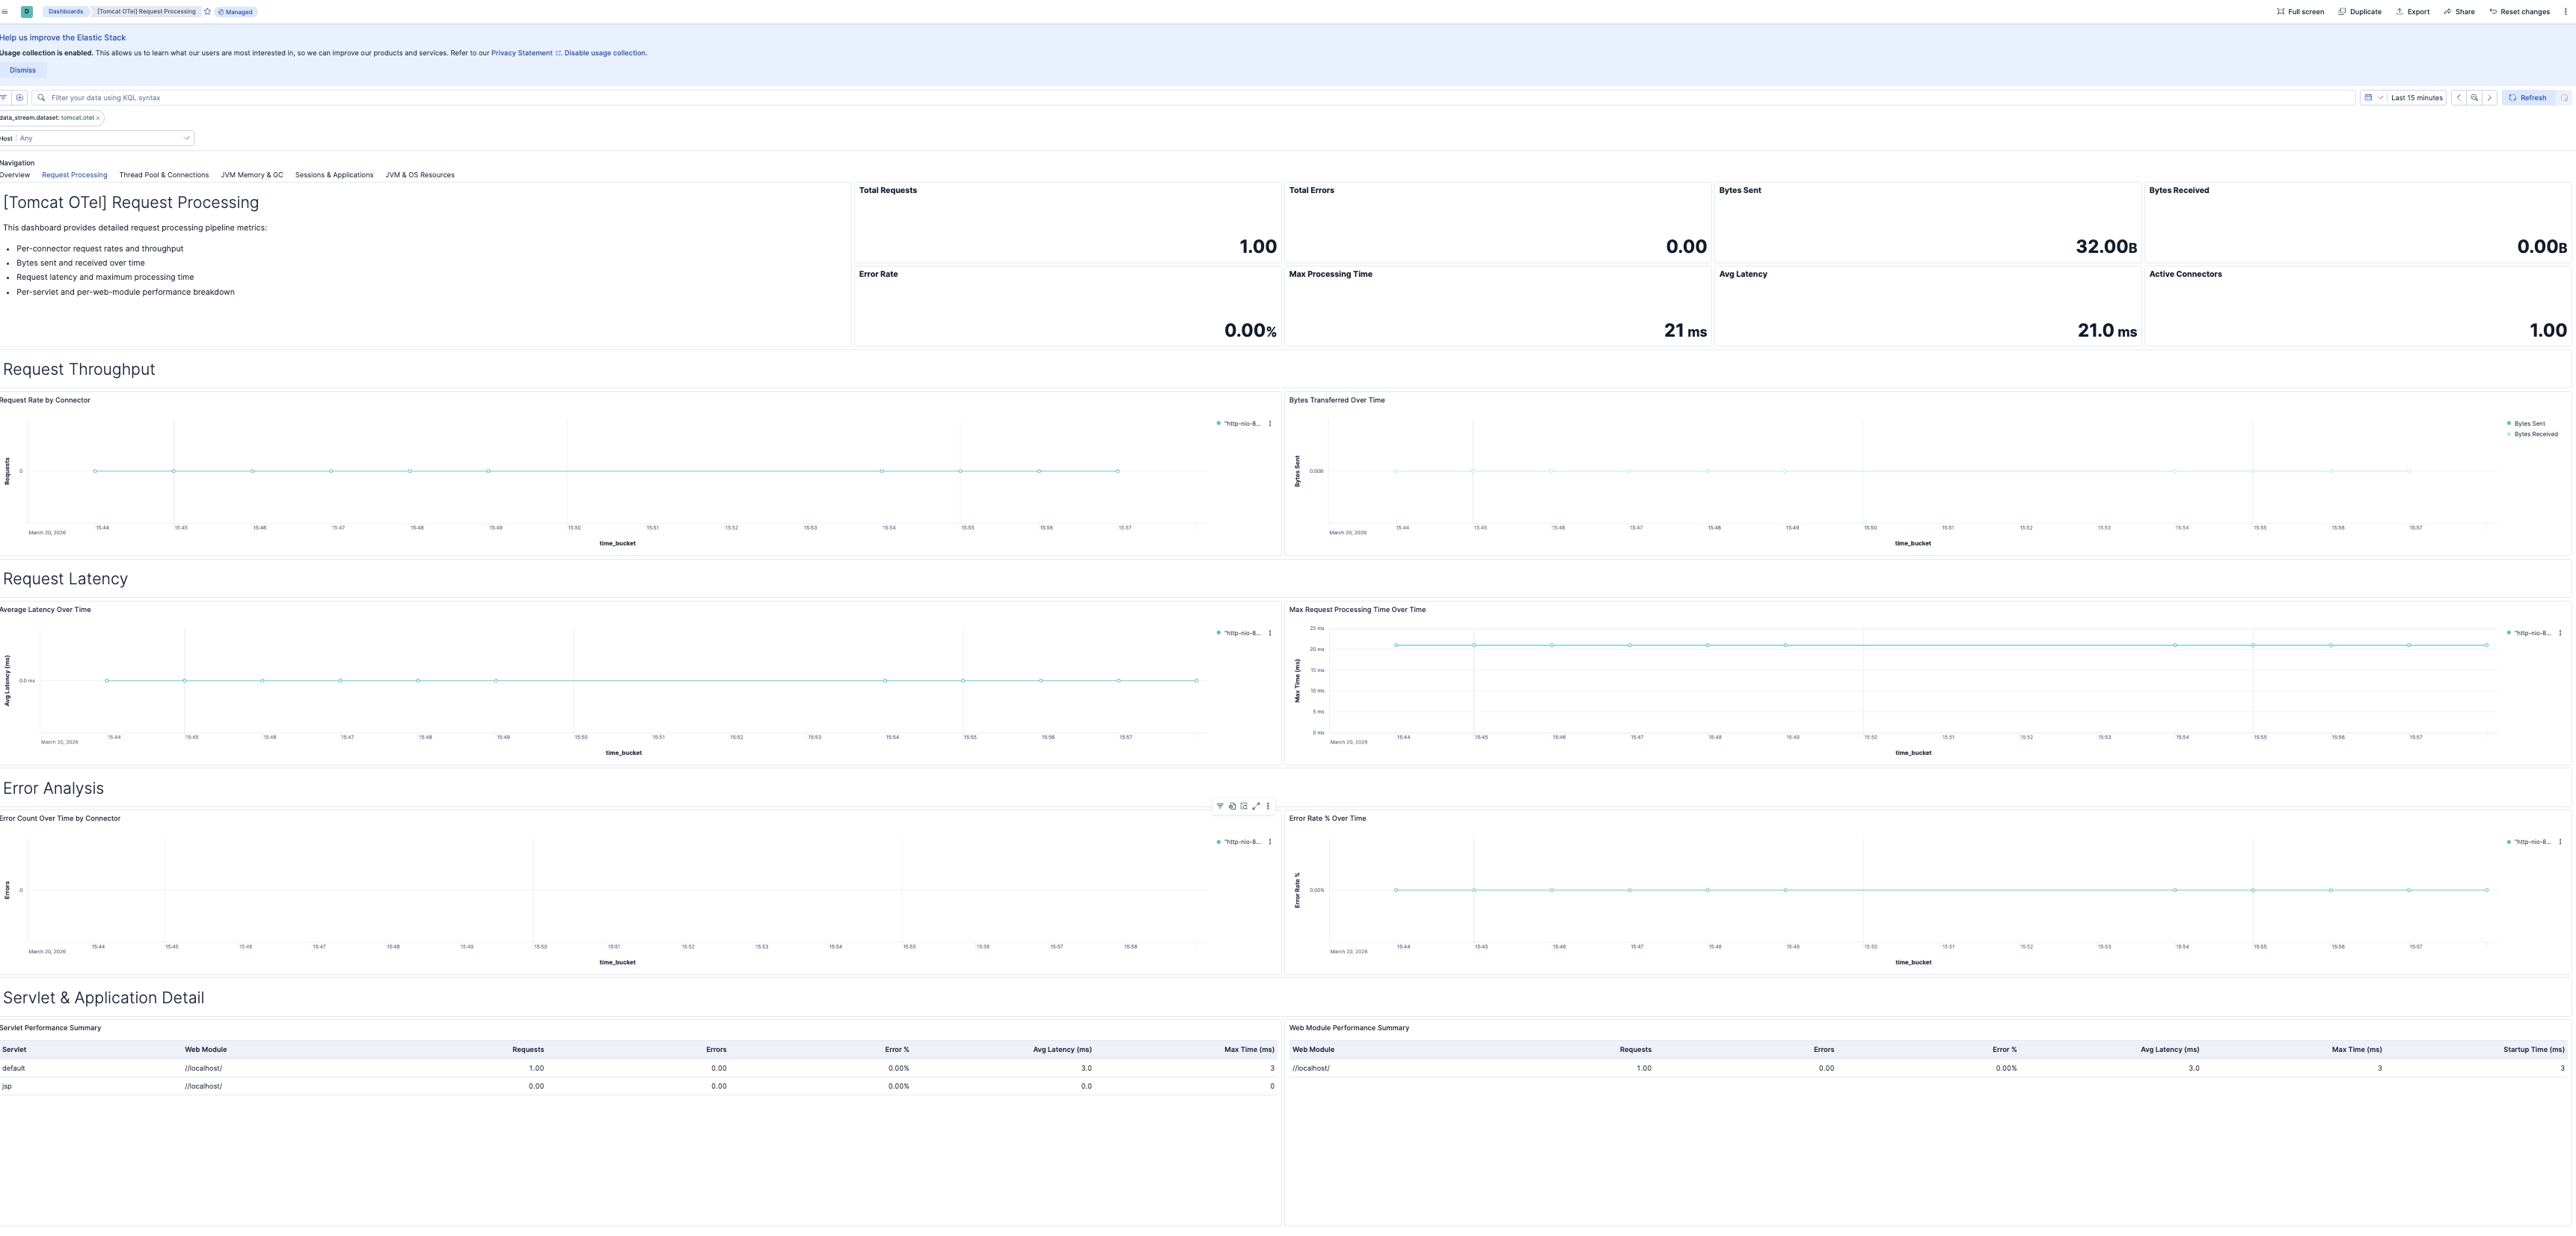
| **[Tomcat OTel] Request Processing** | Detailed request processing pipeline metrics including per-connector throughput, latency, error rates, and per-servlet performance. |
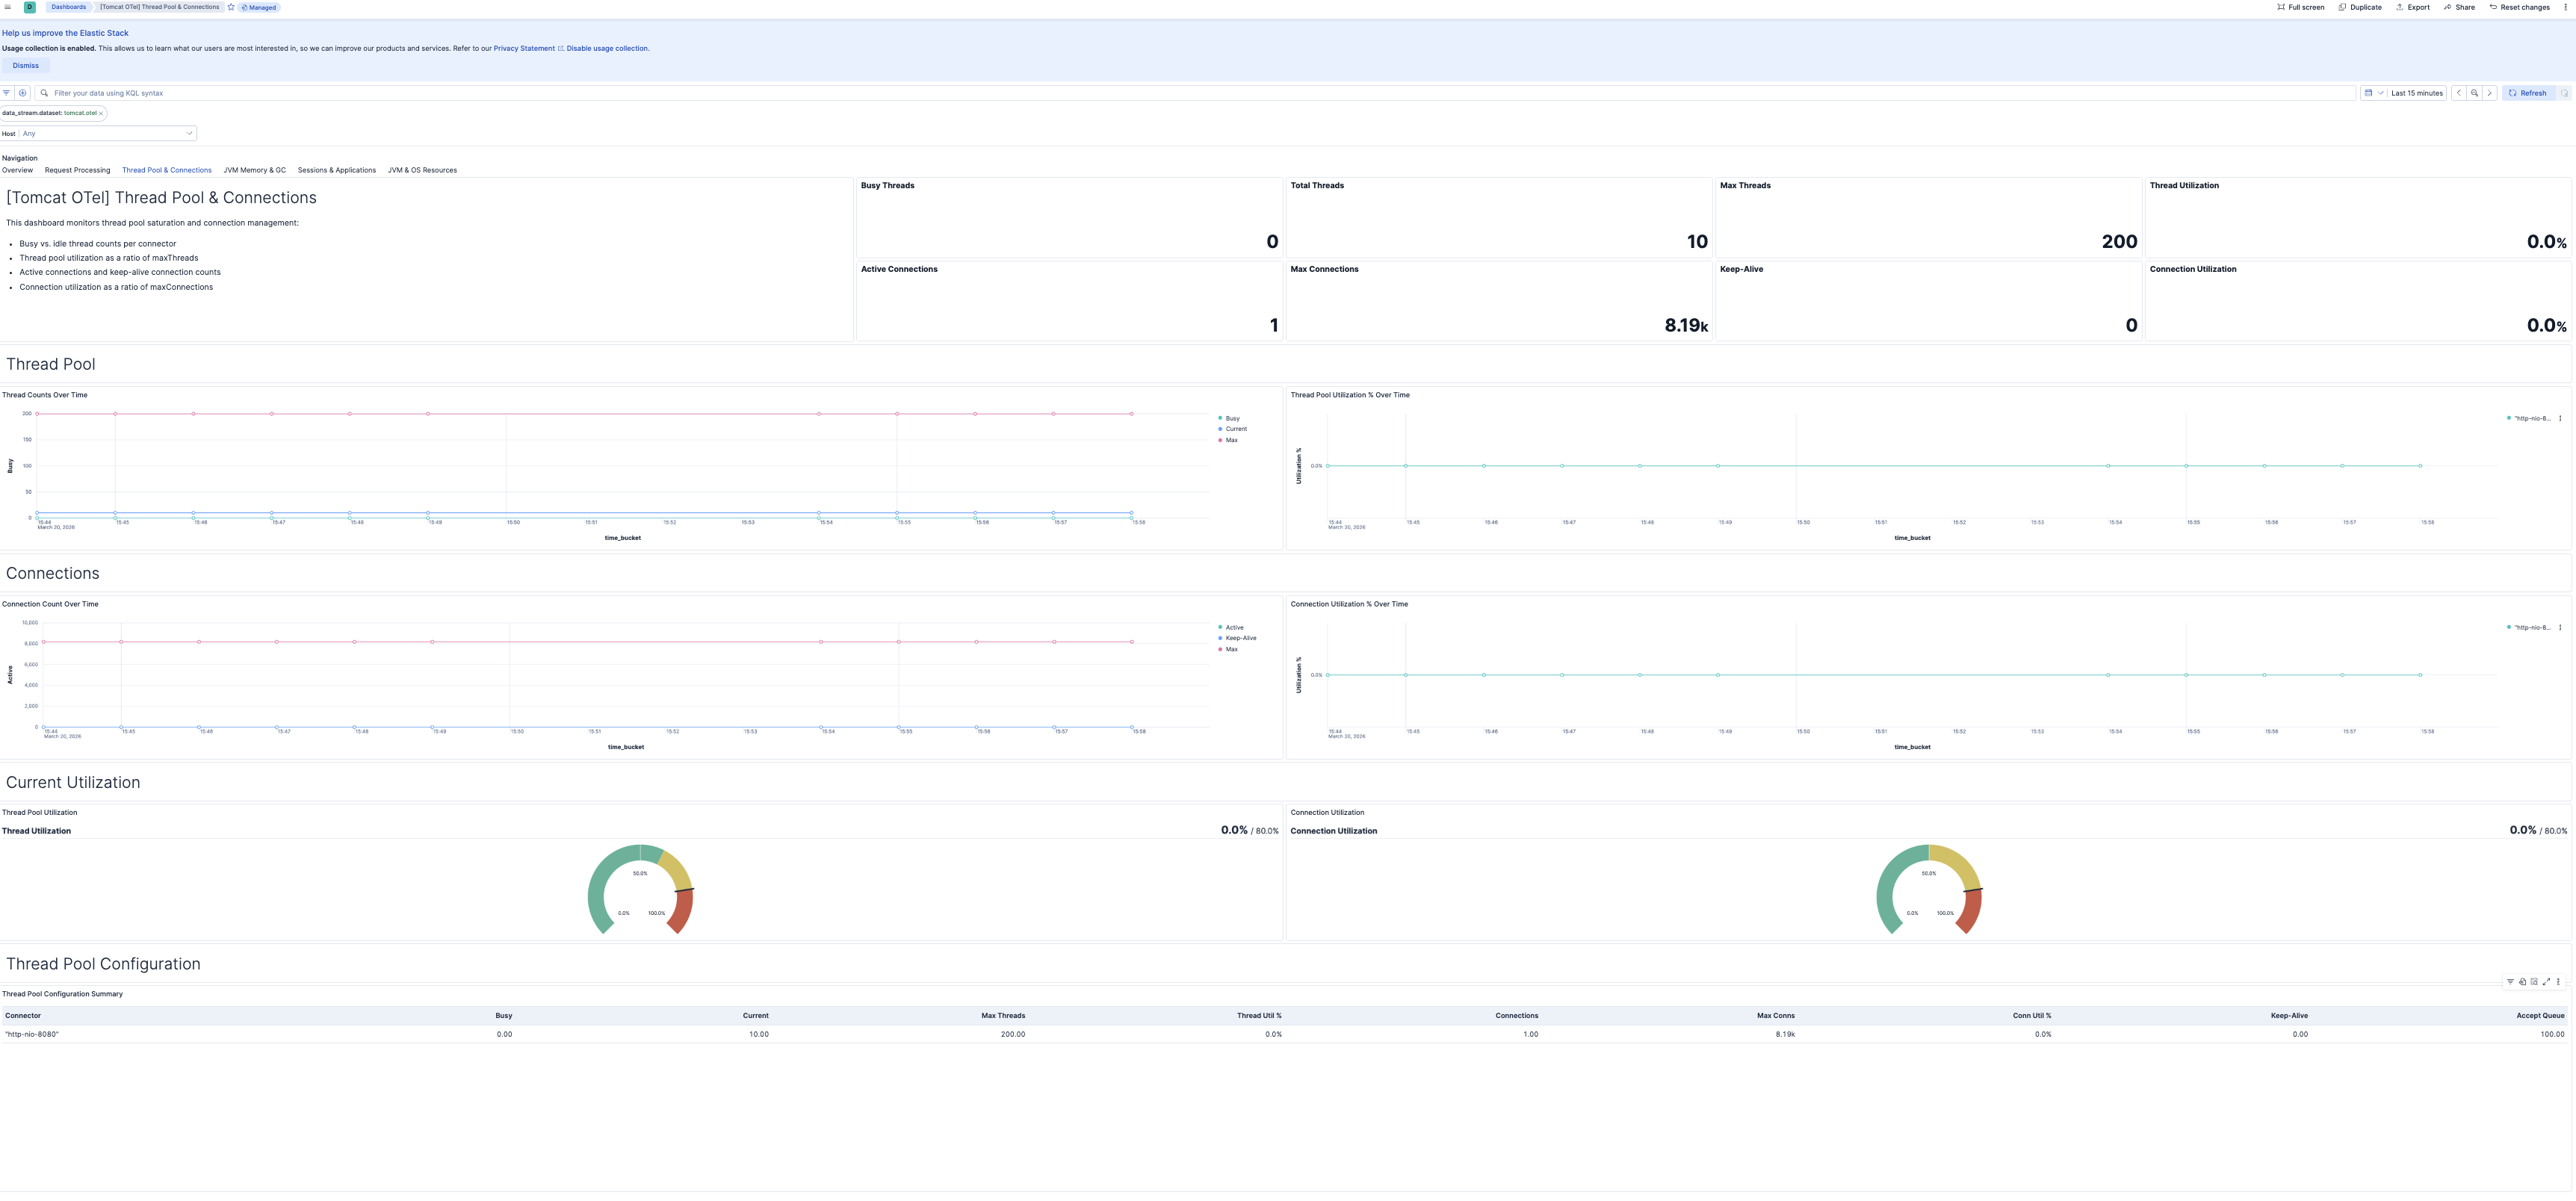
| **[Tomcat OTel] Thread Pool & Connections** | Thread pool saturation and connection management for connectors, including utilization ratios and capacity limits. |
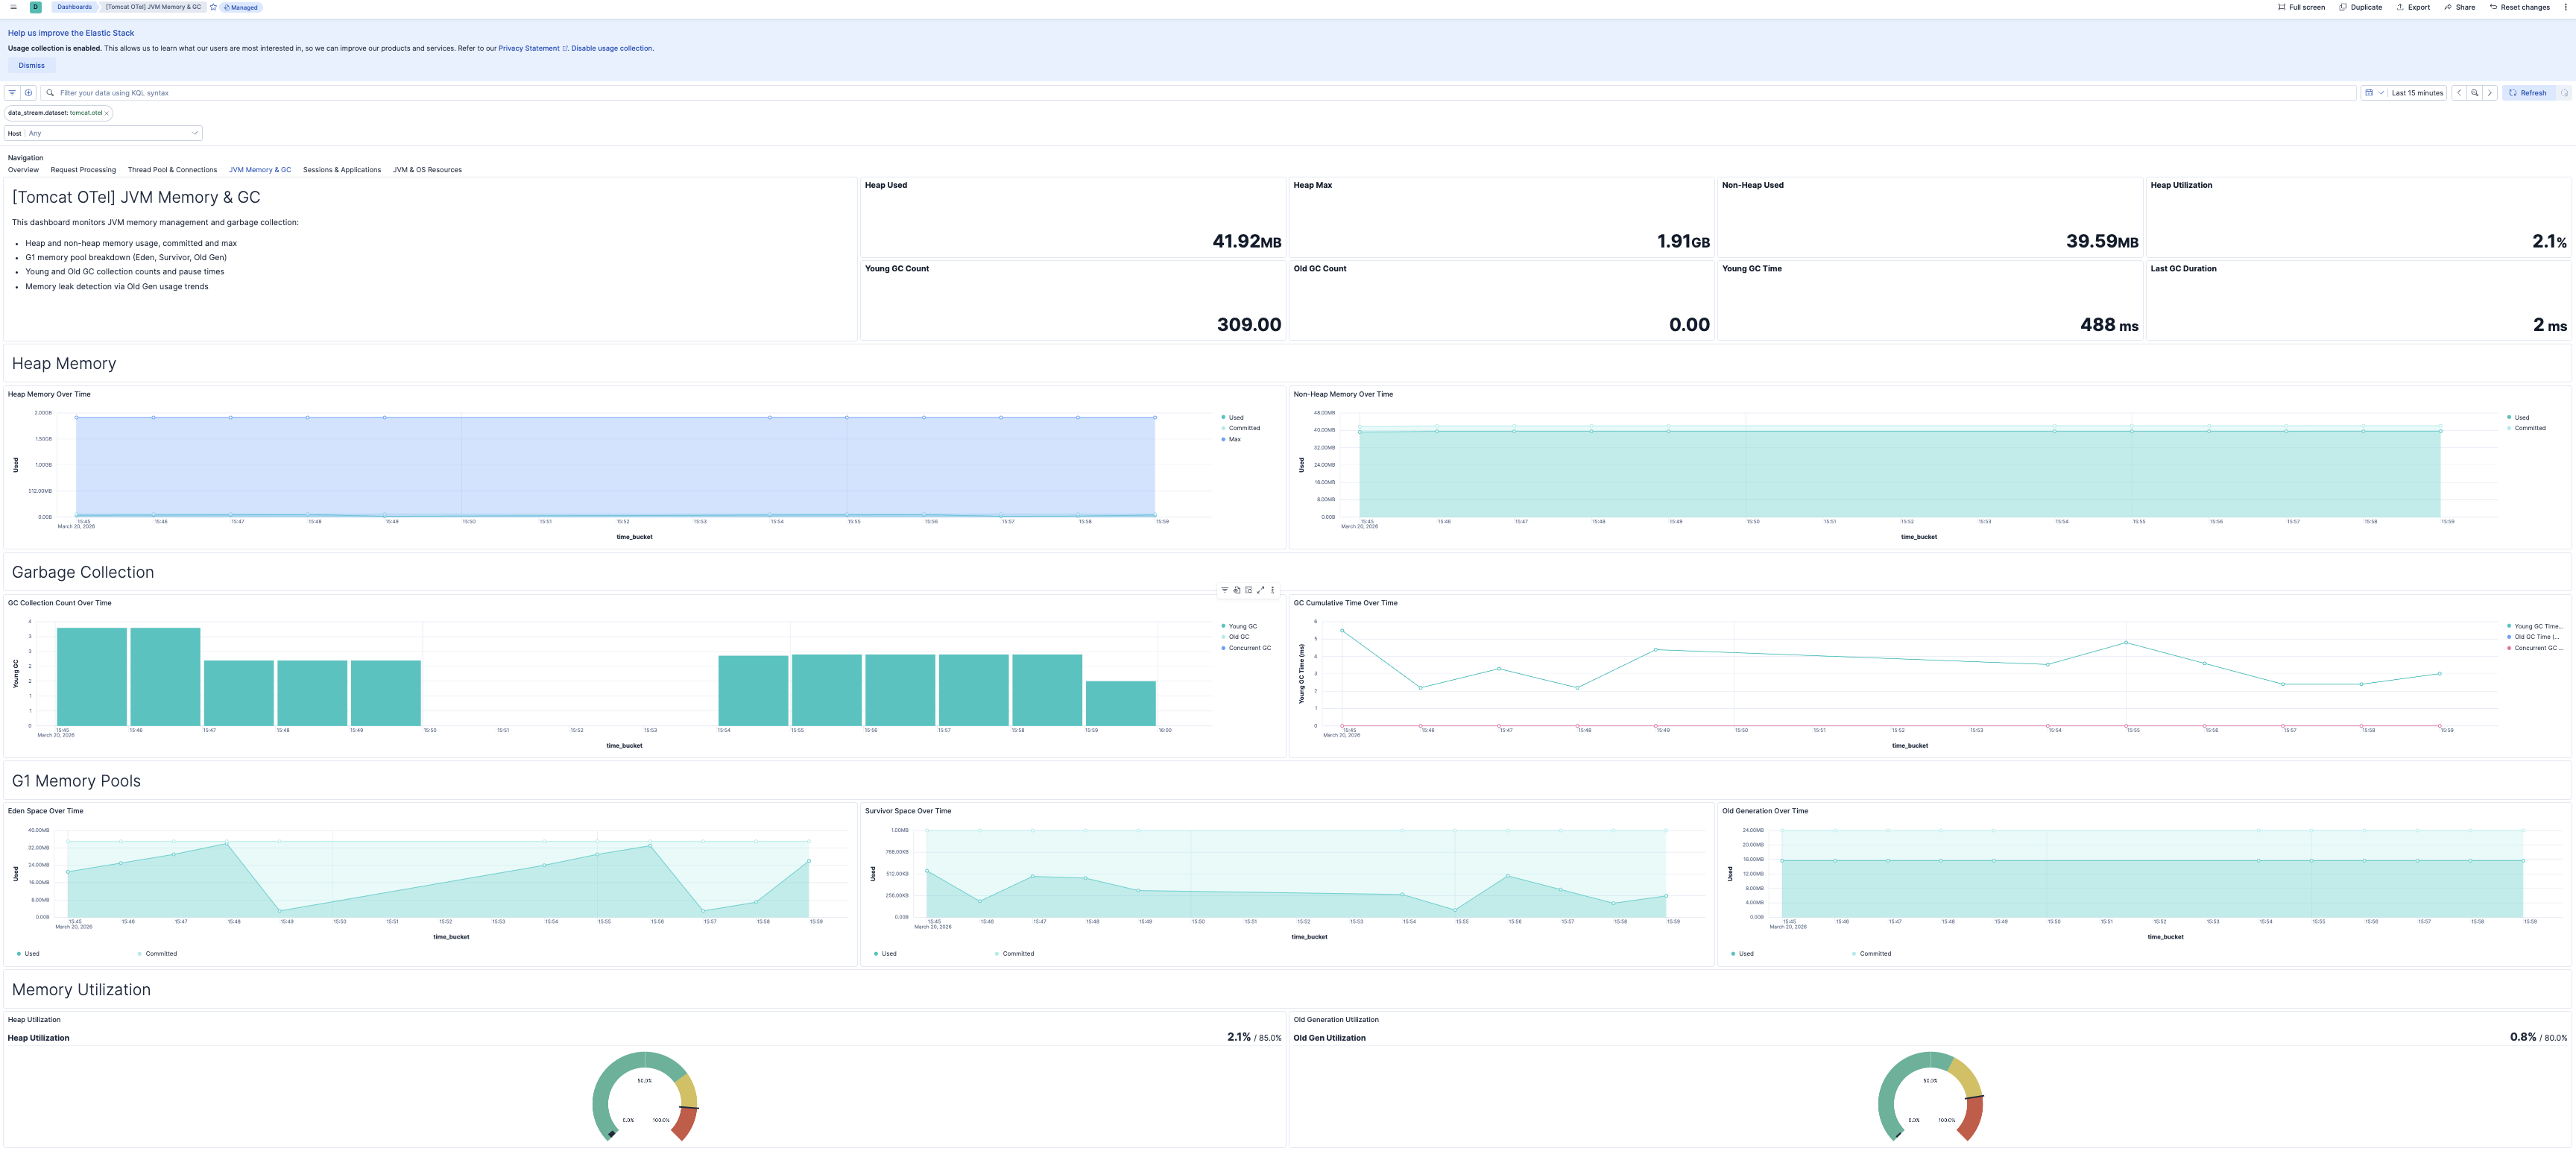
| **[Tomcat OTel] JVM Memory & GC** | JVM memory management and garbage collection monitoring, including heap/non-heap usage, G1 memory pools, and GC activity. |
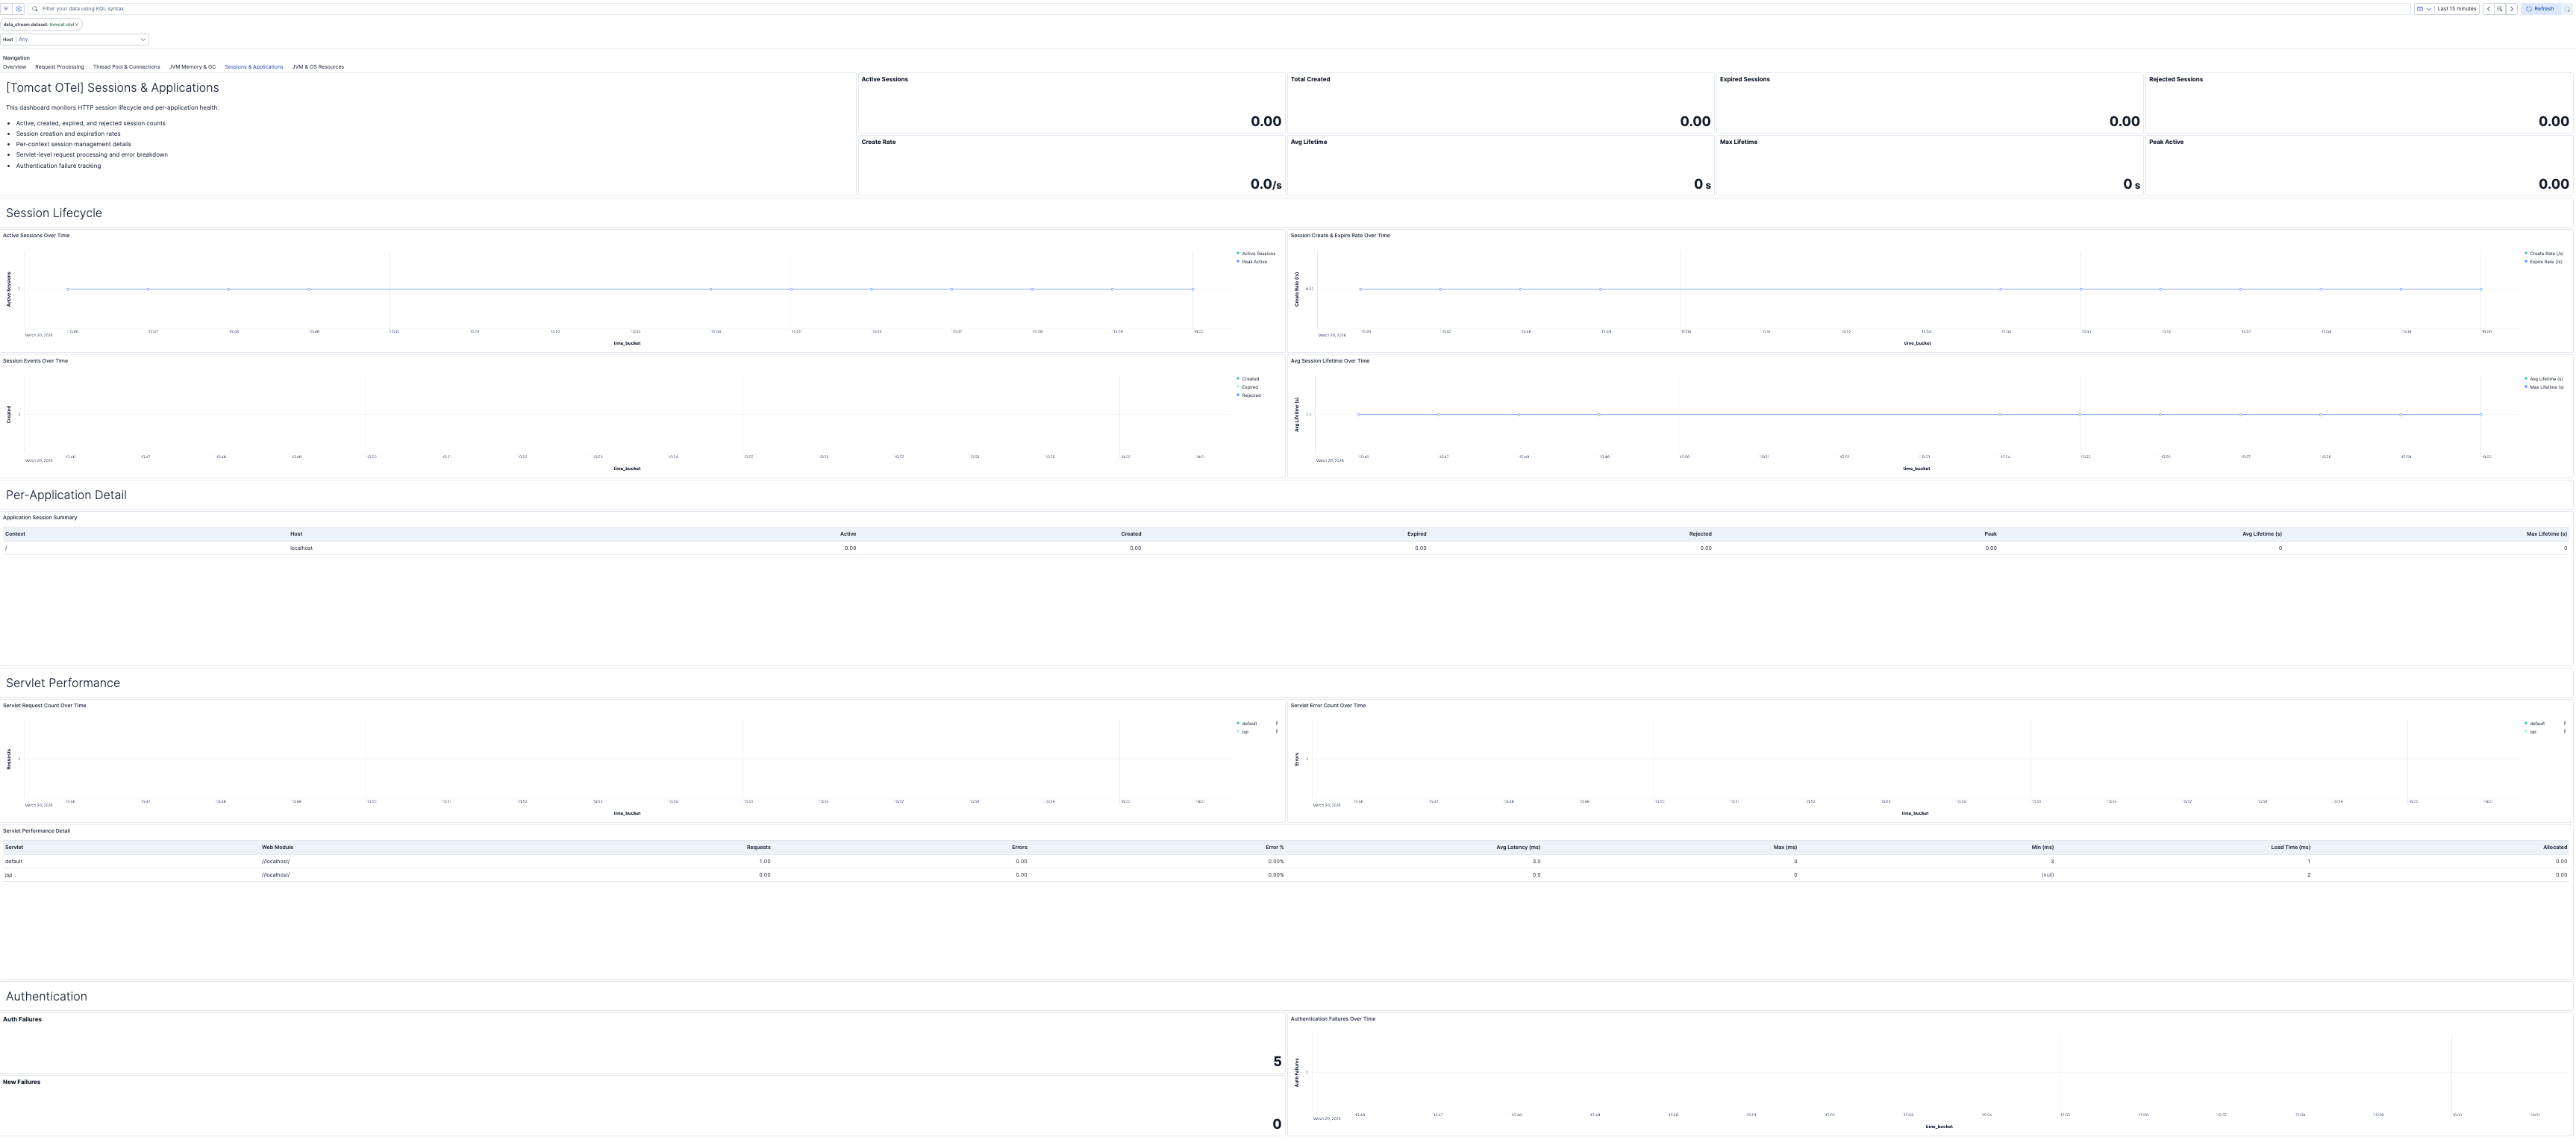
| **[Tomcat OTel] Sessions & Applications** | HTTP session lifecycle, per-application performance monitoring, servlet detail, and authentication failure tracking for web applications. |
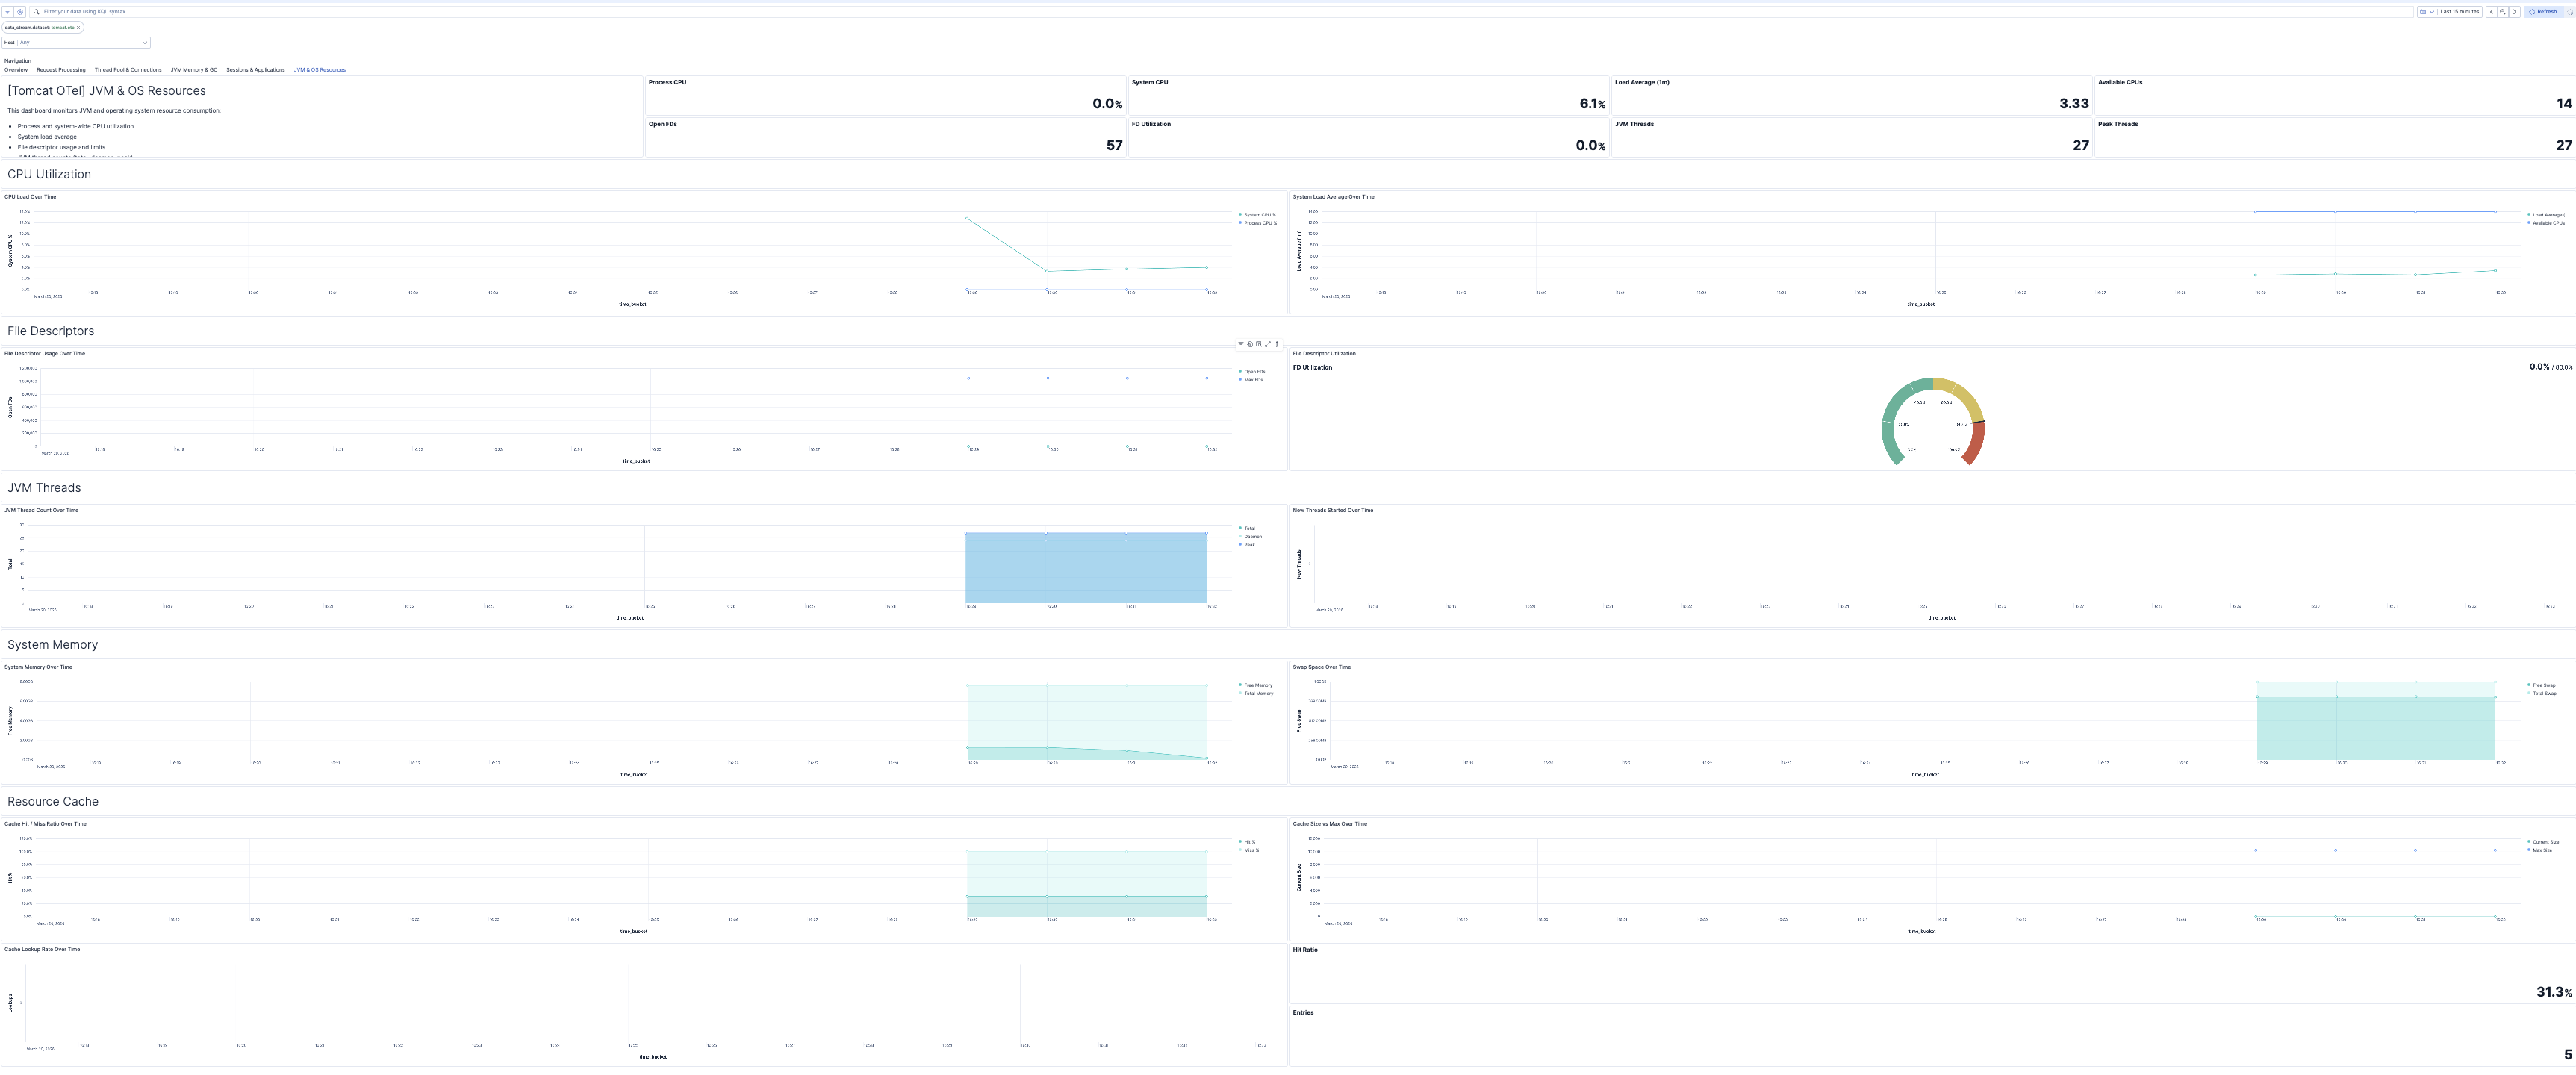
| **[Tomcat OTel] JVM & OS Resources** | JVM threading, CPU utilization, file descriptors, operating system resource monitoring, and web resource cache performance for the Tomcat JVM process. |
## Alert rules
| Alert | Trigger | Severity |
|----------------------------------------------|------------------------------------------------------------------------|----------|
| **[Tomcat OTel] Thread pool saturation** | Thread pool utilization exceeds 80% of maximum threads for a connector | Warning |
| **[Tomcat OTel] Connection pool saturation** | Connection count exceeds 80% of maximum connections for a connector | Warning |
| **[Tomcat OTel] High request error rate** | HTTP error rate exceeds 5% of total requests for a connector | Critical |
| **[Tomcat OTel] Request latency spike** | Average request processing latency exceeds 500 ms for a connector | Warning |
| **[Tomcat OTel] JVM heap memory pressure** | Heap memory utilization exceeds 85% of maximum heap | Critical |
| **[Tomcat OTel] Old generation GC activity** | Old generation (full) garbage collection cycles detected | Warning |
| **[Tomcat OTel] File descriptor exhaustion** | Open file descriptor count exceeds 80% of the system limit | Critical |
| **[Tomcat OTel] High JVM process CPU usage** | JVM process CPU utilization exceeds 90% | Warning |
| **[Tomcat OTel] Session rejection** | HTTP sessions rejected due to maximum active sessions limit reached | Warning |
## SLO templates
SLO templates require Elastic Stack version 9.4.0 or later.
| SLO | Target | Window | Description |
|-----------------------------------------------------------------|--------|----------------|-------------------------------------------------------------------------------------------------------------|
| **[Tomcat OTel] Average request latency 99.5% rolling 30 days** | 99.5% | 30-day rolling | Ensures 99.5% of 1-minute intervals show average request latency below 500 ms over a rolling 30-day period. |
| **[Tomcat OTel] Request error rate 99.5% rolling 30 days** | 99.5% | 30-day rolling | Ensures 99.5% of 1-minute intervals show an HTTP error rate below 5% over a rolling 30-day period. |
| **[Tomcat OTel] Thread pool utilization 99.5% rolling 30 days** | 99.5% | 30-day rolling | Ensures 99.5% of 1-minute intervals show thread pool utilization below 80% over a rolling 30-day period. |
## Screenshots
This integration includes one or more Kibana dashboards that visualizes the data collected by the integration. The screenshots below illustrate how the ingested data is displayed.
## Changelog
| Version | Details | Minimum Kibana version |
|-----------|------------------------------------------------------------------------------------------------------------------------------------------------|------------------------|
| **0.1.0** | **Enhancement** ([View pull request](https://github.com/elastic/integrations/pull/17926))Initial draft of the apache_tomcat_otel content pack. | 9.2.1 |