---
title: AWS ECS Metrics OpenTelemetry Assets
description: This package contains Kibana assets for monitoring ECS services with AWS CloudWatch metrics collected by the OpenTelemetry Collector. The package is content...
url: https://docs-v3-preview.elastic.dev/elastic/integration-docs/tree/main/reference/aws_ecs_otel
products:
- Elastic integrations
applies_to:
- Serverless Observability projects: Preview
- Serverless Security projects: Preview
- Elastic Stack: Preview since 9.5
---
# AWS ECS Metrics OpenTelemetry Assets
| | |
|-------------------------------------------------------------------------------------------------------------------------------|--------------------------------------------------------------------|
| **Version** | 0.10.0 : Preview ([View all](#changelog)) |
| **Subscription level**[What's this?](https://www.elastic.co/subscriptions) | Basic |
| **Developed by**[What's this?](https://docs-v3-preview.elastic.dev/elastic/integration-docs/tree/main/reference/developed-by) | Elastic |
| **Minimum Kibana version(s)** | 9.5.0 |
To use pre-release integrations, go to the **Integrations** page in Kibana, scroll down, and toggle on the _Display beta integrations_ option.
This package contains Kibana assets for monitoring ECS services with AWS CloudWatch metrics collected by the OpenTelemetry Collector.
The package is **content only**. It provides a curated metrics dashboard, but it does not configure data collection. Use the **AWS CloudWatch OpenTelemetry Input Package** (`aws_cloudwatch_input_otel`) to configure the OpenTelemetry Collector CloudWatch receiver and collect the required AWS service metrics into Elasticsearch.
## Data requirements
- CloudWatch metrics collected by the OpenTelemetry Collector AWS CloudWatch receiver.
- Documents indexed into the `metrics-aws.ecs.otel-*` data stream.
- The relevant AWS dimensions for this service, such as resource name, region, and service-specific identifiers.
## Compatibility
Requires Kibana `^9.5.0`.
## Dashboards
This package includes one pre-built Kibana dashboard:
| Name | Description |
|------------------------|------------------------------------------------------------------------------------|
| [AWS ECS OTel] Metrics | AWS ECS dashboard for CloudWatch metrics collected by the OpenTelemetry Collector. |
## Alerting Rule Templates
Alert rule templates provide pre-defined configurations for creating alert rules in Kibana.
For more information, refer to the [Elastic documentation](https://www.elastic.co/docs/reference/fleet/alerting-rule-templates).
Alert rule templates require Elastic Stack version 9.2.0 or later.
**The following alert rule templates are available:**
| Name | Description |
|----------------------------------------|------------------------------------------------------------------------------------------------------------------------------------------------------------------------------------------------------|
| [AWS ECS OTel] CPU reservation high | Alerts when the percentage of CPU units reserved by running tasks approaches the cluster's total registered CPU capacity. High reservation means new tasks cannot be placed without adding capacity. |
| [AWS ECS OTel] CPU utilization high | Alerts when average CPU utilization of reserved task CPU exceeds a threshold. Sustained high CPU throttles workloads and raises application latency. |
| [AWS ECS OTel] Memory reservation high | Alerts when the percentage of memory reserved by running tasks approaches the cluster's total registered memory capacity. High reservation means new tasks cannot be placed without adding capacity. |
| [AWS ECS OTel] Memory utilization high | Alerts when average memory utilization of reserved task memory exceeds a threshold. Sustained high memory risks OOM kills and task churn. |
## Screenshots
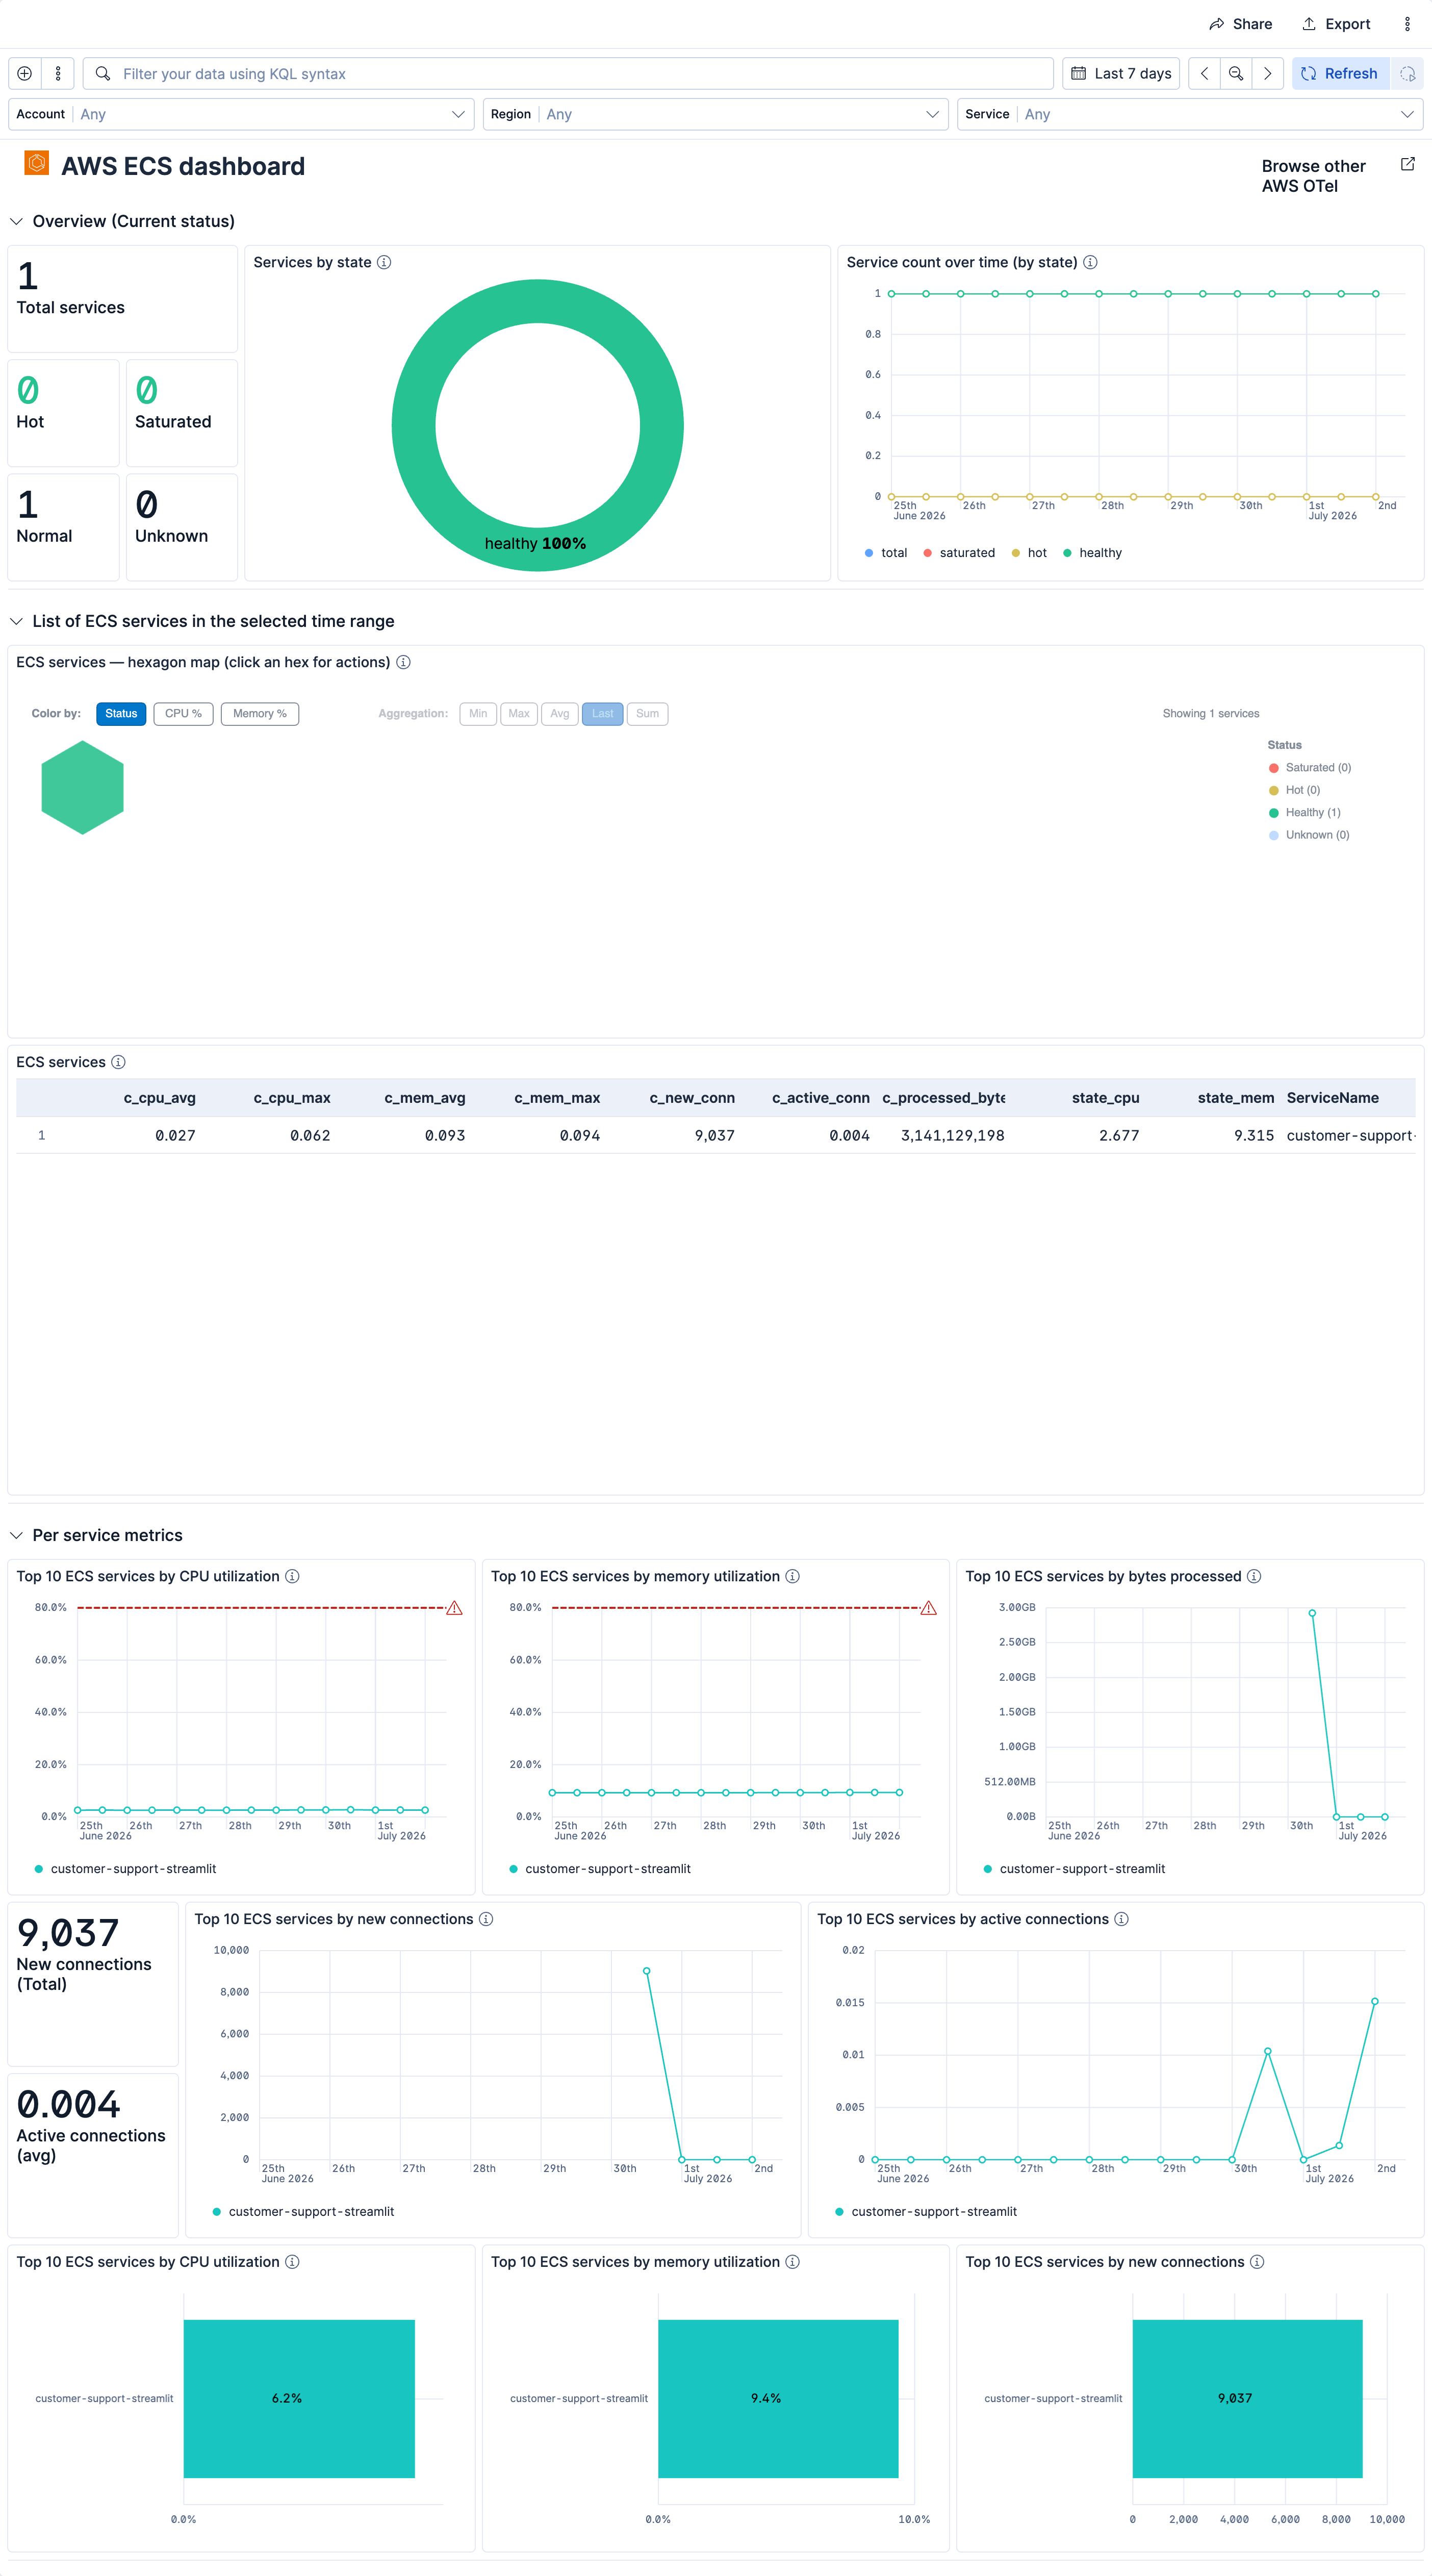
This integration includes one or more Kibana dashboards that visualizes the data collected by the integration. The screenshots below illustrate how the ingested data is displayed.
## Changelog
| Version | Details | Minimum Kibana version |
|------------|------------------------------------------------------------------------------------------------------------------------------------------------------------------------------------------------------------------------------------------------------------------------------------------------------|------------------------|
| **0.10.0** | **Enhancement** ([View pull request](https://github.com/elastic/integrations/pull/19922))Add ML anomaly detection module for ECS service CPU and memory utilization.**Enhancement** ([View pull request](https://github.com/elastic/integrations/pull/19922))Add ml_module to the Kibana asset tags. | 9.5.0 |
| **0.9.0** | **Enhancement** ([View pull request](https://github.com/elastic/integrations/pull/19887))Add missing recommended alerts for CPU and memory reservation high. | 9.5.0 |
| **0.8.0** | **Enhancement** ([View pull request](https://github.com/elastic/integrations/pull/19940))Add tags to Kibana assets | 9.5.0 |
| **0.7.1** | **Enhancement** ([View pull request](https://github.com/elastic/integrations/pull/19964))Rename the dashboard to "[AWS ECS OTel] Metrics". | 9.5.0 |
| **0.7.0** | **Enhancement** ([View pull request](https://github.com/elastic/integrations/pull/19884))Remove the idle status and map "no data" to "Unknown" across ECS dashboard panels. | 9.5.0 |
| **0.6.0** | **Enhancement** ([View pull request](https://github.com/elastic/integrations/pull/19799))Improve ESQL queries in dashboards | 9.5.0 |
| **0.5.0** | **Enhancement** ([View pull request](https://github.com/elastic/integrations/pull/19797))Add _dev/build/docs/README.md | 9.5.0 |
| **0.4.0** | **Enhancement** ([View pull request](https://github.com/elastic/integrations/pull/19683))Improve dashboard queries and visualizations | 9.5.0 |
| **0.3.0** | **Enhancement** ([View pull request](https://github.com/elastic/integrations/pull/19637))Add alert rules to README | 9.5.0 |
| **0.2.1** | **Enhancement** ([View pull request](https://github.com/elastic/integrations/pull/19666))Standardize the package title and description to the `AWS OpenTelemetry Assets` naming convention. | 9.5.0 |
| **0.2.0** | **Enhancement** ([View pull request](https://github.com/elastic/integrations/pull/19560))Create new Alert assets | 9.5.0 |
| **0.1.0** | **Enhancement** ([View pull request](https://github.com/elastic/integrations/pull/19462))Initial AWS ECS OpenTelemetry metrics dashboard package | 9.5.0 |