---
title: AWS Lambda Metrics OpenTelemetry Assets
description: This package contains Kibana assets for monitoring Lambda functions with AWS CloudWatch metrics collected by the OpenTelemetry Collector. The package...
url: https://docs-v3-preview.elastic.dev/elastic/integration-docs/tree/main/reference/aws_lambda_otel
products:
- Elastic integrations
applies_to:
- Serverless Observability projects: Preview
- Serverless Security projects: Preview
- Elastic Stack: Preview since 9.5
---
# AWS Lambda Metrics OpenTelemetry Assets
| | |
|-------------------------------------------------------------------------------------------------------------------------------|--------------------------------------------------------------------|
| **Version** | 0.10.0 : Preview ([View all](#changelog)) |
| **Subscription level**[What's this?](https://www.elastic.co/subscriptions) | Basic |
| **Developed by**[What's this?](https://docs-v3-preview.elastic.dev/elastic/integration-docs/tree/main/reference/developed-by) | Elastic |
| **Minimum Kibana version(s)** | 9.5.0 |
To use pre-release integrations, go to the **Integrations** page in Kibana, scroll down, and toggle on the _Display beta integrations_ option.
This package contains Kibana assets for monitoring Lambda functions with AWS CloudWatch metrics collected by the OpenTelemetry Collector.
The package is **content only**. It provides a curated metrics dashboard, but it does not configure data collection. Use the **AWS CloudWatch OpenTelemetry Input Package** (`aws_cloudwatch_input_otel`) to configure the OpenTelemetry Collector CloudWatch receiver and collect the required AWS service metrics into Elasticsearch.
## Data requirements
- CloudWatch metrics collected by the OpenTelemetry Collector AWS CloudWatch receiver.
- Documents indexed into the `metrics-aws.lambda.otel-*` data stream.
- The relevant AWS dimensions for this service, such as resource name, region, and service-specific identifiers.
## Compatibility
Requires Kibana `^9.5.0`.
## Dashboards
This package includes one pre-built Kibana dashboard:
| Name | Description |
|---------------------------|---------------------------------------------------------------------------------------|
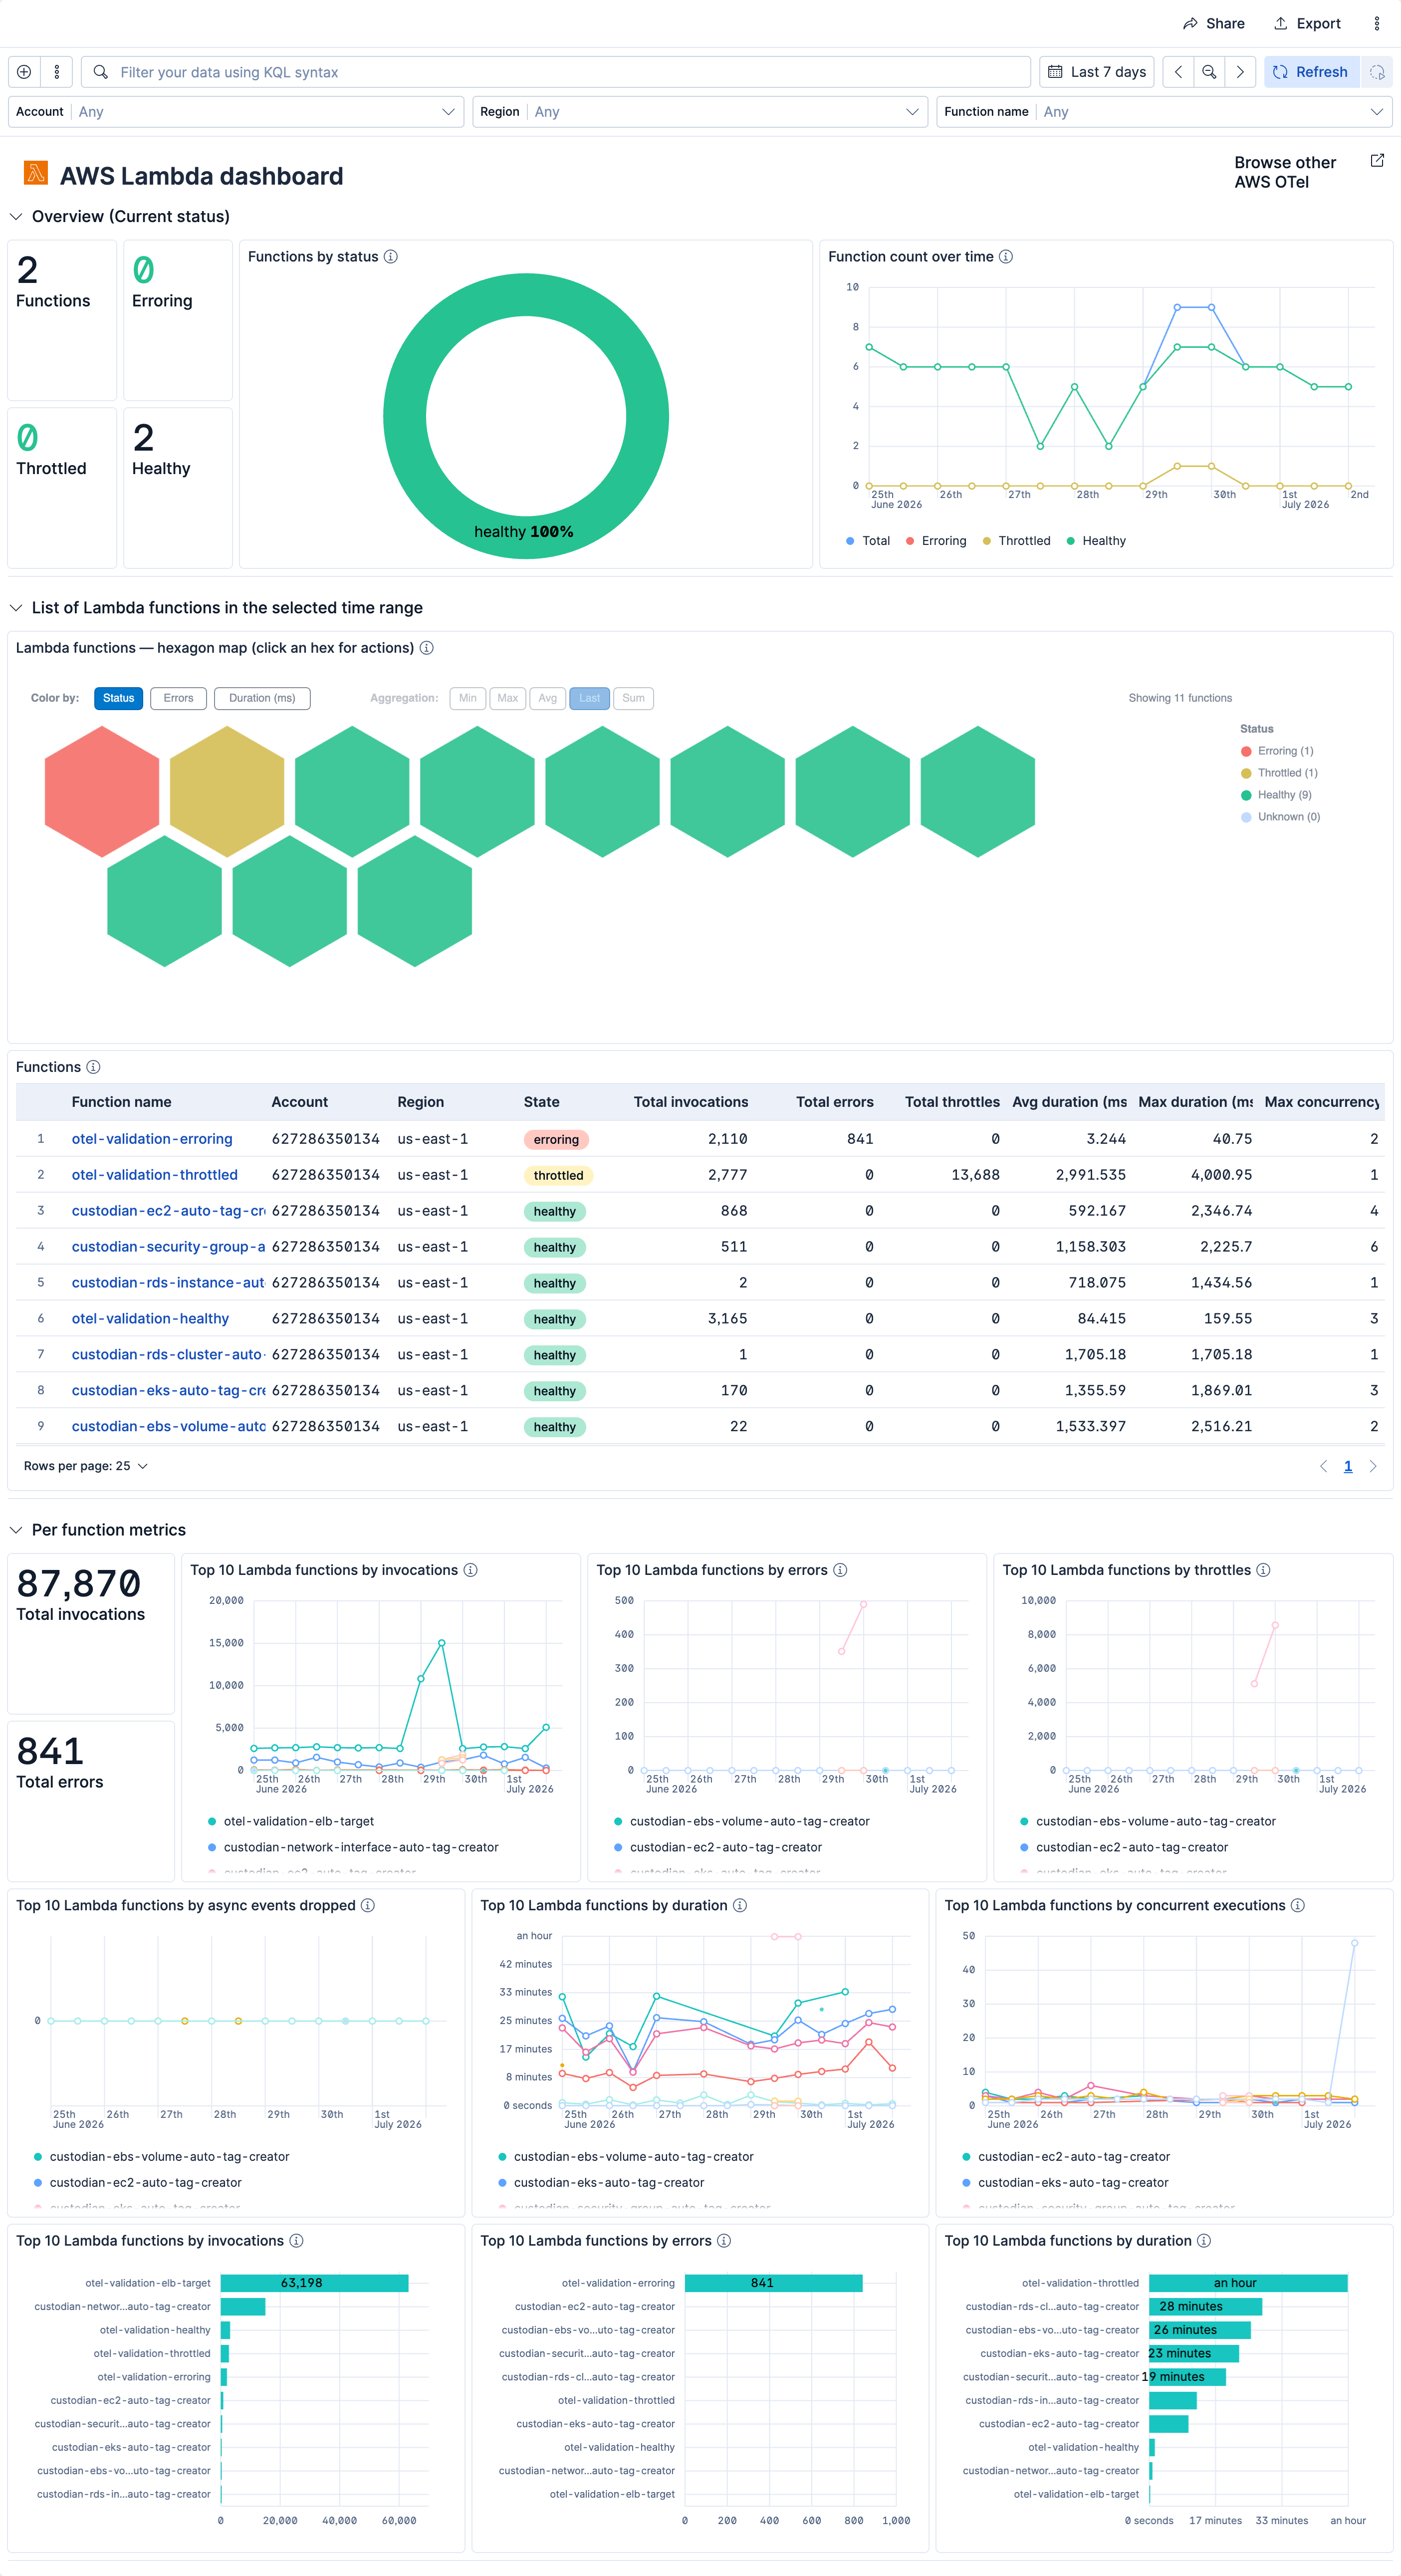
| [AWS Lambda OTel] Metrics | AWS Lambda dashboard for CloudWatch metrics collected by the OpenTelemetry Collector. |
## Alerting Rule Templates
Alert rule templates provide pre-defined configurations for creating alert rules in Kibana.
For more information, refer to the [Elastic documentation](https://www.elastic.co/docs/reference/fleet/alerting-rule-templates).
Alert rule templates require Elastic Stack version 9.2.0 or later.
**The following alert rule templates are available:**
| Name | Description |
|-------------------------------------------------|---------------------------------------------------------------------------------------------------------------------------------------------------------------|
| [AWS Lambda OTel] Dead letter errors | Alerts when Lambda fails to write events to the configured dead-letter queue, meaning failed events may be lost. |
| [AWS Lambda OTel] Destination delivery failures | Alerts when Lambda fails to deliver events to configured on-success or on-failure destinations. |
| [AWS Lambda OTel] High async event age | Alerts when async-invoked Lambda functions show high AsyncEventAge, indicating events are aging in the internal queue. |
| [AWS Lambda OTel] High concurrent executions | Alerts when peak concurrent executions approach capacity limits, predicting imminent throttling. |
| [AWS Lambda OTel] High average duration | Alerts when average Lambda invocation duration exceeds a configurable threshold over a 15-minute window. |
| [AWS Lambda OTel] High tail duration | Alerts when peak (Maximum) Lambda invocation duration exceeds a configurable threshold, indicating slow handler execution or downstream latency. |
| [AWS Lambda OTel] High error rate | Alerts when a Lambda function exceeds a configurable error rate (Errors / Invocations) over a 15-minute window. Evaluates the top 10 functions by error rate. |
| [AWS Lambda OTel] High iterator age | Alerts when stream-based Lambda consumers show high IteratorAge, indicating the function is falling behind the record arrival rate. |
| [AWS Lambda OTel] High throttle rate | Alerts when a Lambda function exceeds a configurable throttle rate (Throttles / (Invocations + Throttles)) over a 15-minute window. |
## SLO Templates
SLO templates provide pre-defined configurations for creating SLOs in Kibana.
For more information, refer to the [Elastic documentation](https://www.elastic.co/docs/solutions/observability/incident-management/service-level-objectives-slos).
SLO templates require Elastic Stack version 9.4.0 or later.
**The following SLO templates are available:**
| Name | Description |
|-----------------------------------------------------------------|------------------------------------------------------------------------------------------------------------------------------------------------------------------------------------------------------------------------------------------------------------------------------------------------------------------------------------------------|
| [AWS Lambda OTel] Average duration 99.5% rolling 30 days | Tracks per-function execution latency from CloudWatch Duration (Average statistic). Each 1-minute window is good when average duration stays below 3000 ms; 99.5% of windows must be good over a rolling 30-day period. Sustained duration regressions degrade user-facing response times and increase Lambda billing. |
| [AWS Lambda OTel] Invocation success rate 99.5% rolling 30 days | Tracks per-function invocation reliability from CloudWatch Errors and Invocations (Sum statistics). Each 1-minute window is good when the error rate is below 0.5%; 99.5% of windows must be good over a rolling 30-day period. Rising error rates indicate function code failures that directly break synchronous and asynchronous workloads. |
## Screenshots
This integration includes one or more Kibana dashboards that visualizes the data collected by the integration. The screenshots below illustrate how the ingested data is displayed.
## Changelog
| Version | Details | Minimum Kibana version |
|------------|-----------------------------------------------------------------------------------------------------------------------------------------------------------------------------------------------------------------------------------------------------------------------------------------------------------------------------------------|------------------------|
| **0.10.0** | **Enhancement** ([View pull request](https://github.com/elastic/integrations/pull/19923))Add ML anomaly detection modules for Lambda function performance (duration, concurrency) and errors/throttles.**Enhancement** ([View pull request](https://github.com/elastic/integrations/pull/19923))Add ml_module to the Kibana asset tags. | 9.5.0 |
| **0.9.0** | **Enhancement** ([View pull request](https://github.com/elastic/integrations/pull/19940))Add tags to Kibana assets | 9.5.0 |
| **0.8.1** | **Enhancement** ([View pull request](https://github.com/elastic/integrations/pull/19964))Rename the dashboard to "[AWS Lambda OTel] Metrics". | 9.5.0 |
| **0.8.0** | **Enhancement** ([View pull request](https://github.com/elastic/integrations/pull/19884))Remove the idle card and merge idle into "Unknown" across Lambda dashboard panels. | 9.5.0 |
| **0.7.0** | **Enhancement** ([View pull request](https://github.com/elastic/integrations/pull/19799))Improve ESQL queries in dashboards | 9.5.0 |
| **0.6.0** | **Enhancement** ([View pull request](https://github.com/elastic/integrations/pull/19797))Add _dev/build/docs/README.md | 9.5.0 |
| **0.5.0** | **Enhancement** ([View pull request](https://github.com/elastic/integrations/pull/19683))Improve dashboard queries and visualizations | 9.5.0 |
| **0.4.0** | **Enhancement** ([View pull request](https://github.com/elastic/integrations/pull/19695))Update aggregation function and remove division by zero in SLO metric filter. | 9.5.0 |
| **0.3.0** | **Enhancement** ([View pull request](https://github.com/elastic/integrations/pull/19637))Add alert rules and SLOs to README | 9.5.0 |
| **0.2.1** | **Enhancement** ([View pull request](https://github.com/elastic/integrations/pull/19666))Standardize the package title and description to the `AWS OpenTelemetry Assets` naming convention. | 9.5.0 |
| **0.2.0** | **Enhancement** ([View pull request](https://github.com/elastic/integrations/pull/19456))Create new SLO and Alert assets | 9.5.0 |
| **0.1.0** | **Enhancement** ([View pull request](https://github.com/elastic/integrations/pull/19462))Initial AWS Lambda OpenTelemetry metrics dashboard package | 9.5.0 |