---
title: CockroachDB OpenTelemetry Assets
description: CockroachDB is a distributed SQL database designed for horizontal scalability, strong consistency, and survivability. It uses the Raft consensus protocol...
url: https://docs-v3-preview.elastic.dev/elastic/integration-docs/tree/main/reference/cockroachdb_otel
products:
- Elastic integrations
applies_to:
- Serverless Observability projects: Generally available
- Serverless Security projects: Generally available
- Elastic Stack: Generally available since 9.2
---
# CockroachDB OpenTelemetry Assets
| | |
|-------------------------------------------------------------------------------------------------------------------------------|----------------------------------------------------------------|
| **Version** | 0.1.0 : Beta ([View all](#changelog)) |
| **Subscription level**[What's this?](https://www.elastic.co/subscriptions) | Basic |
| **Developed by**[What's this?](https://docs-v3-preview.elastic.dev/elastic/integration-docs/tree/main/reference/developed-by) | Elastic |
| **Minimum Kibana version(s)** | 9.2.1 |
To use beta integrations, go to the **Integrations** page in Kibana, scroll down, and toggle on the _Display beta integrations_ option.
CockroachDB is a distributed SQL database designed for horizontal scalability, strong consistency, and survivability. It uses the Raft consensus protocol to replicate data across nodes and exposes a PostgreSQL-compatible wire protocol.
The CockroachDB OpenTelemetry assets provide dashboards, alert rules, and SLO templates for monitoring CockroachDB clusters. They consume metrics from the Prometheus receiver scraping CockroachDB's `/_status/vars` endpoint, covering cluster availability, replication health, SQL workload, storage, and resource utilization.
## Compatibility
The CockroachDB OpenTelemetry assets have been tested with:
- OpenTelemetry Collector Contrib `prometheusreceiver` v0.146.0
- Elastic Distribution of OpenTelemetry (EDOT) Collector v9.2.1
CockroachDB tested against:
- CockroachDB v24.3
## Requirements
You need Elasticsearch for storing and searching your data and Kibana for visualizing and managing it.
You can use our hosted Elasticsearch Service on Elastic Cloud, which is recommended, or self-manage the Elastic Stack on your own hardware.
## Setup
### Prerequisites
CockroachDB exposes a Prometheus-compatible metrics endpoint at `/_status/vars` by default. No additional service-side configuration is required; ensure the HTTP port (typically 8080) is reachable from the OpenTelemetry Collector.
### Configuration
Install and configure the upstream OpenTelemetry Collector or Elastic Distribution of OpenTelemetry (EDOT) Collector to scrape CockroachDB metrics and export them to Elasticsearch. Replace the following placeholders in the configuration:
- ``: CockroachDB node endpoint to scrape (format: `host:port`, for example, `localhost:8080` or `cockroachdb-node-1.example.com:8080`)
- ``: Elasticsearch endpoint (for example, `https://elasticsearch.example.com:9200`)
- ``: Elasticsearch API key for authentication (use `${env:ES_API_KEY}` in the YAML and set the variable in your environment)
```yaml
receivers:
prometheus/cockroachdb:
config:
scrape_configs:
- job_name: cockroachdb
scrape_interval: 15s
metrics_path: /_status/vars
params:
format: [prometheus]
scheme: http
static_configs:
- targets: []
processors:
resource/dataset:
attributes:
- key: data_stream.dataset
value: cockroachdb
action: upsert
exporters:
elasticsearch/otel:
endpoint:
api_key:
mapping:
mode: otel
service:
pipelines:
metrics:
receivers: [prometheus/cockroachdb]
processors: [resource/dataset]
exporters: [elasticsearch/otel]
```
For multi-node clusters, add additional targets to the `static_configs` list or use appropriate service discovery. Ensure `service.name: cockroachdb` is set so the dashboards and alerts filter correctly.
## Reference
### Metrics
CockroachDB metrics are scraped using the Prometheus receiver from CockroachDB's `/_status/vars` endpoint. Refer to the [Prometheus receiver](https://github.com/open-telemetry/opentelemetry-collector-contrib/blob/main/receiver/prometheusreceiver/README.md) documentation and [CockroachDB metrics documentation](https://www.cockroachlabs.com/docs/stable/monitoring-and-alerting.html) for details on available metrics.
## Dashboards
| Dashboard | Description |
|---------------------------------------------|---------------------------------------------------------------------------------------------------------------------------------------------------------------------|
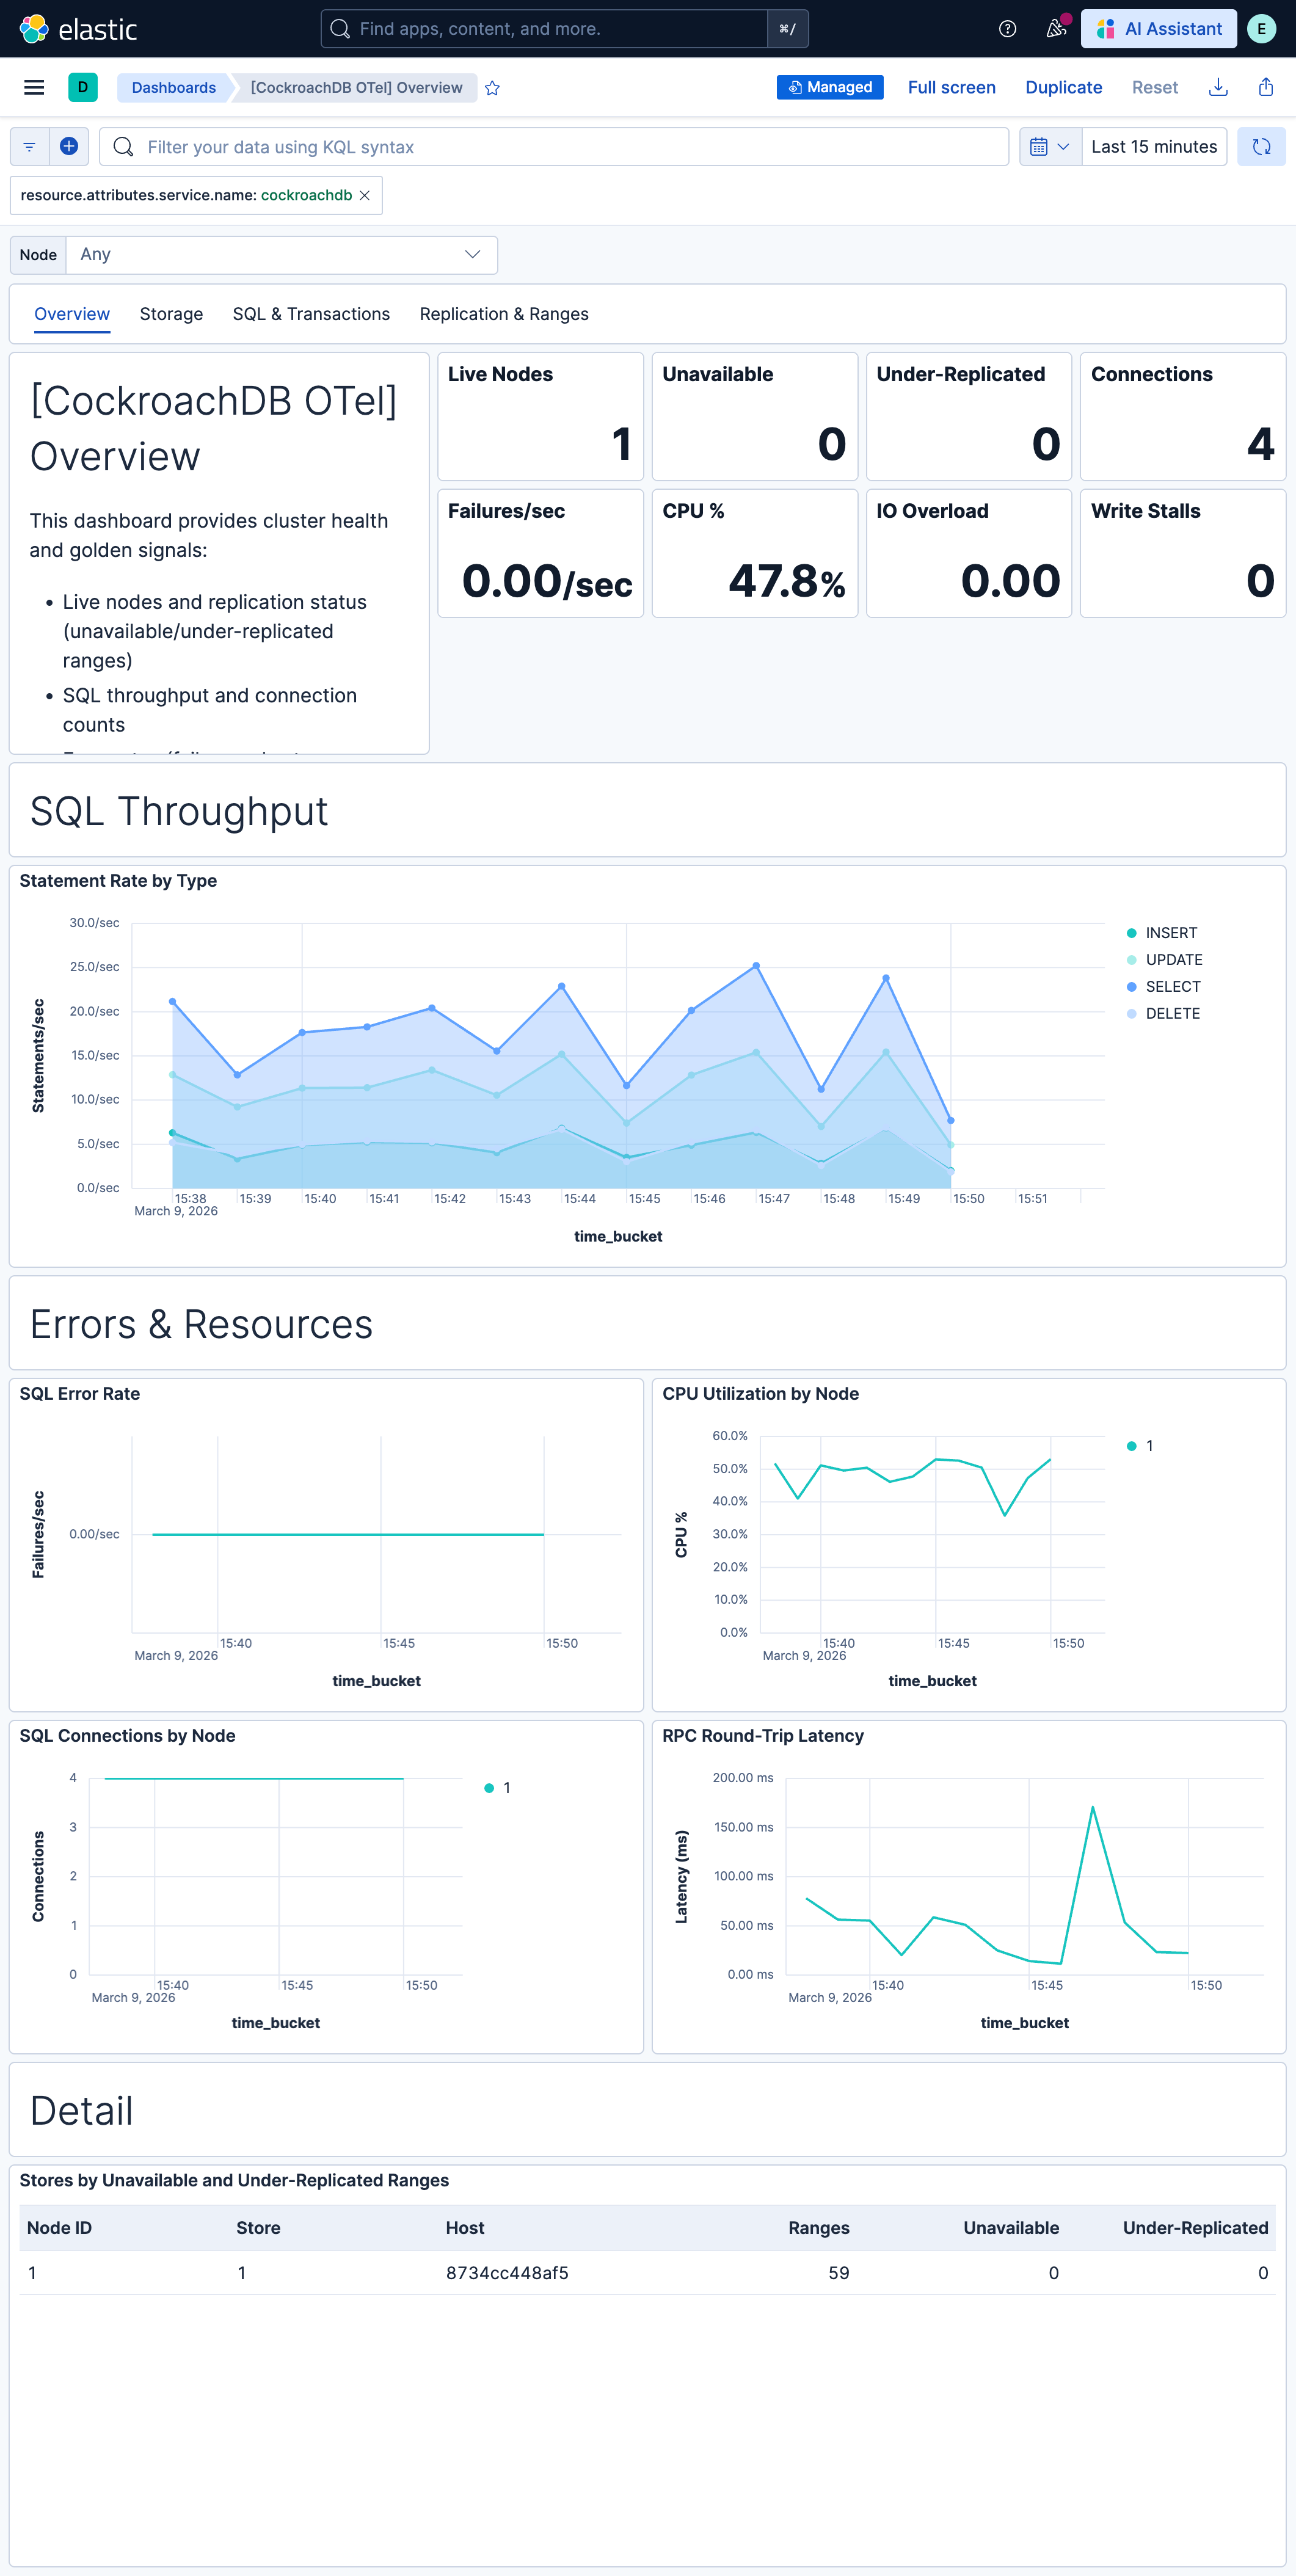
| **[CockroachDB OTel] Overview** | Cluster health, availability, and golden signals for CockroachDB. Covers live nodes, replication status, SQL throughput, errors, CPU, and storage. |
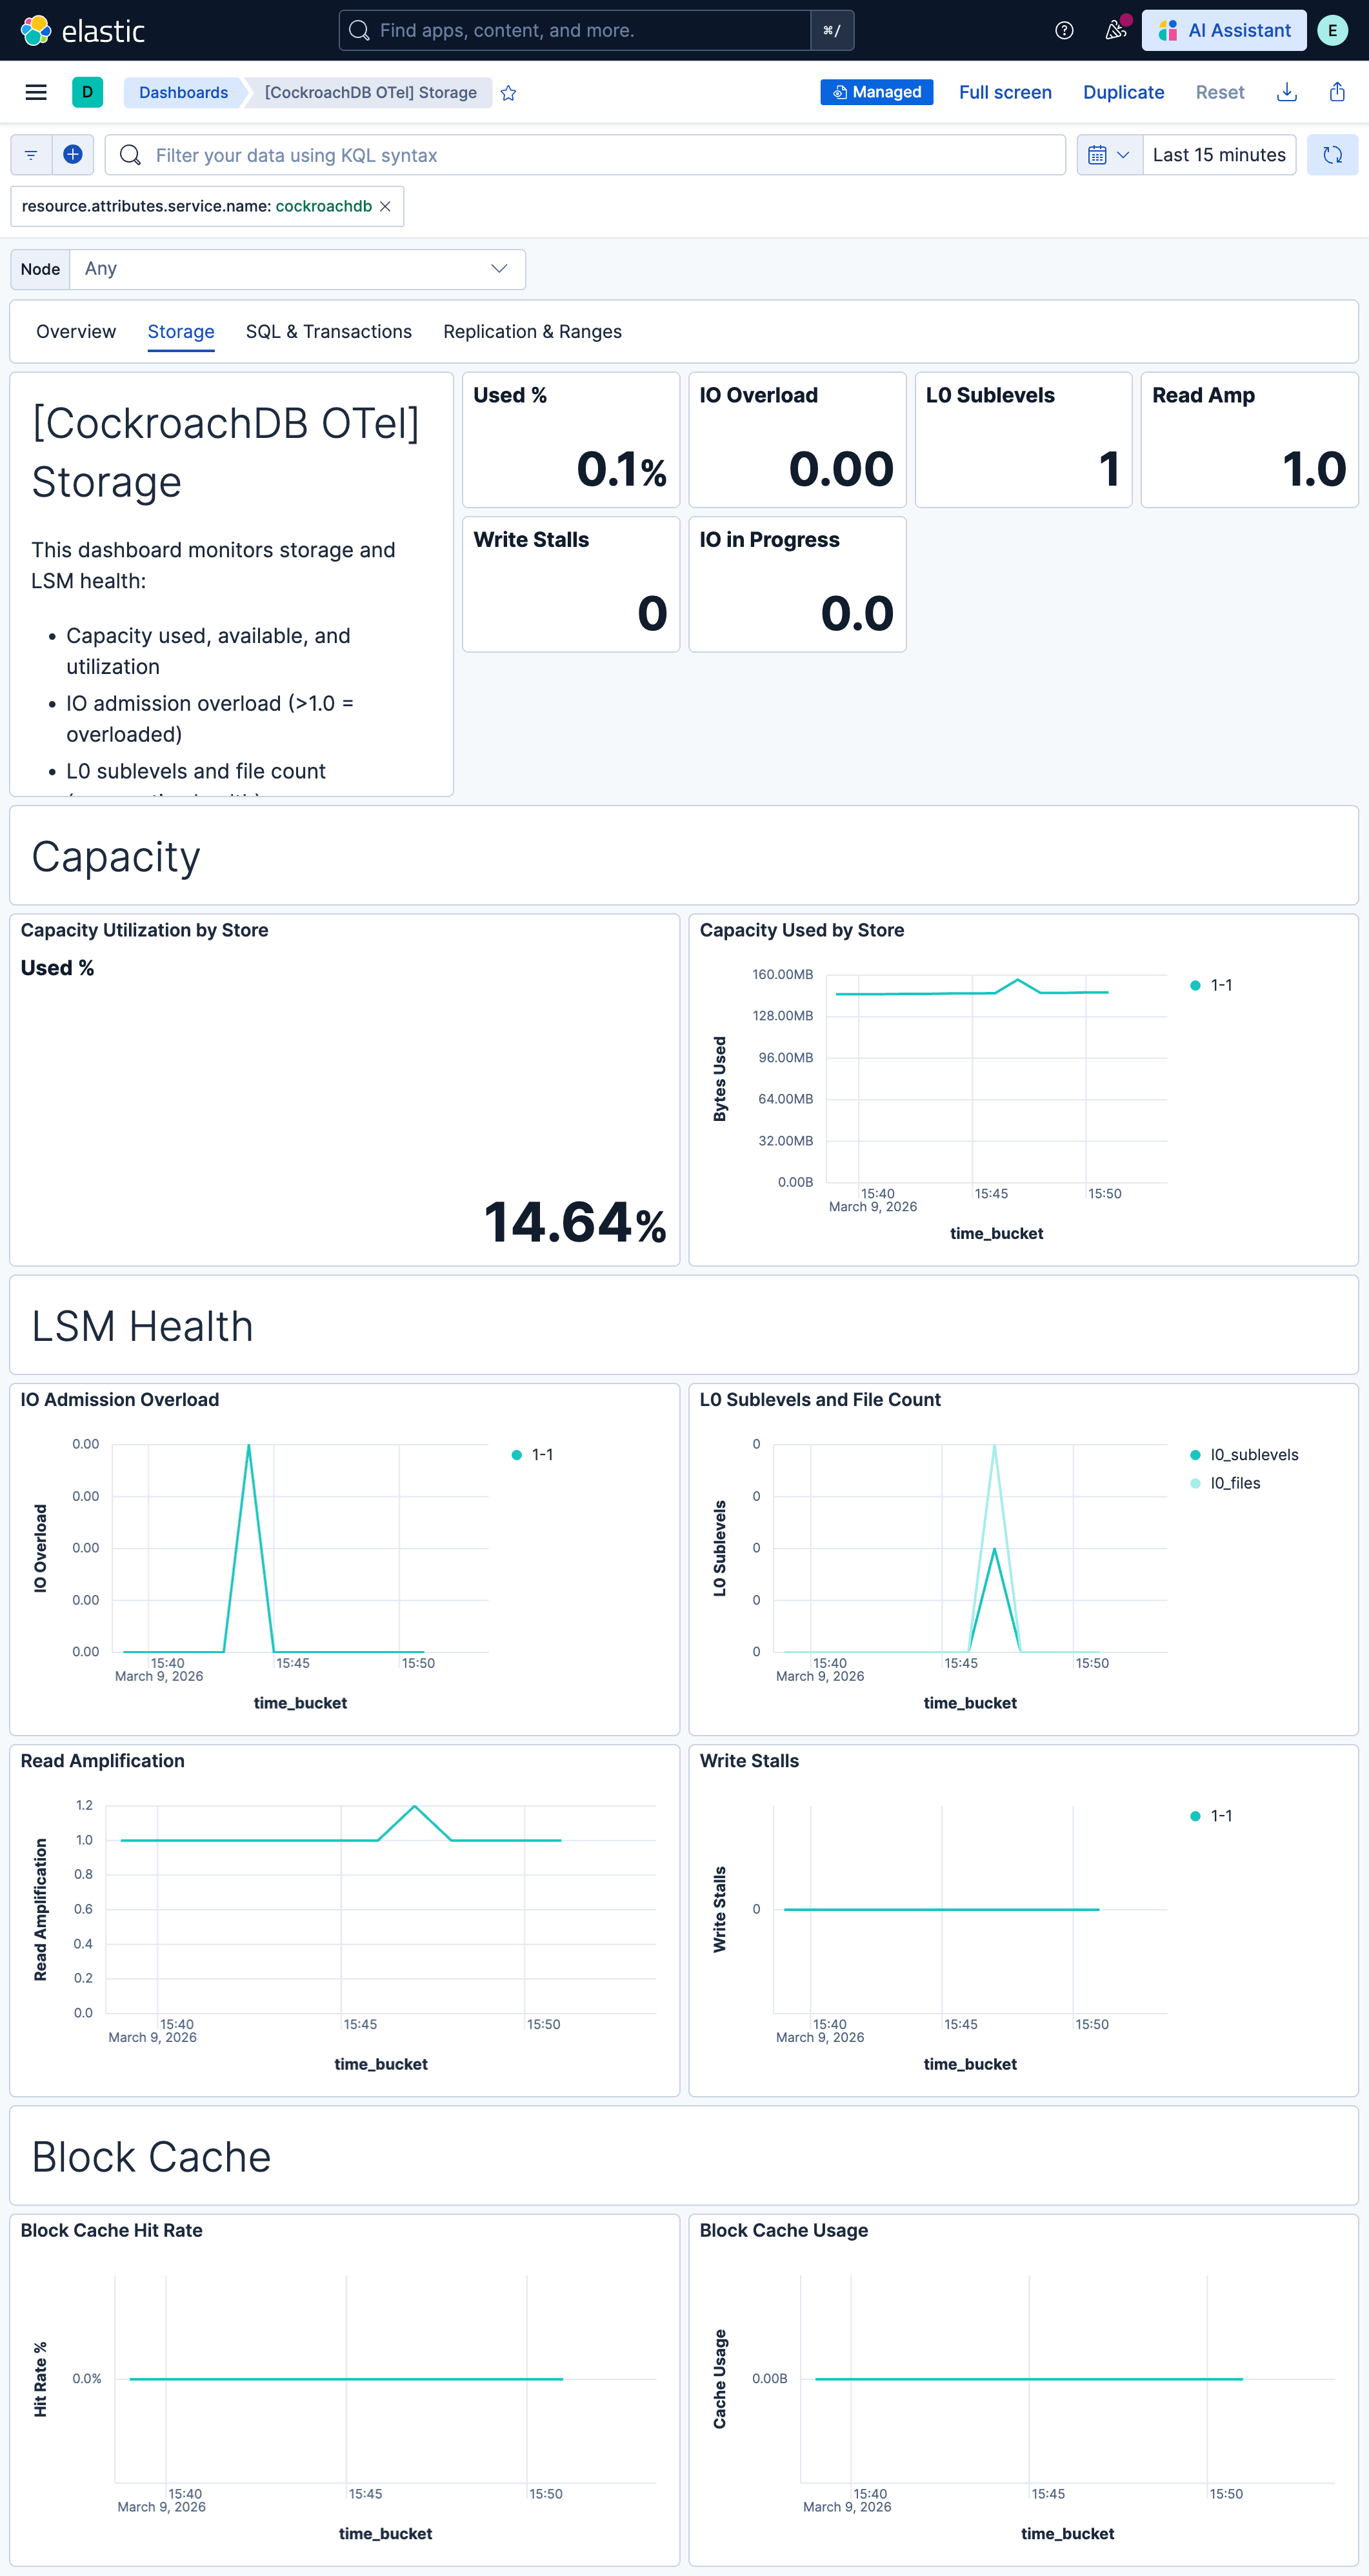
| **[CockroachDB OTel] Storage** | Storage capacity, LSM tree health, and disk I/O metrics. Monitor capacity usage, admission IO overload, L0 sublevels, read amplification, and write stalls. |
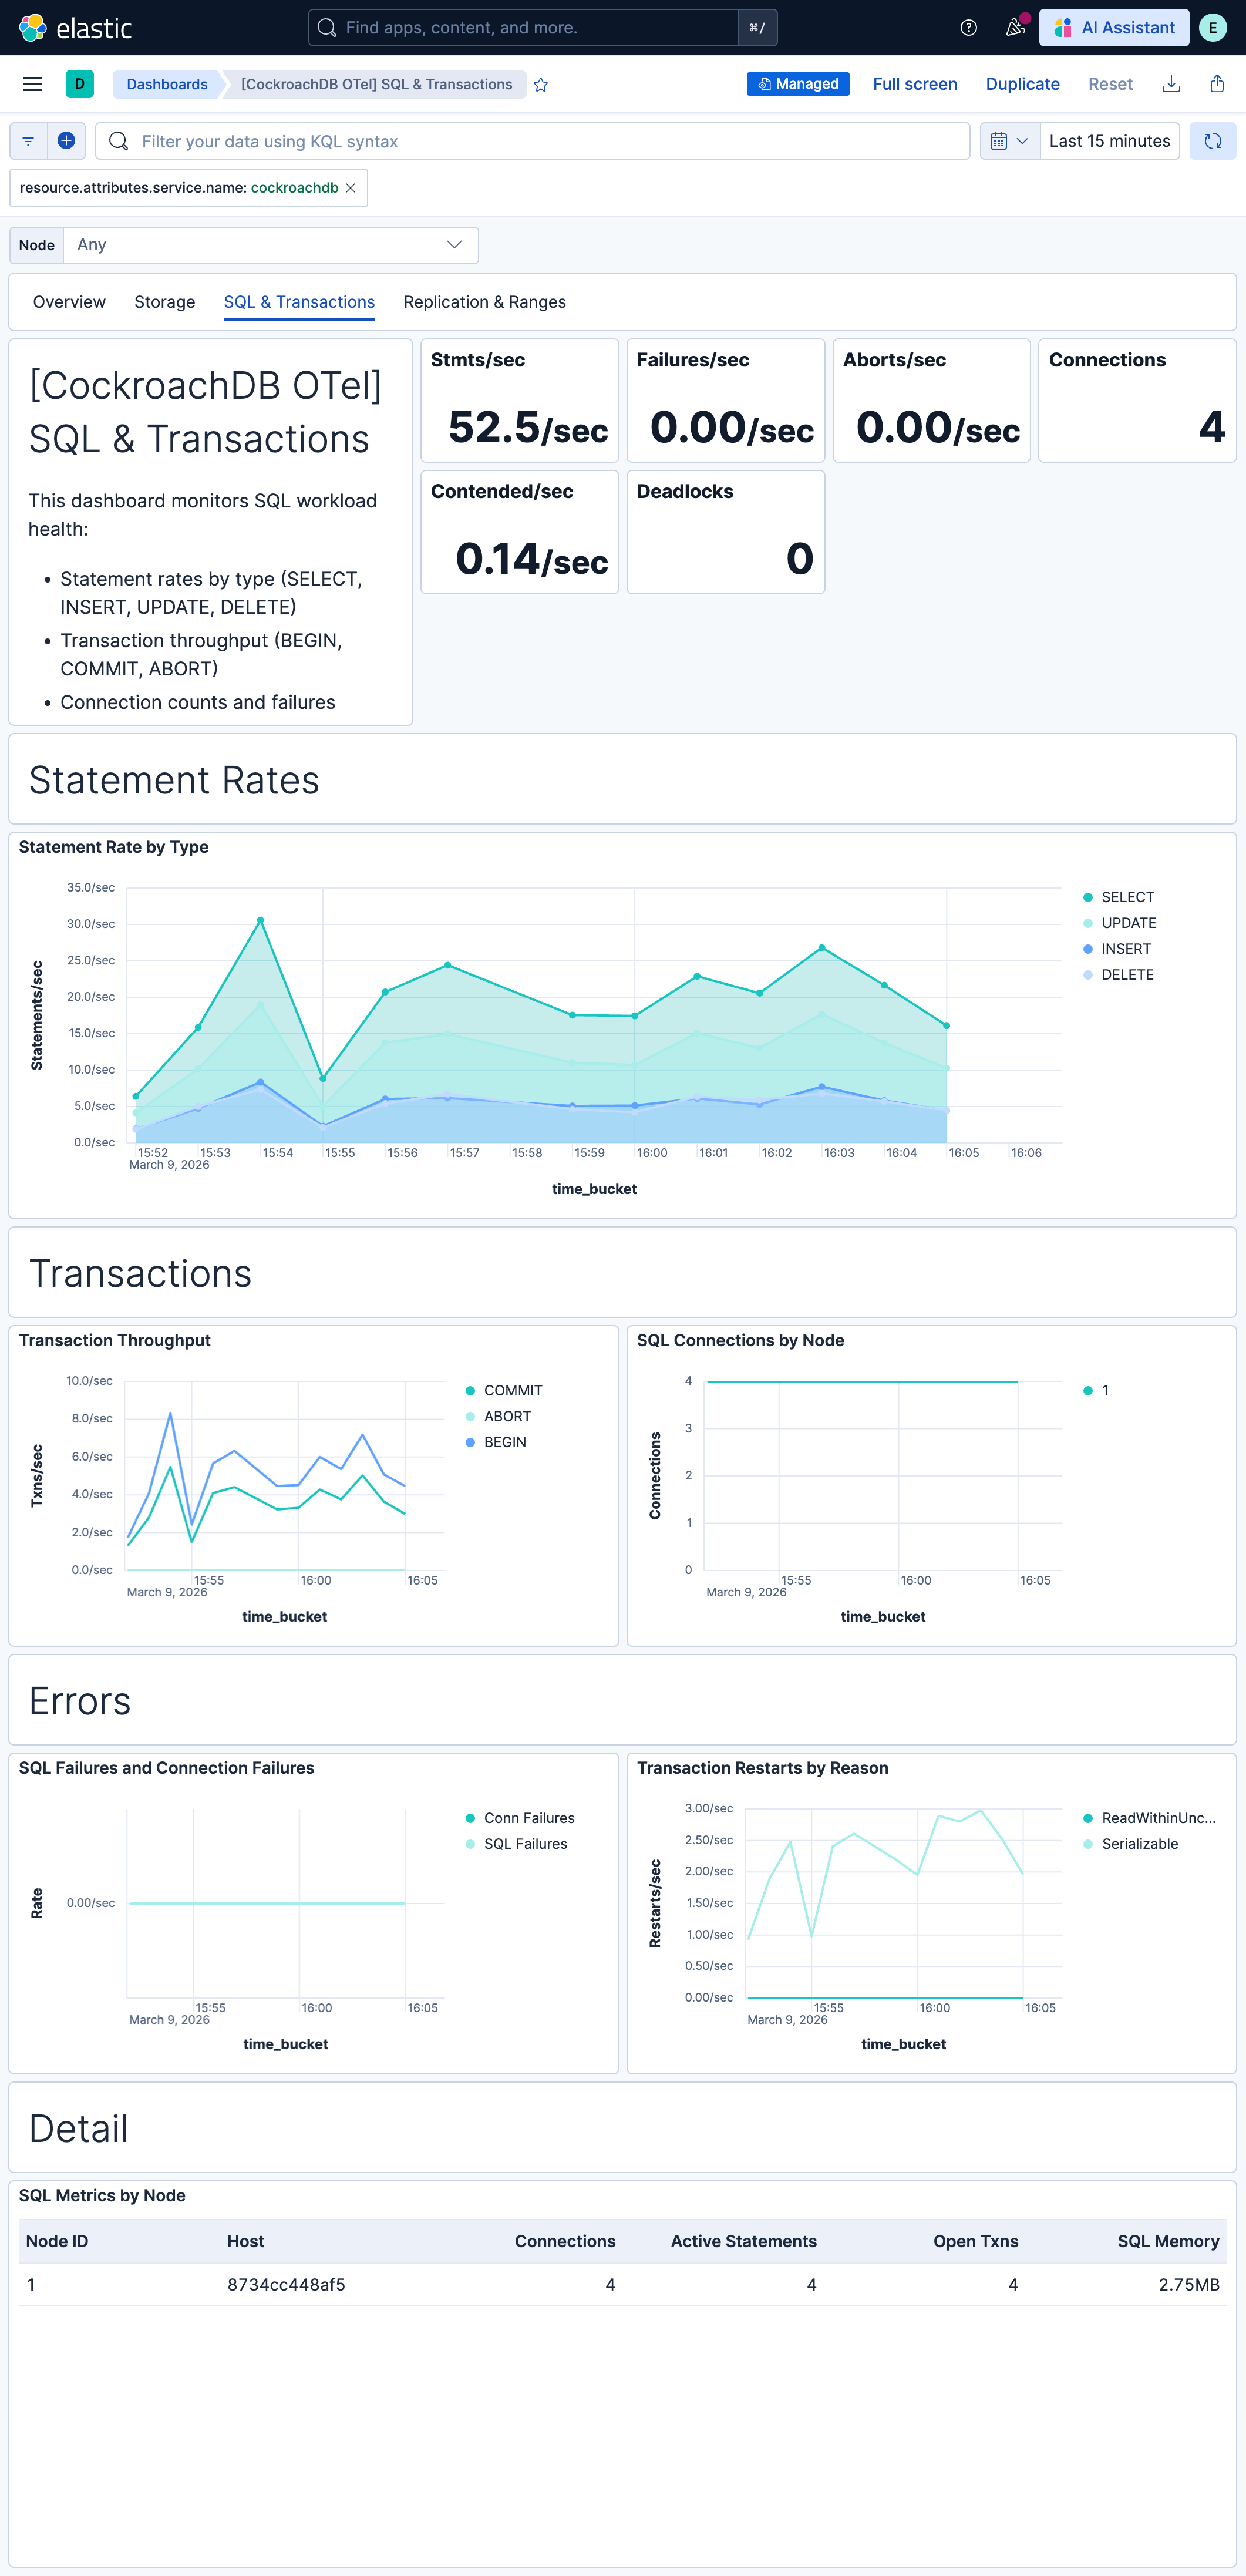
| **[CockroachDB OTel] SQL & Transactions** | SQL statement rates, transaction throughput, errors, and contention. Monitor SELECT/INSERT/UPDATE/DELETE rates, connection counts, failures, aborts, and deadlocks. |
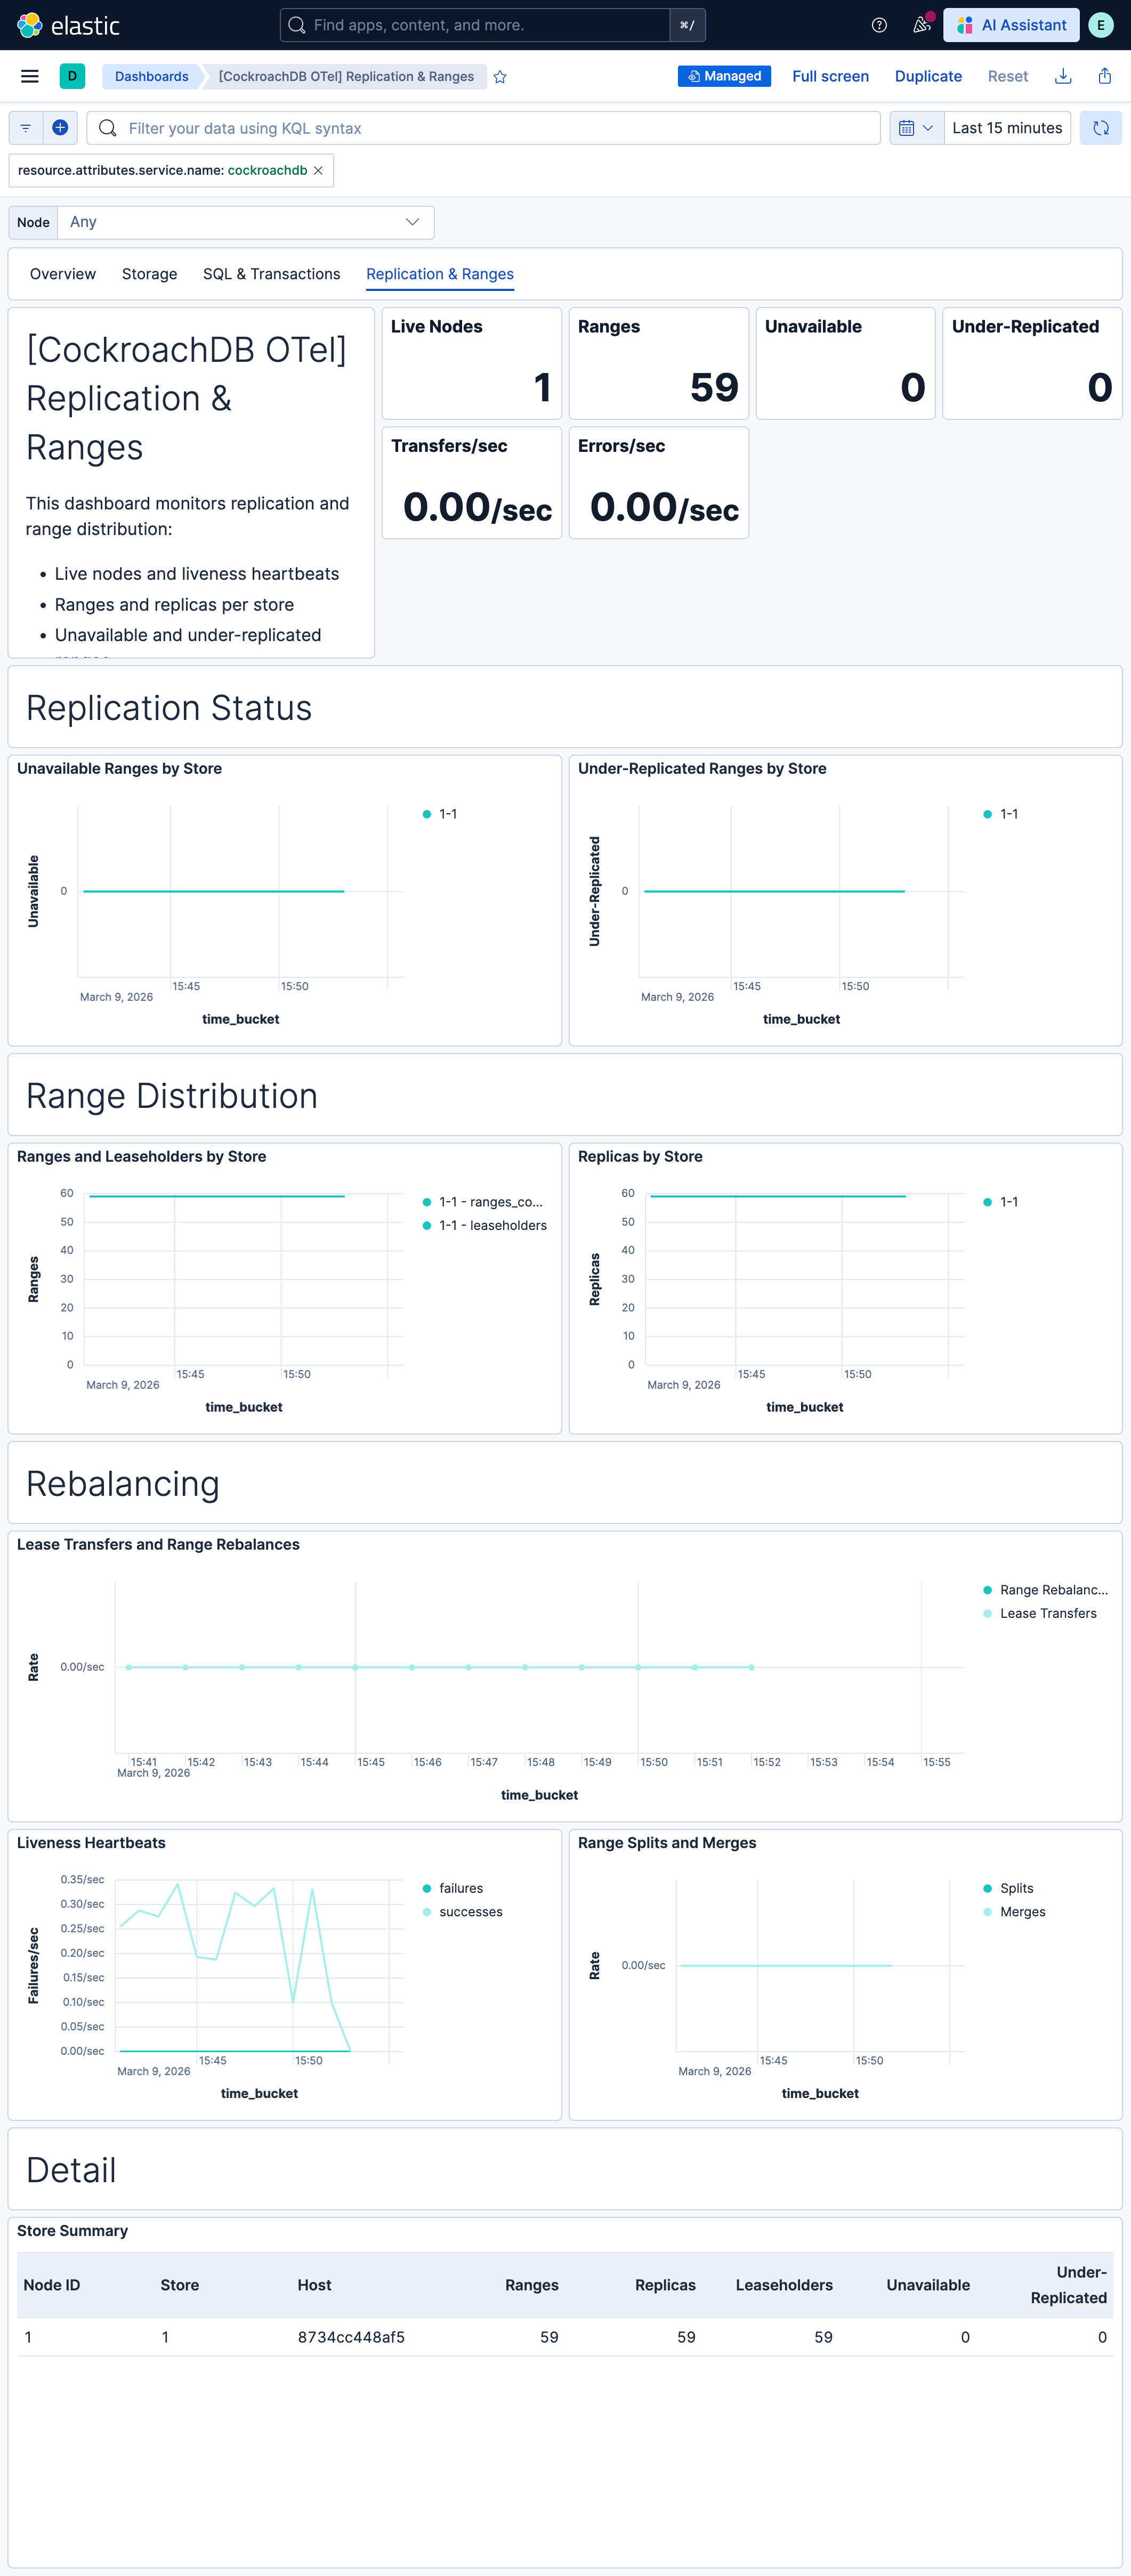
| **[CockroachDB OTel] Replication & Ranges** | Range distribution, replication health, and rebalancing activity. Monitor ranges per store, unavailable/under-replicated ranges, lease transfers, and rebalancing. |
## Alert rules
| Alert | Trigger | Severity |
|---------------------------------------------------------|--------------------------------------------------------------------------|----------|
| **[CockroachDB OTel] Unavailable ranges detected** | One or more ranges have insufficient live replicas for quorum | Critical |
| **[CockroachDB OTel] Under-replicated ranges detected** | One or more ranges have fewer replicas than the replication target | High |
| **[CockroachDB OTel] Liveness heartbeat failures** | Node liveness heartbeats are failing | Critical |
| **[CockroachDB OTel] Storage write stalls detected** | Storage engine is intentionally stalling writes due to disk backpressure | Critical |
| **[CockroachDB OTel] IO admission control overload** | IO admission overload indicator exceeds 1.0 on any store | High |
| **[CockroachDB OTel] Storage capacity usage high** | Storage capacity utilization exceeds 60% on any store | High |
| **[CockroachDB OTel] LSM read amplification high** | Read amplification exceeds 50, indicating unhealthy LSM tree | High |
| **[CockroachDB OTel] L0 file count high** | L0 file count exceeds 1000 on any store | Medium |
| **[CockroachDB OTel] Disk I/O operations queued high** | Disk I/O operations in queue persistently high | High |
| **[CockroachDB OTel] CPU utilization high** | CockroachDB process CPU utilization exceeds 80% | High |
| **[CockroachDB OTel] Runnable goroutines per CPU high** | Runnable goroutines per CPU exceed 30, indicating CPU overload | Medium |
| **[CockroachDB OTel] Unhealthy RPC connections** | One or more unhealthy inter-node RPC connections detected | High |
| **[CockroachDB OTel] Deadlocks detected** | Transaction deadlocks detected on any node | Medium |
## SLO templates
| SLO | Target | Window | Description |
|-------------------------------------------------------------------------------|--------|----------------|--------------------------------------------------------------------------------------------------------------------|
| **[CockroachDB OTel] Admission IO overload under 1.0 99.5% rolling 30 days** | 99.5% | 30-day rolling | Ensures IO admission overload stays below 1.0 for 99.5% of 1-minute intervals over a rolling 30-day window. |
| **[CockroachDB OTel] Storage capacity utilization under 60% rolling 30 days** | 99.5% | 30-day rolling | Ensures storage capacity utilization stays below 60% for 99.5% of 1-minute intervals over a rolling 30-day window. |
| **[CockroachDB OTel] SQL statement success rate 99.5% rolling 30 days** | 99.5% | 30-day rolling | Ensures SQL statement success rate is at least 99.5% for 99.5% of 1-minute intervals over a rolling 30-day window. |
## Screenshots
This integration includes one or more Kibana dashboards that visualizes the data collected by the integration. The screenshots below illustrate how the ingested data is displayed.
## Changelog
| Version | Details | Minimum Kibana version |
|-----------|-----------------------------------------------------------------------------------------------------------------------|------------------------|
| **0.1.0** | **Enhancement** ([View pull request](https://github.com/elastic/integrations/pull/17622))Initial draft of the package | 9.2.1 |