---
title: etcd OpenTelemetry Assets
description: etcd is a distributed, reliable key-value store used as the backing store for service discovery, configuration management, and coordination in distributed...
url: https://docs-v3-preview.elastic.dev/elastic/integration-docs/tree/main/reference/etcd_otel
products:
- Elastic integrations
applies_to:
- Serverless Observability projects: Generally available
- Serverless Security projects: Generally available
- Elastic Stack: Generally available since 9.2
---
# etcd OpenTelemetry Assets
| | |
|-------------------------------------------------------------------------------------------------------------------------------|----------------------------------------------------------------|
| **Version** | 0.1.0 : Beta ([View all](#changelog)) |
| **Subscription level**[What's this?](https://www.elastic.co/subscriptions) | Basic |
| **Developed by**[What's this?](https://docs-v3-preview.elastic.dev/elastic/integration-docs/tree/main/reference/developed-by) | Elastic |
| **Minimum Kibana version(s)** | 9.2.1 |
To use beta integrations, go to the **Integrations** page in Kibana, scroll down, and toggle on the _Display beta integrations_ option.
etcd is a distributed, reliable key-value store used as the backing store for service discovery, configuration management, and coordination in distributed systems. It is the primary data store for Kubernetes, where every cluster state change flows through etcd.
This content pack provides dashboards, alert rules, and SLO templates for monitoring etcd using OpenTelemetry. The assets consume metrics from the Prometheus receiver scraping etcd's `/metrics` endpoint and cover Raft consensus health, storage saturation, gRPC traffic, and resource usage.
## Compatibility
The etcd OpenTelemetry assets have been tested with:
- OpenTelemetry Collector Prometheus receiver with EDOT Collector v9.2.1
- OpenTelemetry Collector Prometheus receiver with OpenTelemetry Collector Contrib v0.146.1
etcd tested against:
- etcd 3.5.x
## Requirements
You need Elasticsearch for storing and searching your data and Kibana for visualizing and managing it. You can use our hosted Elasticsearch Service on Elastic Cloud, which is recommended, or self-manage the Elastic Stack on your own hardware.
## Setup
### Prerequisites
etcd exposes a Prometheus-format metrics endpoint at `/metrics` by default. Ensure the OTel Collector can reach this endpoint on each etcd member. In Kubernetes, the metrics are typically exposed on port 2381 or using a dedicated metrics port. No additional etcd configuration is required.
### Configuration
Configure the OpenTelemetry Collector (or Elastic Agent with the OpenTelemetry integration) to scrape etcd metrics and export them to Elasticsearch. The following example uses the Prometheus receiver and the `elasticsearch/otel` exporter with `mapping.mode: otel`.
| Placeholder | Description | Example |
|---------------------------------|-----------------------------------------------|-------------------------------------------------------------|
| `` | List of etcd metrics endpoints (host:port) | `etcd0:2381`, `etcd1:2381`, `etcd2:2381` |
| `${env:ELASTICSEARCH_ENDPOINT}` | Elasticsearch endpoint URL (from environment) | `https://my-deployment.es.us-central1.gcp.cloud.es.io:9243` |
| `${env:ELASTICSEARCH_USER}` | Elasticsearch username (from environment) | — |
| `${env:ELASTICSEARCH_PASSWORD}` | Elasticsearch password (from environment) | — |
```yaml
receivers:
prometheus:
config:
scrape_configs:
- job_name: etcd
scrape_interval: 10s
scrape_timeout: 10s
metrics_path: /metrics
static_configs:
- targets: []
processors:
resource/dataset:
attributes:
- key: data_stream.dataset
value: etcd.otel
action: upsert
batch:
timeout: 10s
send_batch_size: 1024
exporters:
elasticsearch/otel:
endpoints: [${env:ELASTICSEARCH_ENDPOINT}]
user: ${env:ELASTICSEARCH_USER}
password: ${env:ELASTICSEARCH_PASSWORD}
mapping:
mode: otel
metrics_dynamic_index:
enabled: true
service:
pipelines:
metrics:
receivers: [prometheus]
processors: [resource/dataset, batch]
exporters: [elasticsearch/otel]
```
## Reference
### Metrics
Refer to the [Prometheus receiver metadata](https://github.com/open-telemetry/opentelemetry-collector-contrib/blob/main/receiver/prometheusreceiver/metadata.yaml) and [etcd metrics documentation](https://etcd.io/docs/latest/op-guide/monitoring/) for details on the metrics produced when scraping etcd's `/metrics` endpoint. The assets use metrics such as `etcd_server_has_leader`, `etcd_server_proposals_*`, `etcd_mvcc_*`, `grpc_server_handled_total`, and `process_*`.
## Dashboards
| Dashboard | Description |
|--------------------------------|--------------------------------------------------------------------------------------------------------------------------------|
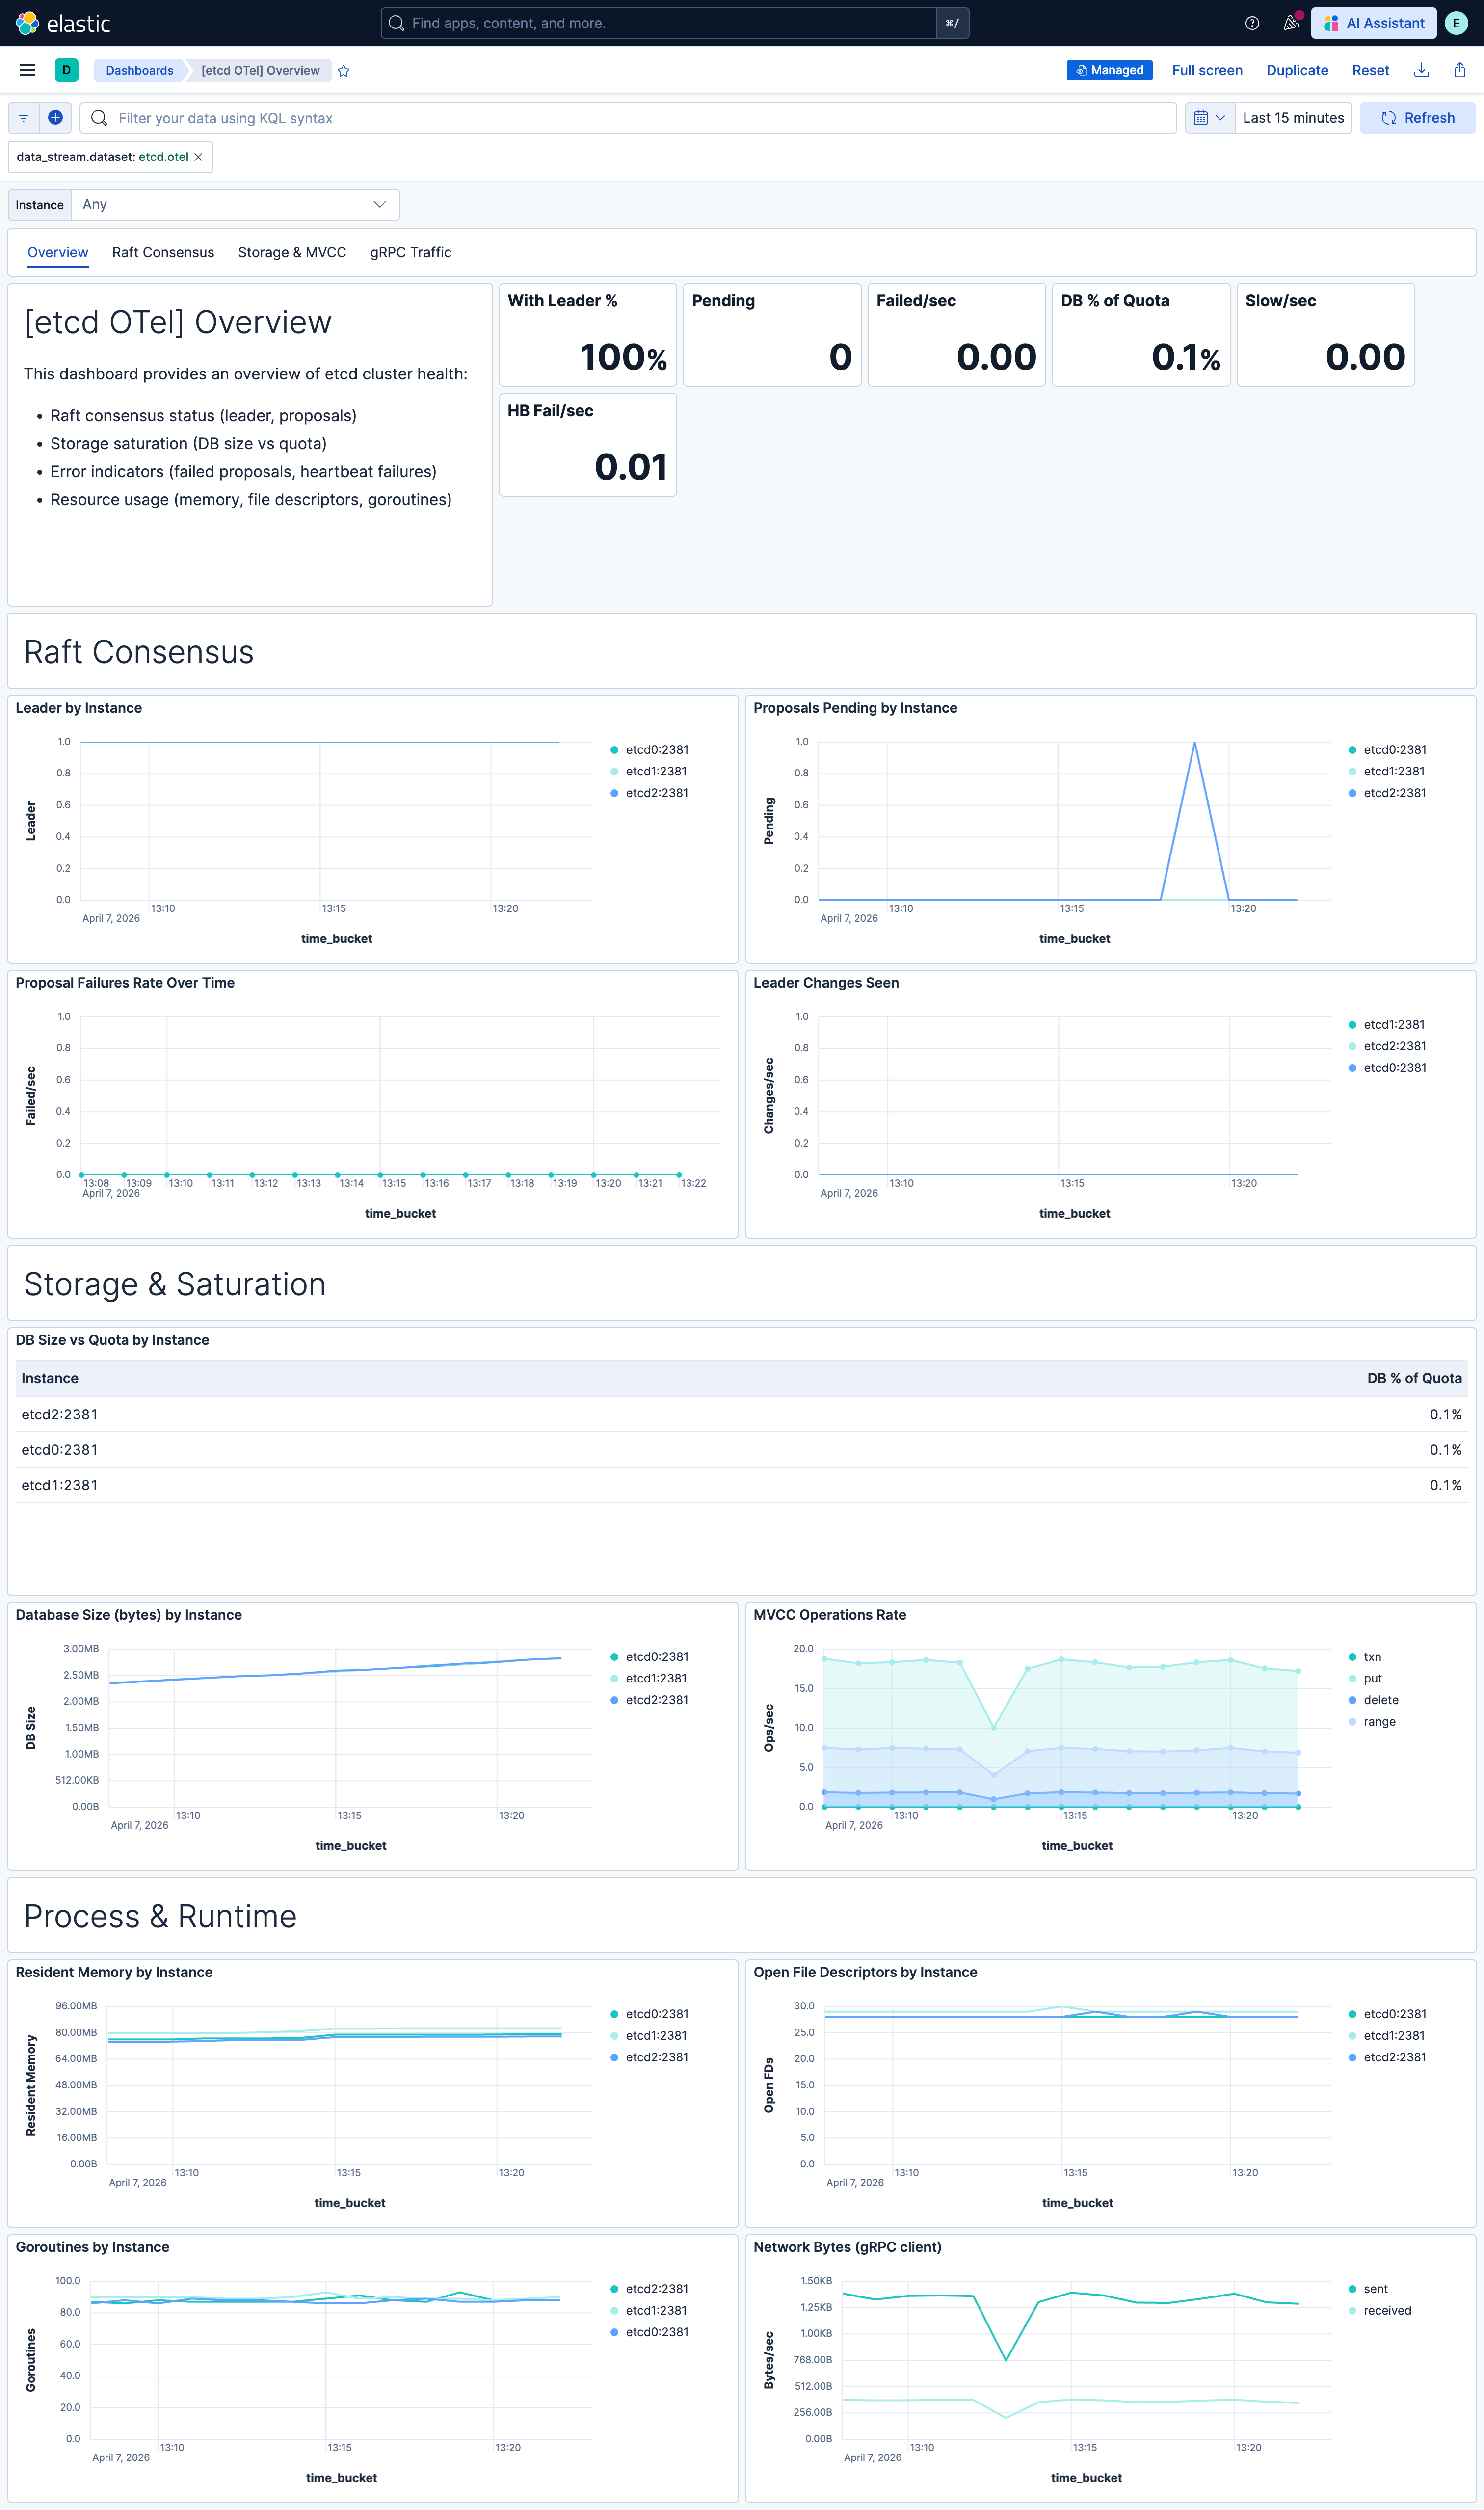
| **[etcd OTel] Overview** | Overview of etcd cluster health: Raft consensus, storage saturation, proposal rates, error indicators, and resource usage. |
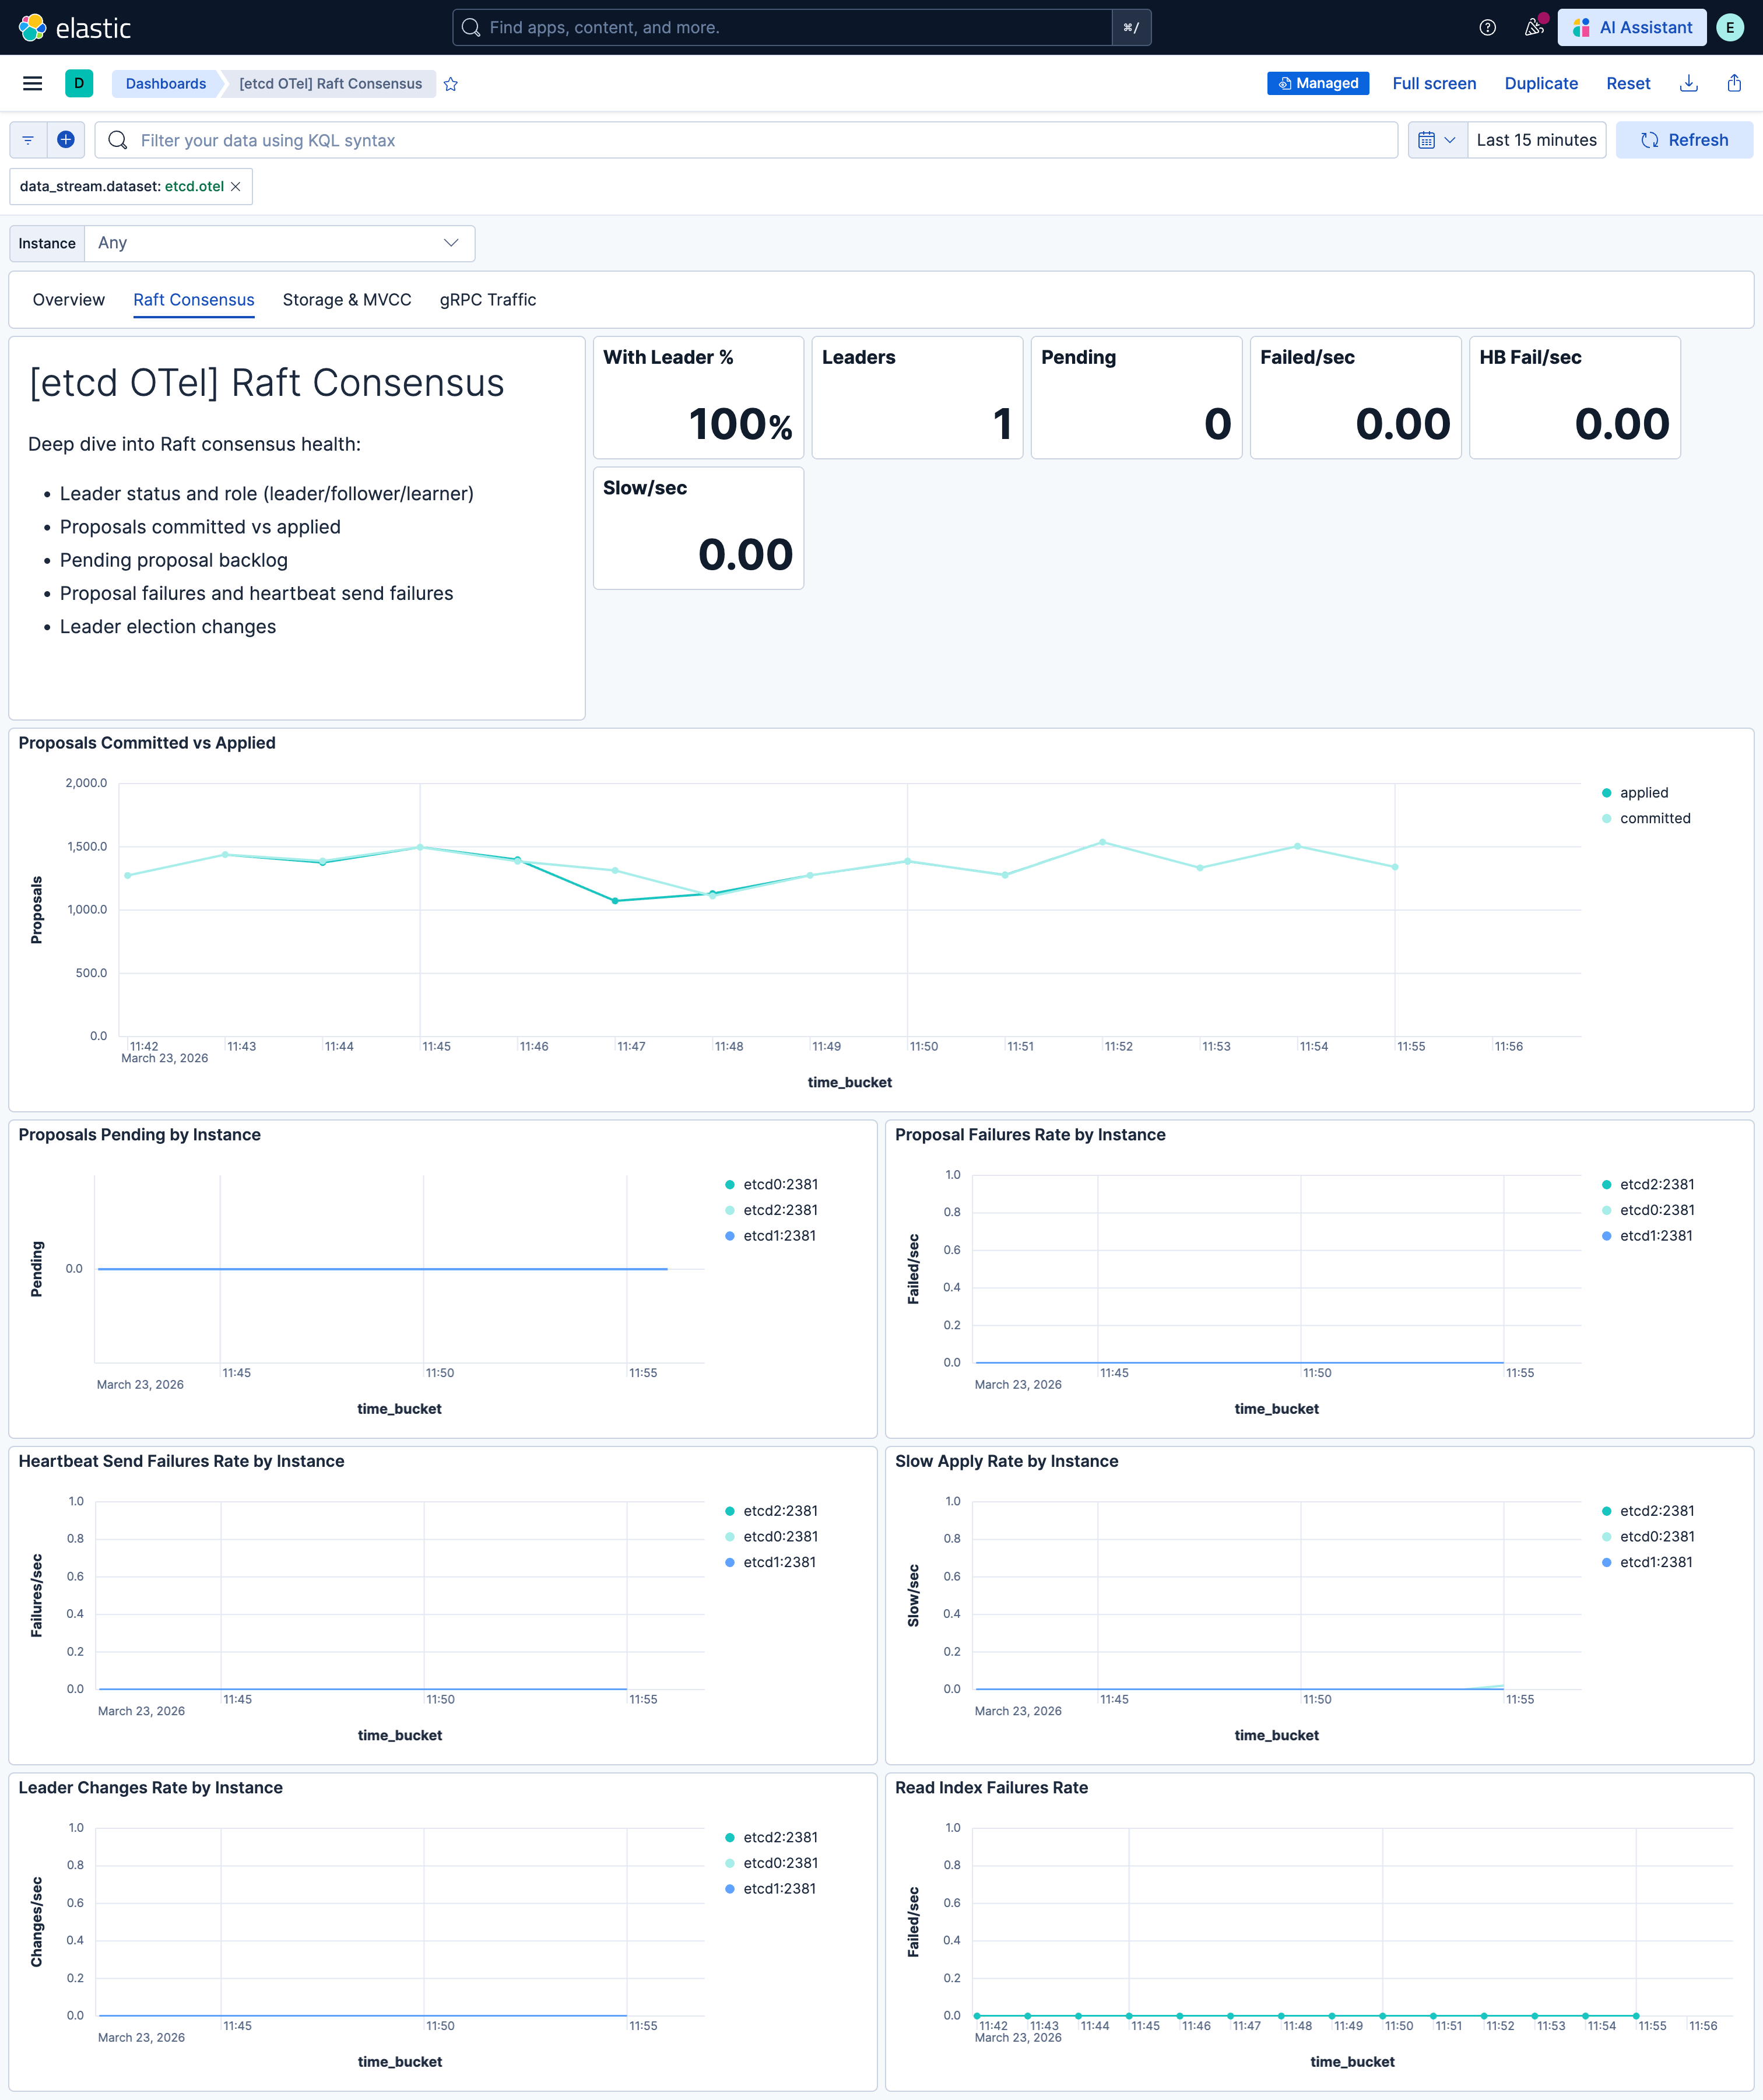
| **[etcd OTel] Raft Consensus** | Raft consensus metrics: leader status, proposals committed/applied, pending backlog, failures, heartbeats, and leader changes. |
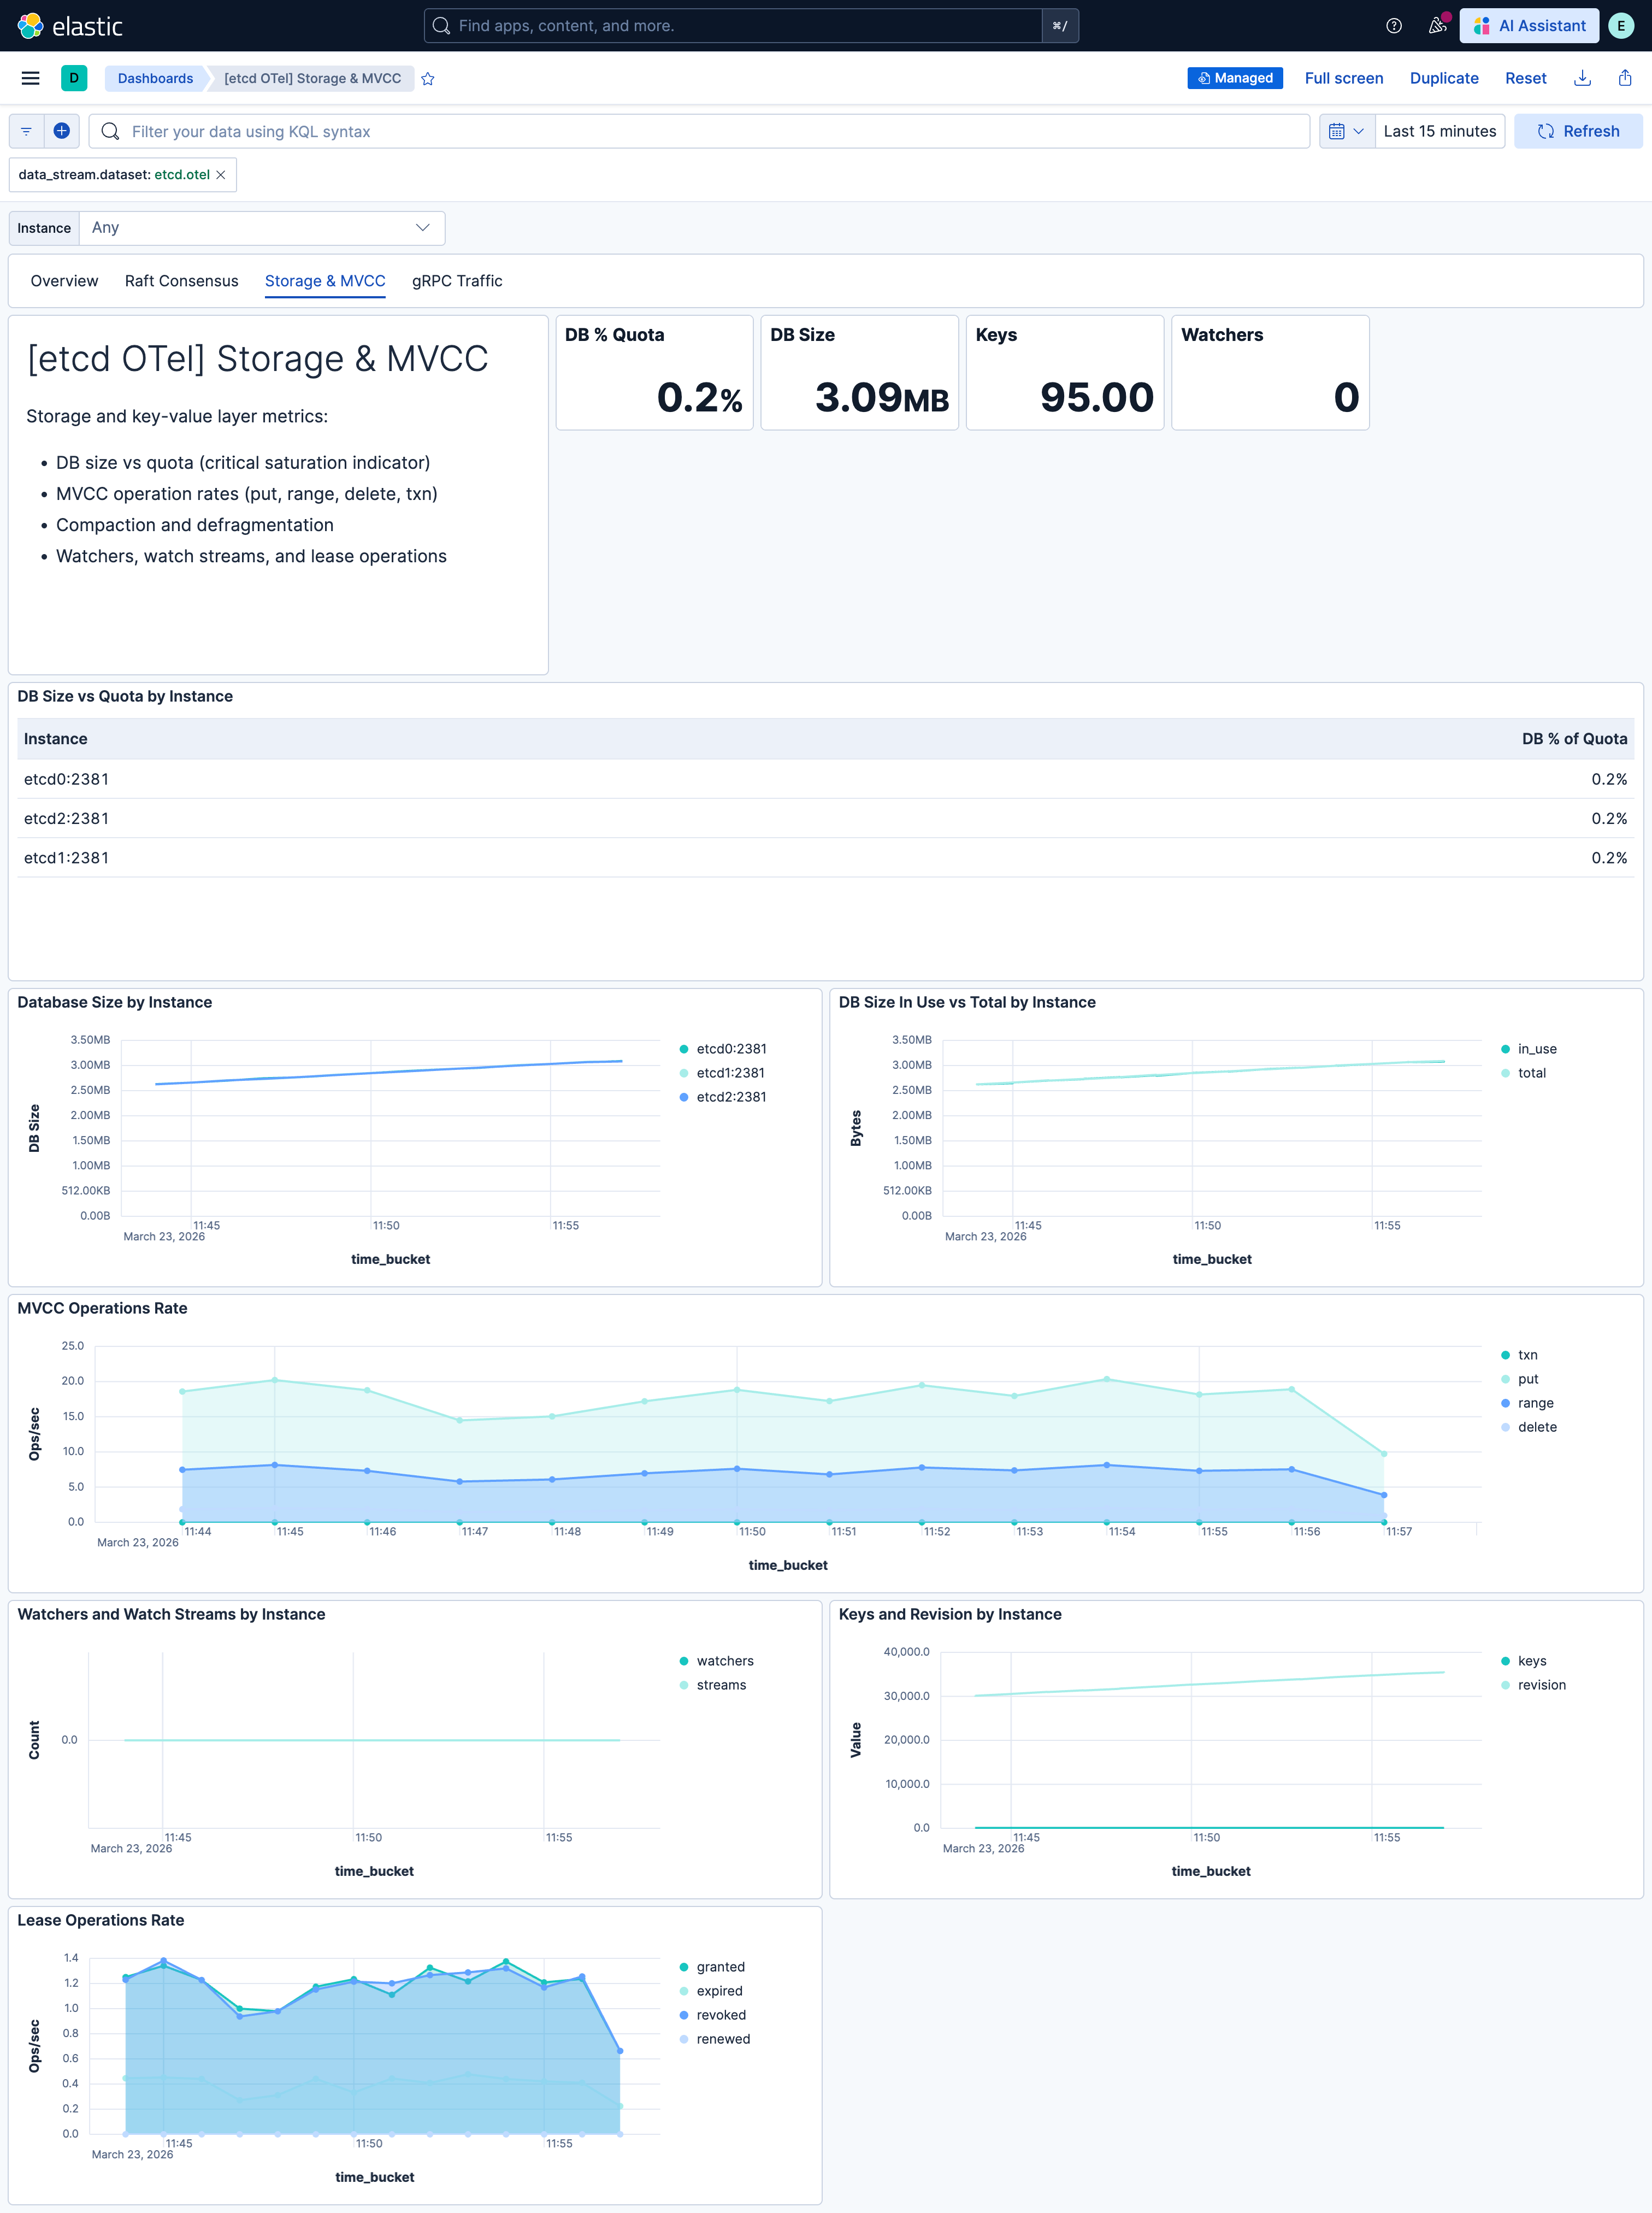
| **[etcd OTel] Storage & MVCC** | Storage metrics: DB size vs quota, MVCC operations, compaction, watchers, and disk usage. |
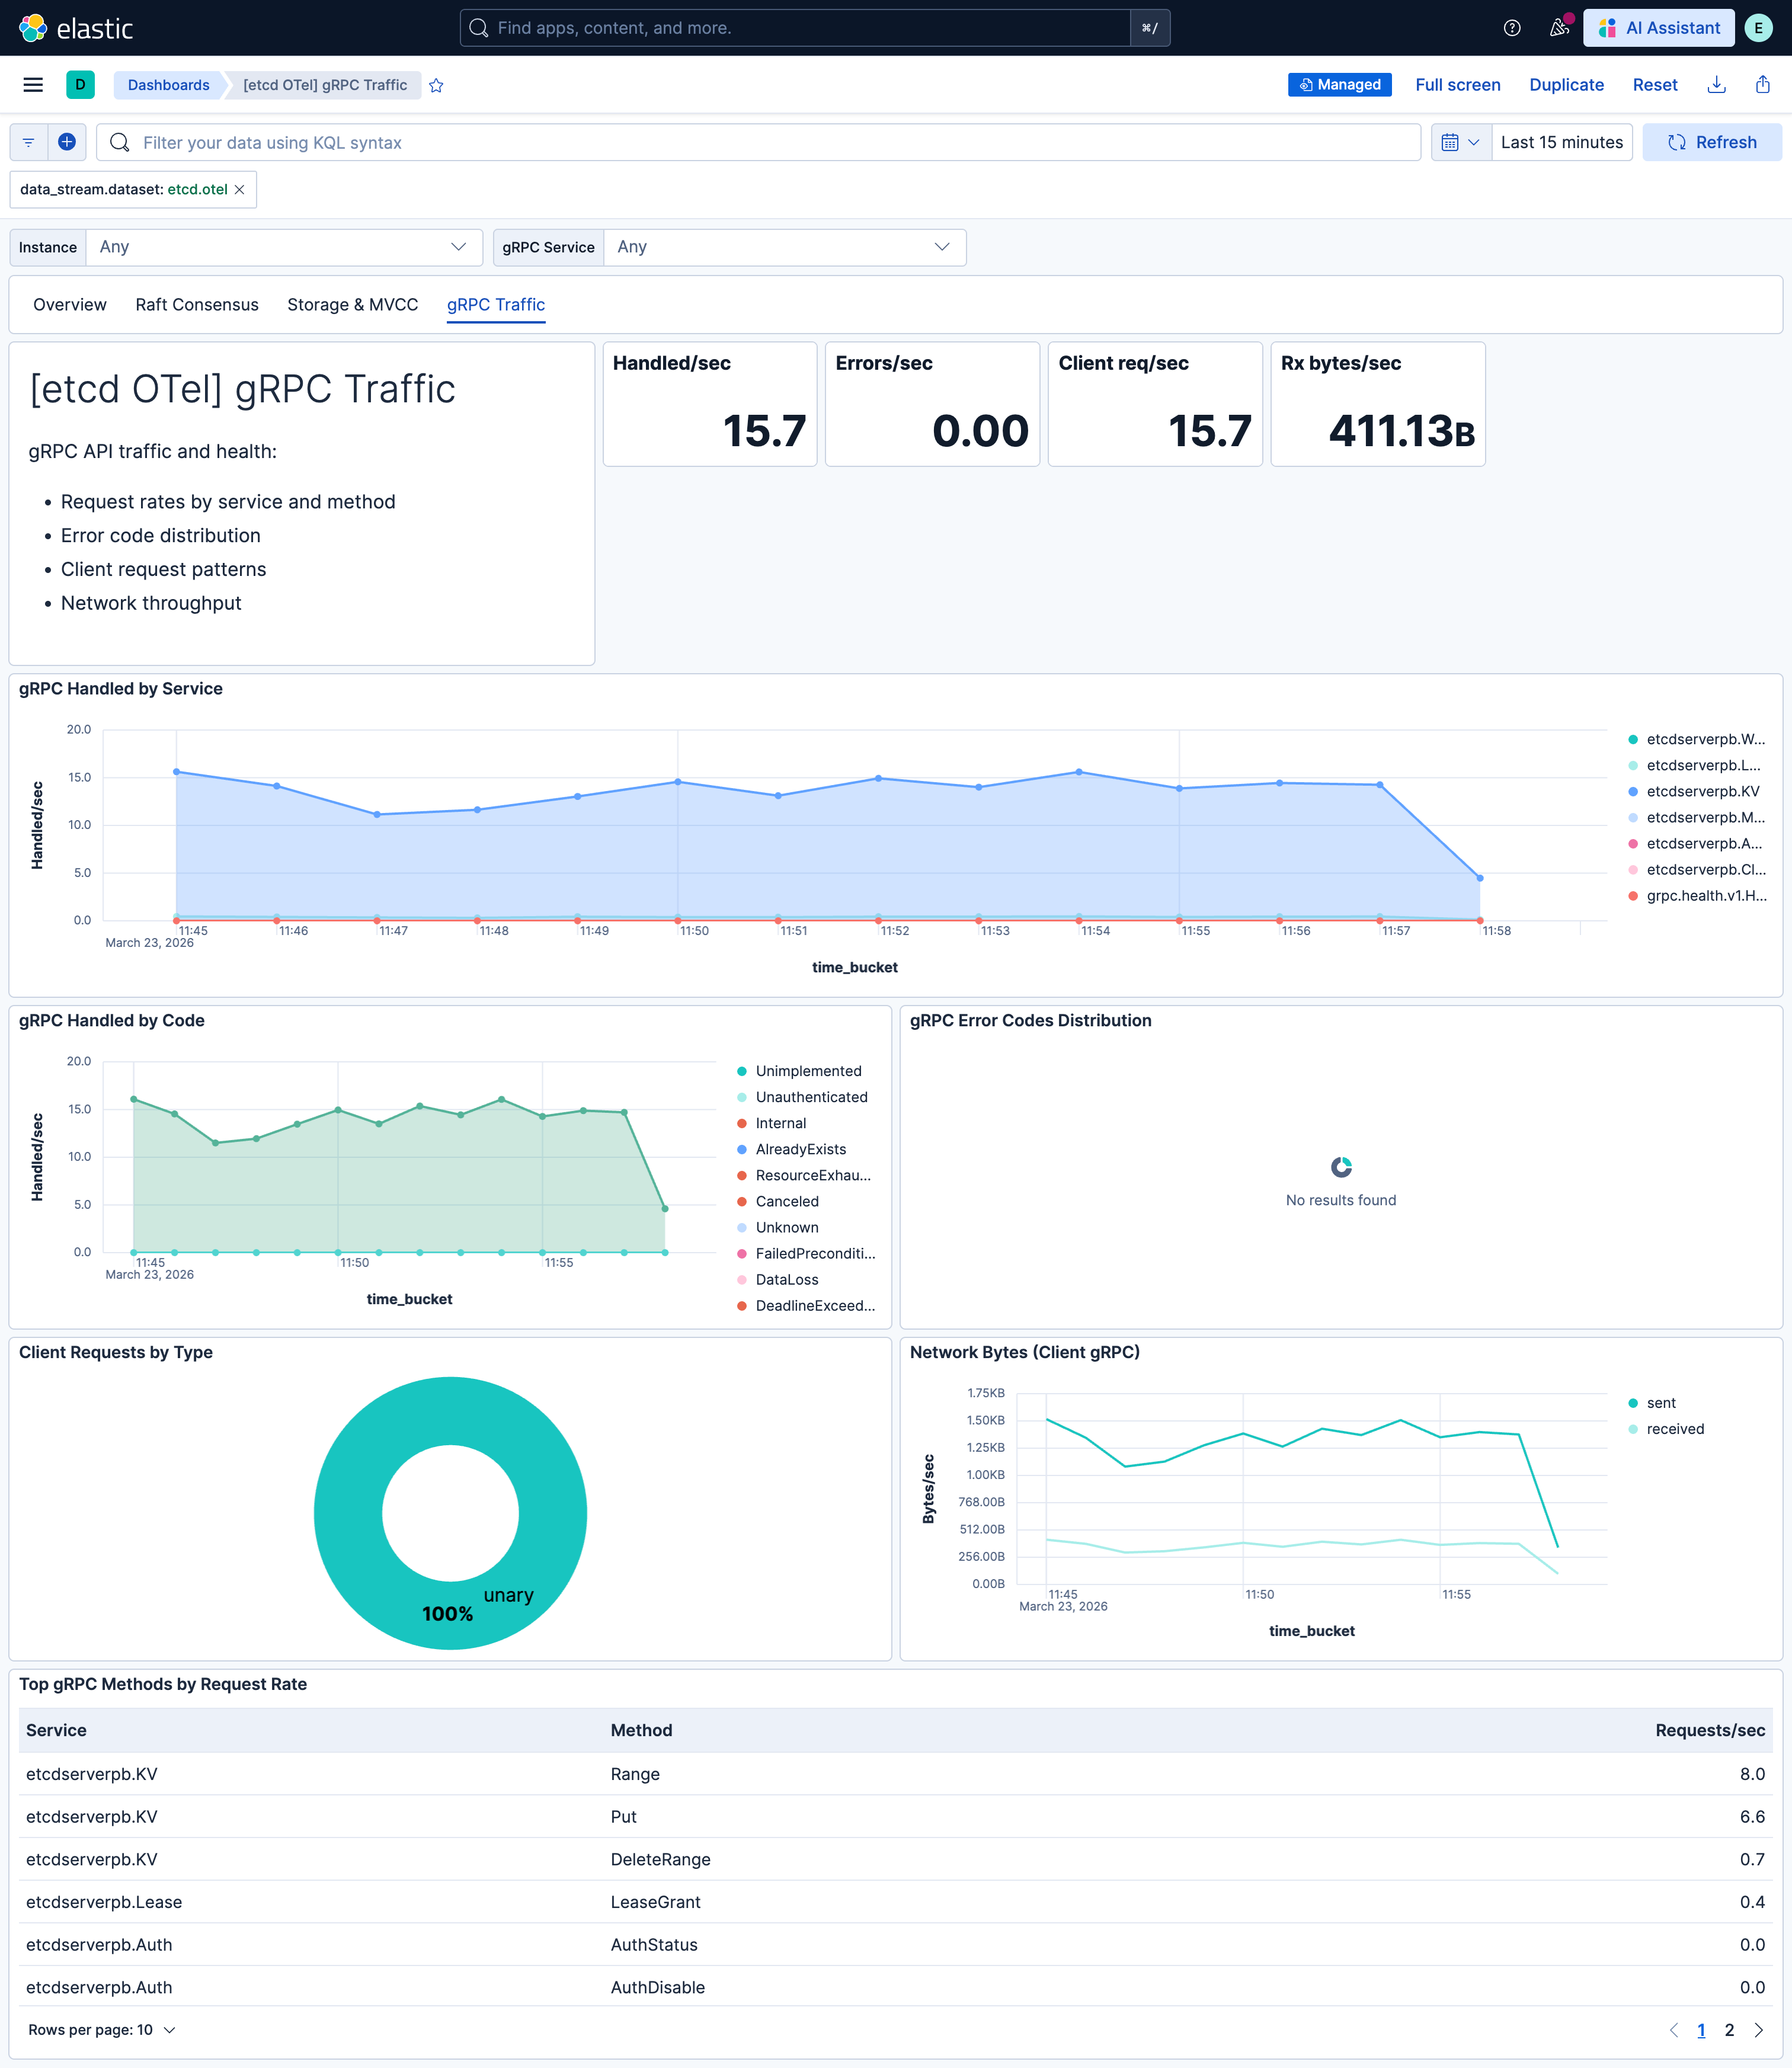
| **[etcd OTel] gRPC Traffic** | gRPC server metrics: request rates by service/method, error codes, and client request patterns. |
## Alert rules
| Alert | Trigger | Severity |
|-------------------------------------------------|-----------------------------------------------------------------------------|----------|
| **[etcd OTel] Scrape target down** | One or more etcd instances report `up=0` (metrics endpoint unreachable). | Critical |
| **[etcd OTel] No leader** | One or more etcd members have no leader (network partition or quorum lost). | Critical |
| **[etcd OTel] Proposal failures** | Any failed Raft proposals in the evaluation window. | Critical |
| **[etcd OTel] Database size approaching quota** | DB size exceeds 90% of backend quota (risk of write rejection). | High |
| **[etcd OTel] File descriptor exhaustion** | Open file descriptors exceed 90% of max (risk of connection failures). | High |
| **[etcd OTel] Pending proposals backlog** | More than 10 proposals pending (leader overload or slow disk). | High |
| **[etcd OTel] Frequent leader elections** | More than one leader change in a 15-minute window. | High |
| **[etcd OTel] Heartbeat send failures** | Leader failing to send heartbeats to followers. | High |
| **[etcd OTel] gRPC errors** | gRPC requests returning non-OK status codes. | Medium |
| **[etcd OTel] Slow apply operations** | Raft applies exceeding expected duration (~100ms). | Medium |
## SLO templates
SLO templates require Elastic Stack version 9.4.0 or later.
| SLO | Target | Window | Description |
|---------------------------------------------------------------------|--------|----------------|-----------------------------------------------------------------------------------------------------------------------------|
| **[etcd OTel] Apply latency (non-slow) rate 99.5% rolling 30 days** | 99.5% | 30-day rolling | Proportion of Raft applies that complete within the expected duration; 99.5% of 1-minute intervals must meet the threshold. |
| **[etcd OTel] Proposal success rate 99.5% rolling 30 days** | 99.5% | 30-day rolling | Raft proposal success rate (committed / (committed + failed)); 99.5% of 1-minute intervals must meet the threshold. |
## Screenshots
This integration includes one or more Kibana dashboards that visualizes the data collected by the integration. The screenshots below illustrate how the ingested data is displayed.
## Changelog
| Version | Details | Minimum Kibana version |
|-----------|-----------------------------------------------------------------------------------------------------------------------|------------------------|
| **0.1.0** | **Enhancement** ([View pull request](https://github.com/elastic/integrations/pull/17757))Initial draft of the package | 9.2.1 |