---
title: HAProxy OpenTelemetry Assets
description: HAProxy is a high-performance TCP/HTTP load balancer and reverse proxy that distributes traffic across backend servers. This content pack provides dashboards,...
url: https://docs-v3-preview.elastic.dev/elastic/integration-docs/tree/main/reference/haproxy_otel
products:
- Elastic integrations
applies_to:
- Serverless Observability projects: Generally available
- Serverless Security projects: Generally available
- Elastic Stack: Generally available since 9.2
---
# HAProxy OpenTelemetry Assets
| | |
|-------------------------------------------------------------------------------------------------------------------------------|----------------------------------------------------------------|
| **Version** | 0.1.0 : Beta ([View all](#changelog)) |
| **Subscription level**[What's this?](https://www.elastic.co/subscriptions) | Basic |
| **Developed by**[What's this?](https://docs-v3-preview.elastic.dev/elastic/integration-docs/tree/main/reference/developed-by) | Elastic |
| **Minimum Kibana version(s)** | 9.2.1 |
To use beta integrations, go to the **Integrations** page in Kibana, scroll down, and toggle on the _Display beta integrations_ option.
HAProxy is a high-performance TCP/HTTP load balancer and reverse proxy that distributes traffic across backend servers. This content pack provides dashboards, alert rules, and SLO templates for monitoring HAProxy via the OpenTelemetry HAProxy receiver, covering traffic, latency, errors, saturation, and backend availability.
## Compatibility
The HAProxy OpenTelemetry assets have been tested with:
- OpenTelemetry `haproxyreceiver` v0.144.0 from OpenTelemetry Collector Contrib.
- HAProxy 3.x
## Requirements
You need Elasticsearch for storing and searching your data and Kibana for visualizing and managing it. You can use our hosted Elasticsearch Service on Elastic Cloud, which is recommended, or self-manage the Elastic Stack on your own hardware.
## Setup
### Prerequisites
Enable the HAProxy stats interface so the collector can poll metrics. Add a `listen` or `frontend` block to your HAProxy configuration:
```
listen stats
bind *:8404
stats enable
stats uri /stats
stats refresh 10s
# Optional: stats auth :
```
For Unix socket access instead of HTTP:
```
listen stats
bind *:8404
stats enable
stats socket /var/run/haproxy.sock mode 660 level admin
```
Verify the stats endpoint. For HTTP: `curl -s "http://localhost:8404/stats;csv"`. For socket: `echo "show stat" | socat stdio /var/run/haproxy.sock`.
### Configuration
Configure the OpenTelemetry Collector or Elastic Observability Distribution (EDOT) Collector to receive HAProxy metrics and export them to Elasticsearch. The following example wires the `haproxy` receiver to the `elasticsearch/otel` exporter.
| Placeholder | Description | Example |
|----------------------|--------------------------------------------------------------|-----------------------------------------------------------------|
| `` | HAProxy stats endpoint: HTTP URL or Unix socket path | `http://localhost:8404/stats` or `file:///var/run/haproxy.sock` |
| `` | Elasticsearch endpoint | `https://my-deployment.es.us-central1.gcp.cloud.es.io:443` |
| `` | Elasticsearch API key (or use `es_username` / `es_password`) | `${env:ES_API_KEY}` |
```yaml
receivers:
haproxy:
endpoint:
collection_interval: 1m
metrics:
haproxy.active:
enabled: true
haproxy.sessions.limit:
enabled: true
haproxy.connections.average_time:
enabled: true
haproxy.requests.average_time:
enabled: true
haproxy.responses.average_time:
enabled: true
haproxy.failed_checks:
enabled: true
exporters:
elasticsearch/otel:
endpoints: []
api_key:
mapping:
mode: otel
service:
pipelines:
metrics:
receivers: [haproxy]
exporters: [elasticsearch/otel]
```
If your stats endpoint uses HTTP basic auth, set `username` and `password` (or `password_file`) under the `haproxy` receiver config.
Enable [Optional Haproxy metrics](https://github.com/open-telemetry/opentelemetry-collector-contrib/blob/main/receiver/haproxyreceiver/documentation.md#optional-metrics) in the config file. HAProxy exposes default metrics automatically, but optional metrics in the OpenTelemetry HAProxy receiver are disabled by default. To send them to Elasticsearch, explicitly enable them in the OTel Collector HAProxy receiver configuration (as shown above).
## Reference
### Metrics
Refer to the [metadata.yaml](https://github.com/open-telemetry/opentelemetry-collector-contrib/blob/main/receiver/haproxyreceiver/metadata.yaml) of the OpenTelemetry HAProxy receiver for details on available metrics.
## Dashboards
| Dashboard | Description |
|-----------------------------|-----------------------------------------------------------------------------------------------------------------------------------------------------|
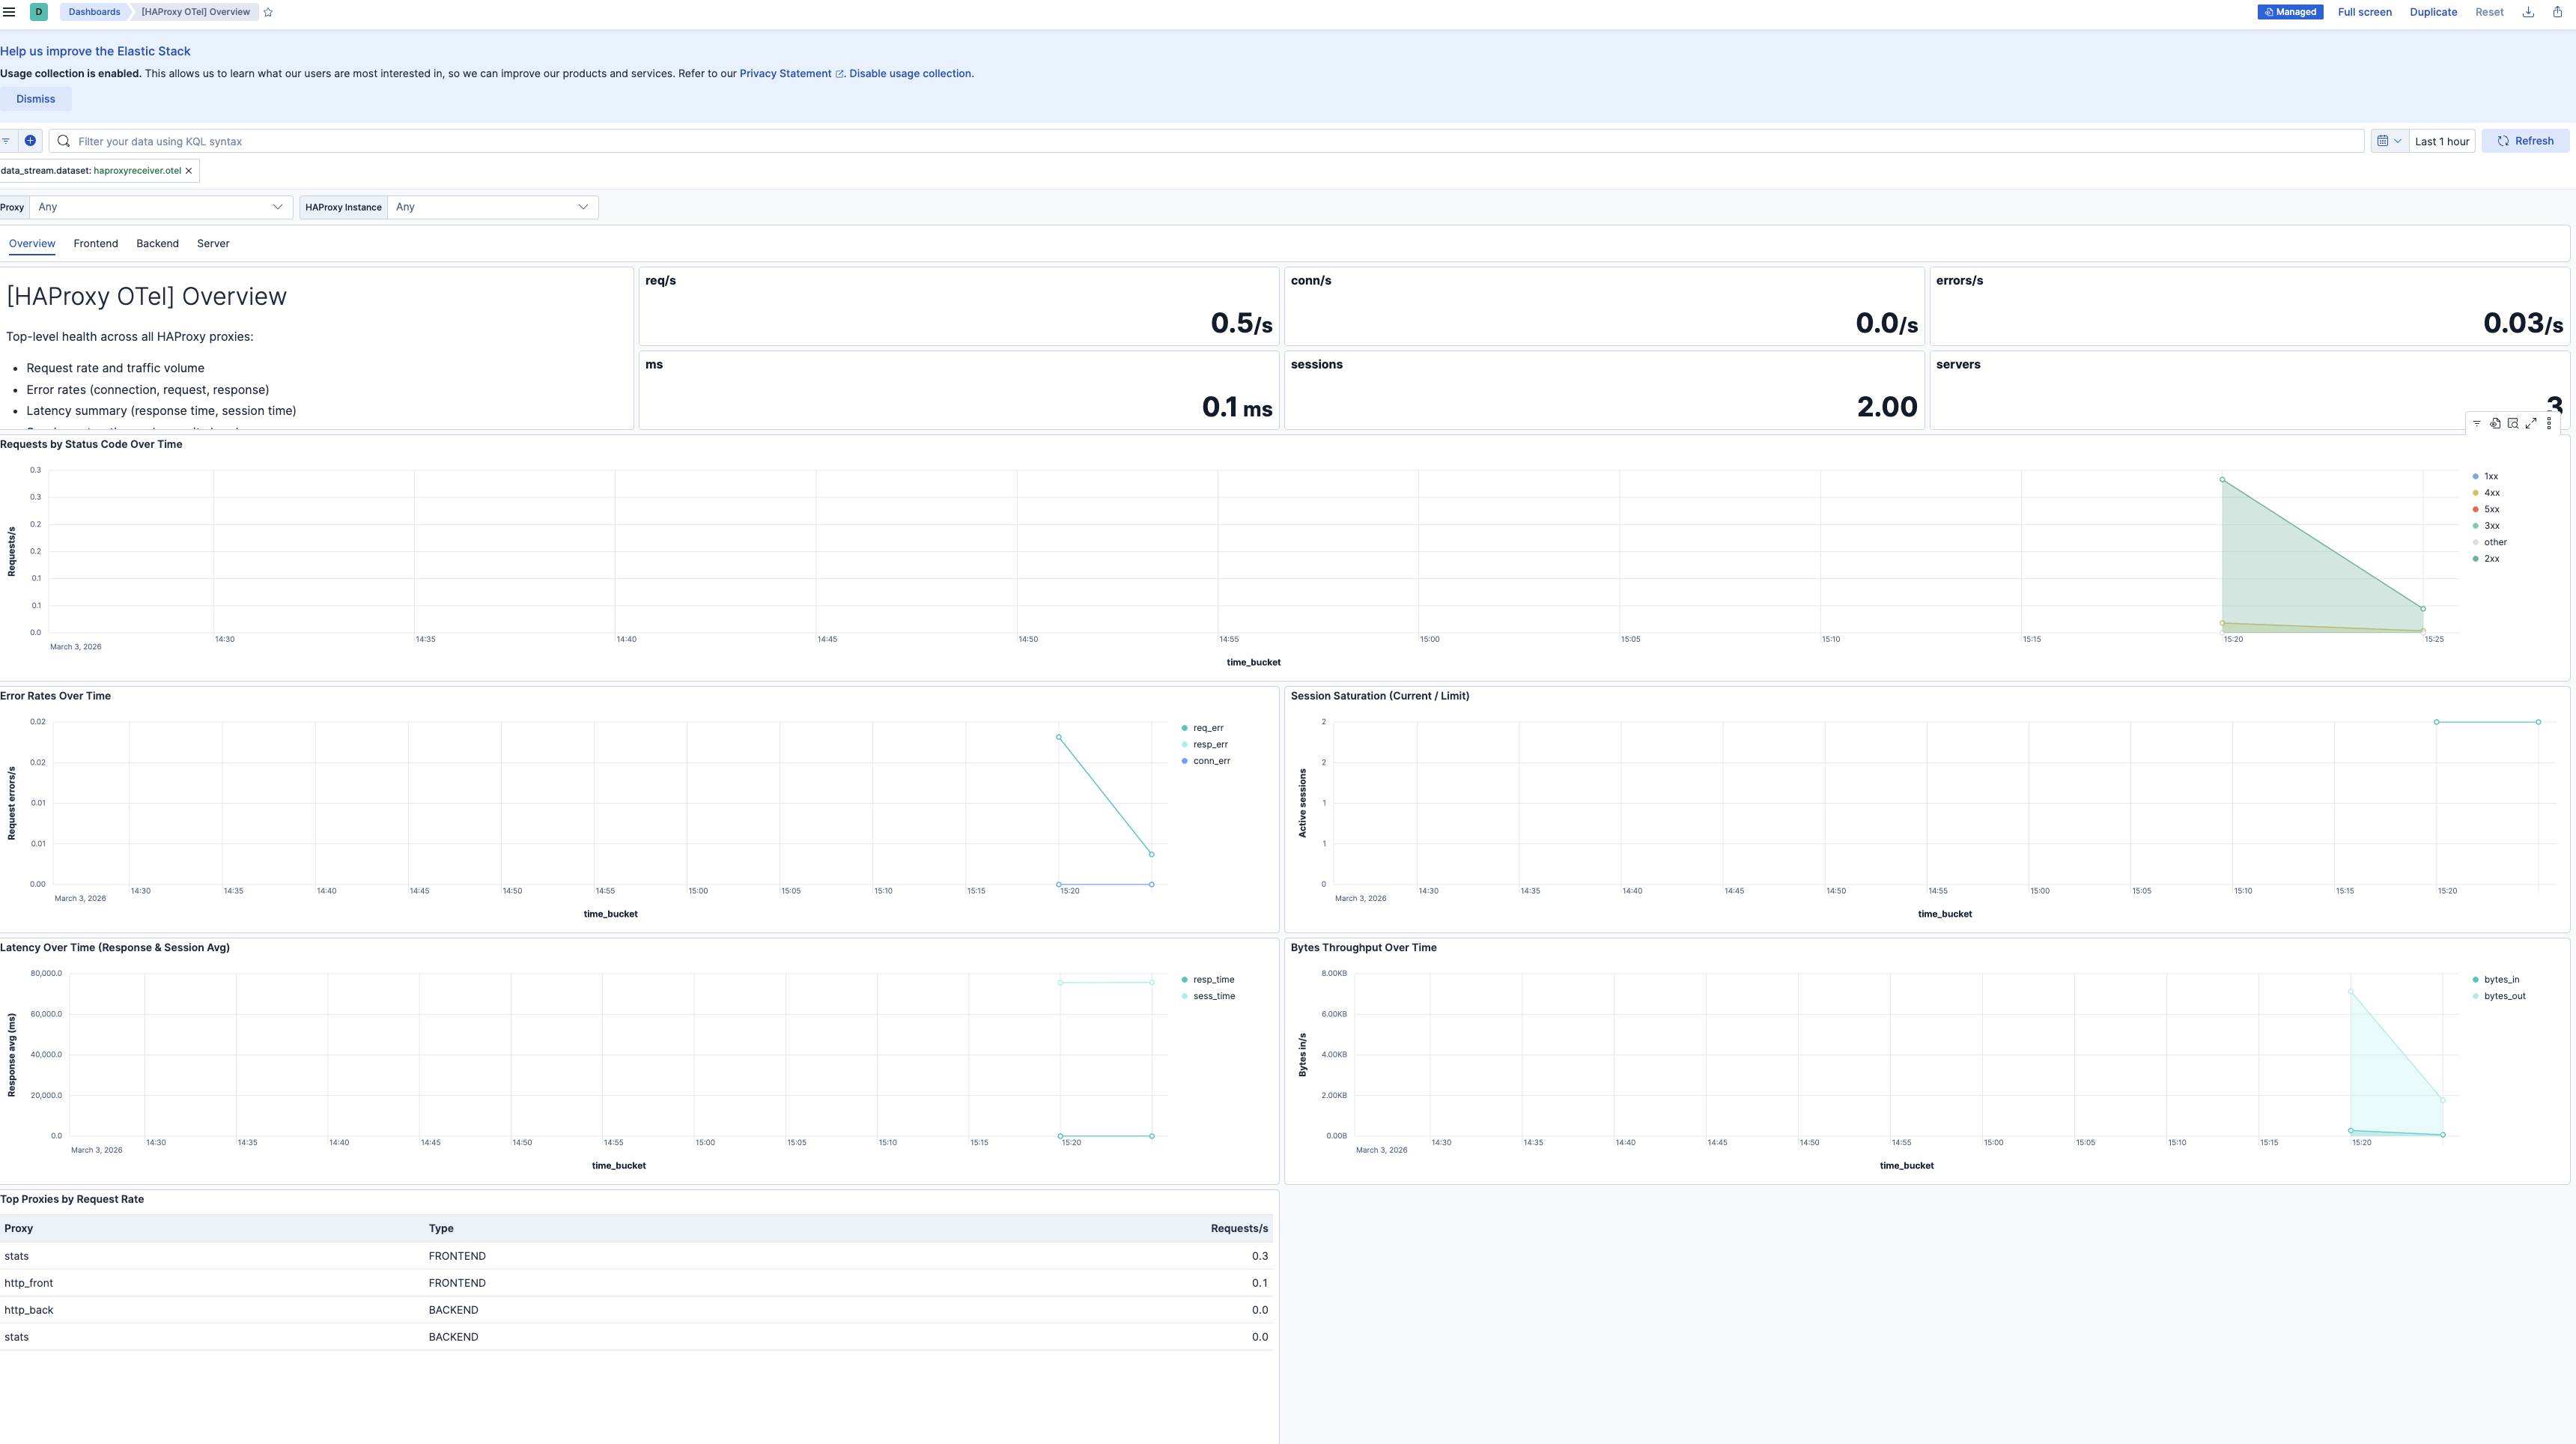
| **[HAProxy OTel] Overview** | Top-level health across all proxies: error rates, traffic volume, latency summary, session saturation, server availability. |
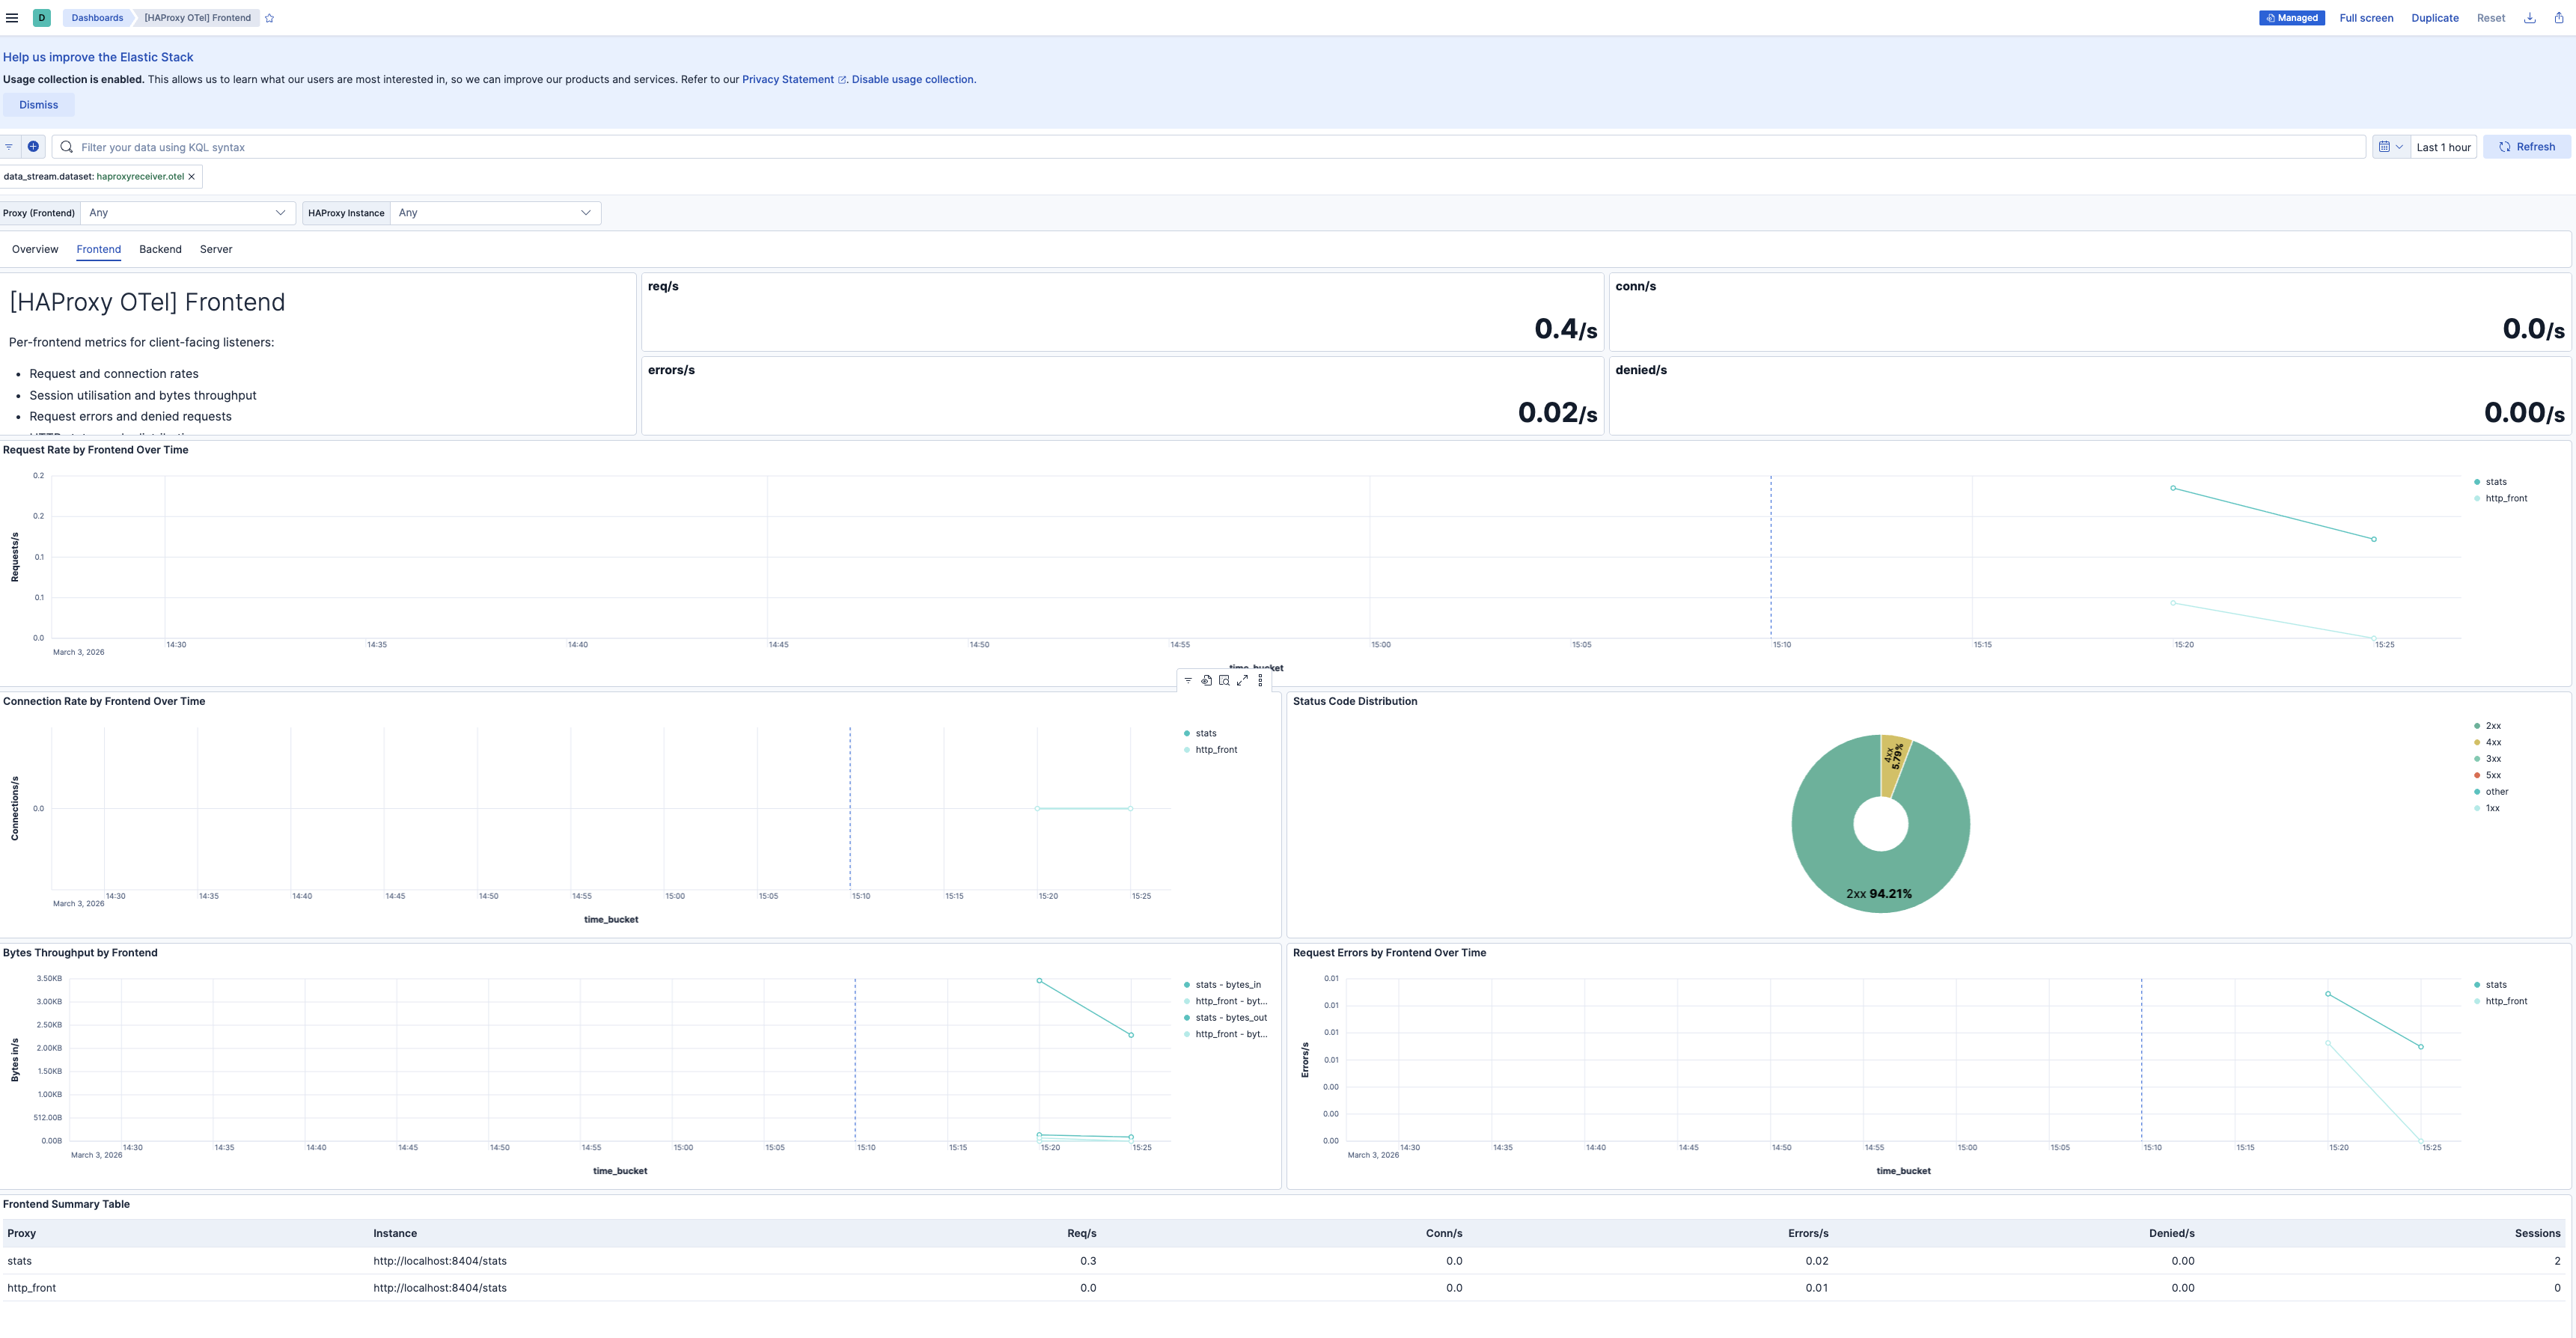
| **[HAProxy OTel] Frontend** | Per-frontend request rates, connection rates, session utilization, bytes throughput, request errors, denied requests, and status code distribution. |
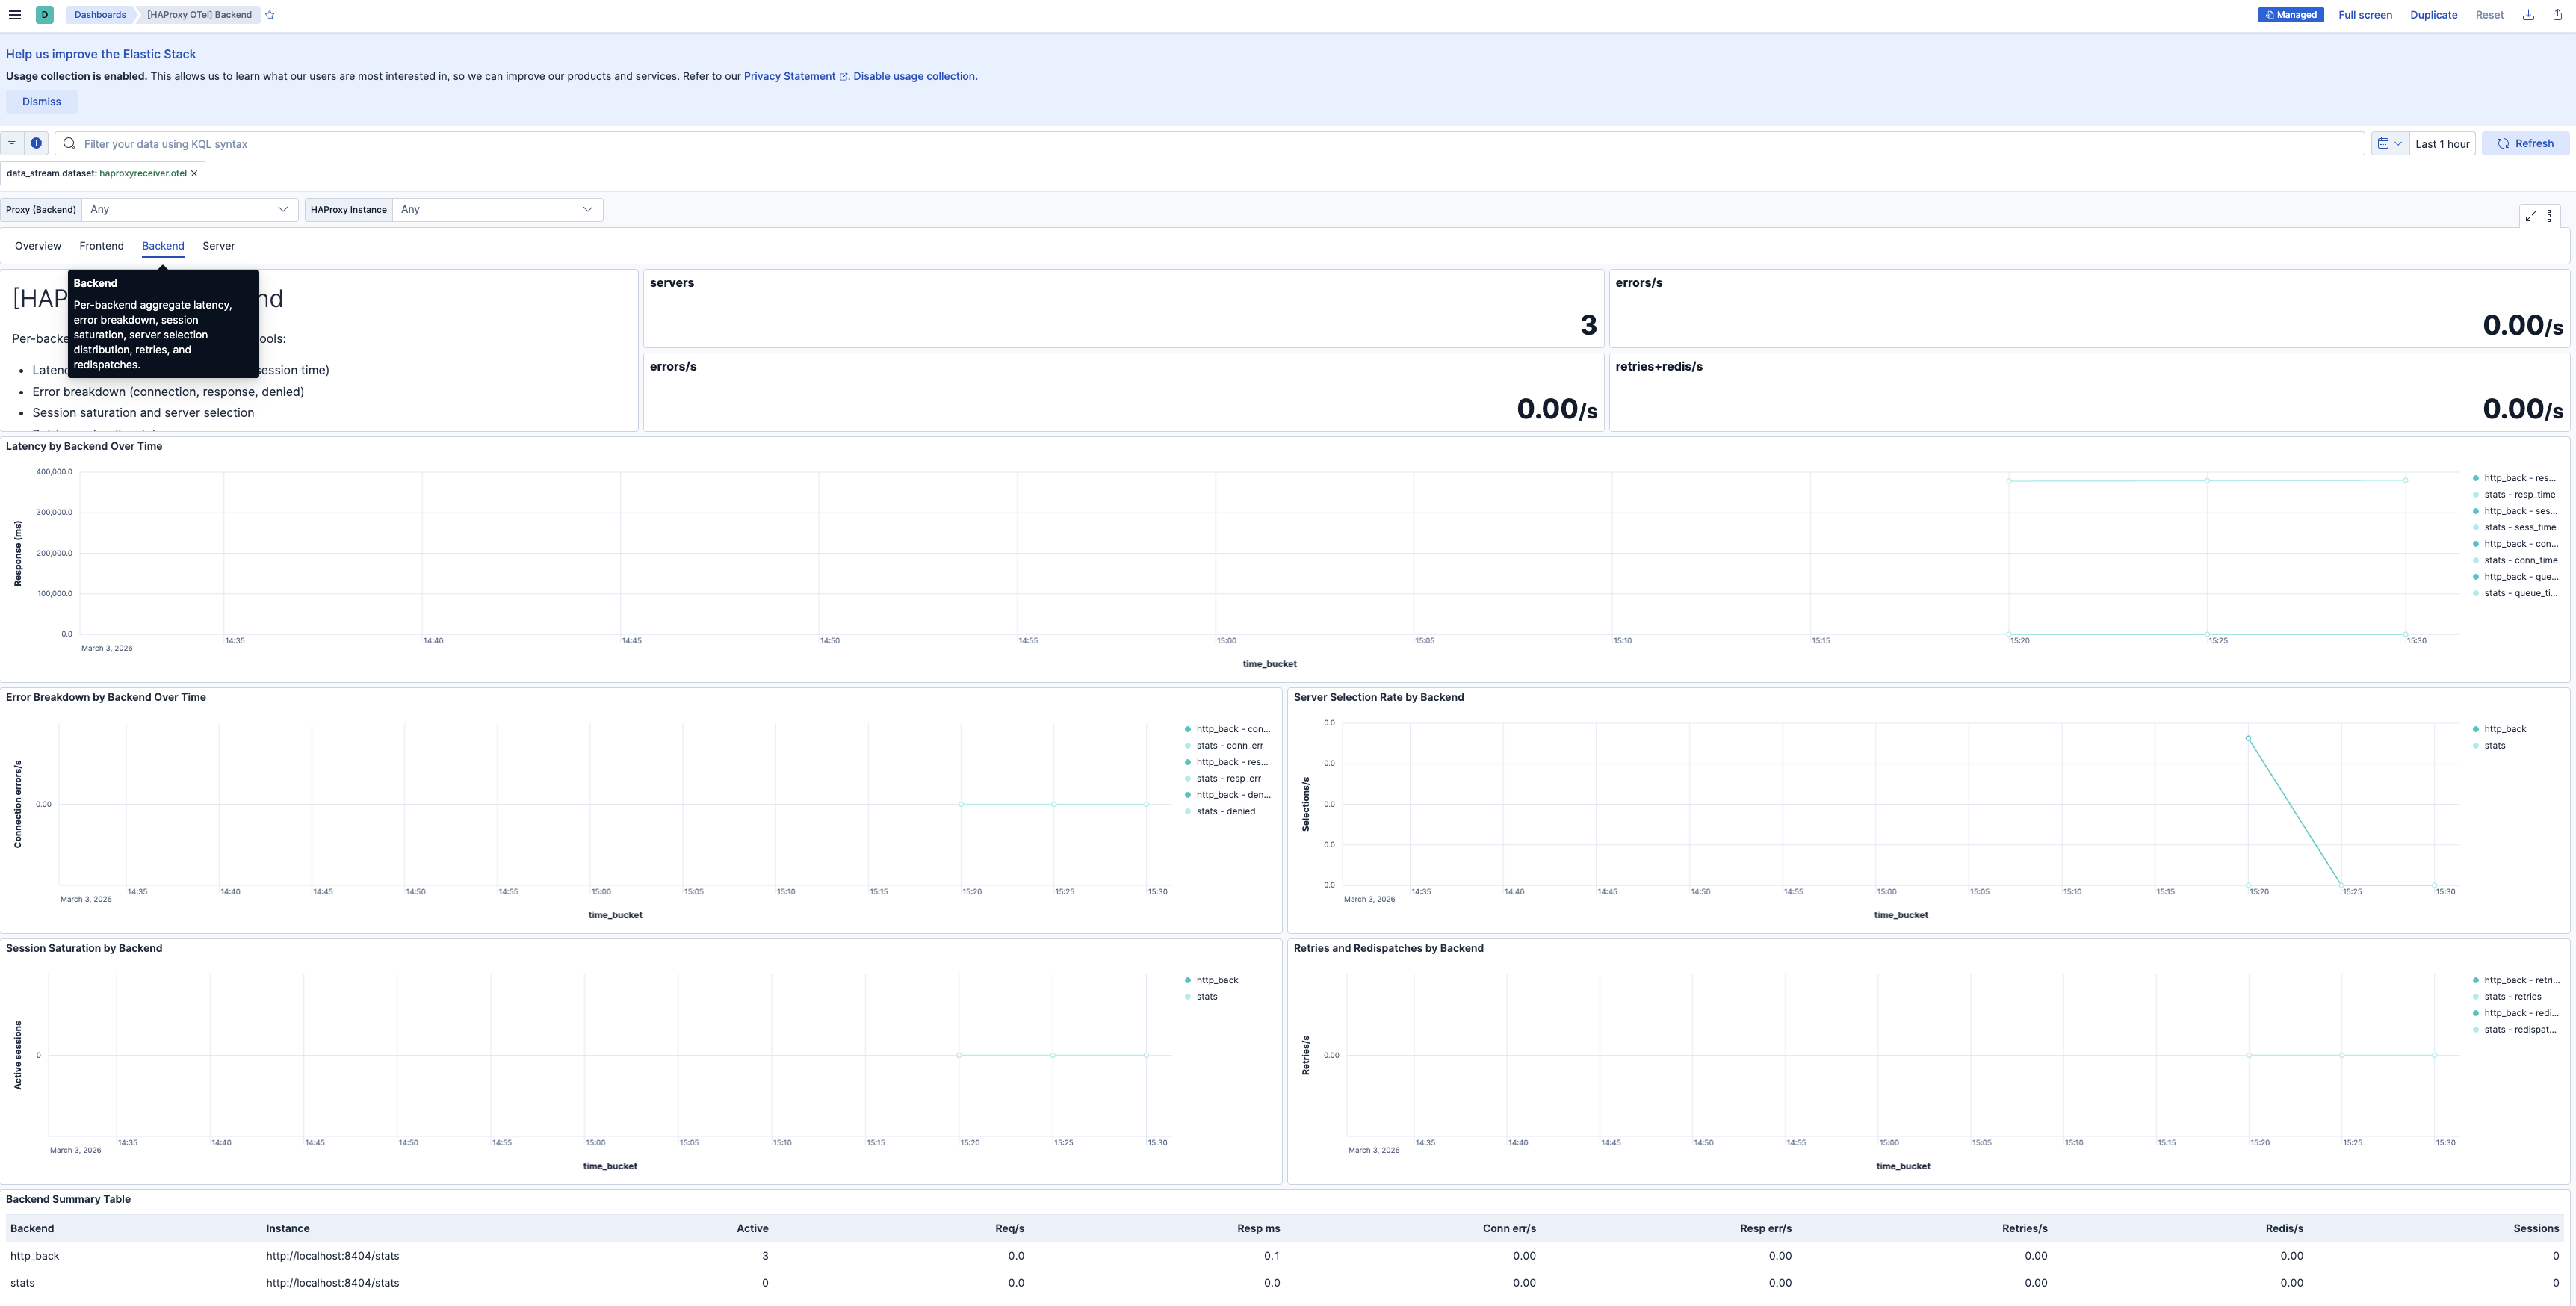
| **[HAProxy OTel] Backend** | Per-backend aggregate latency, error breakdown, session saturation, server selection distribution, retries, and redispatches. |
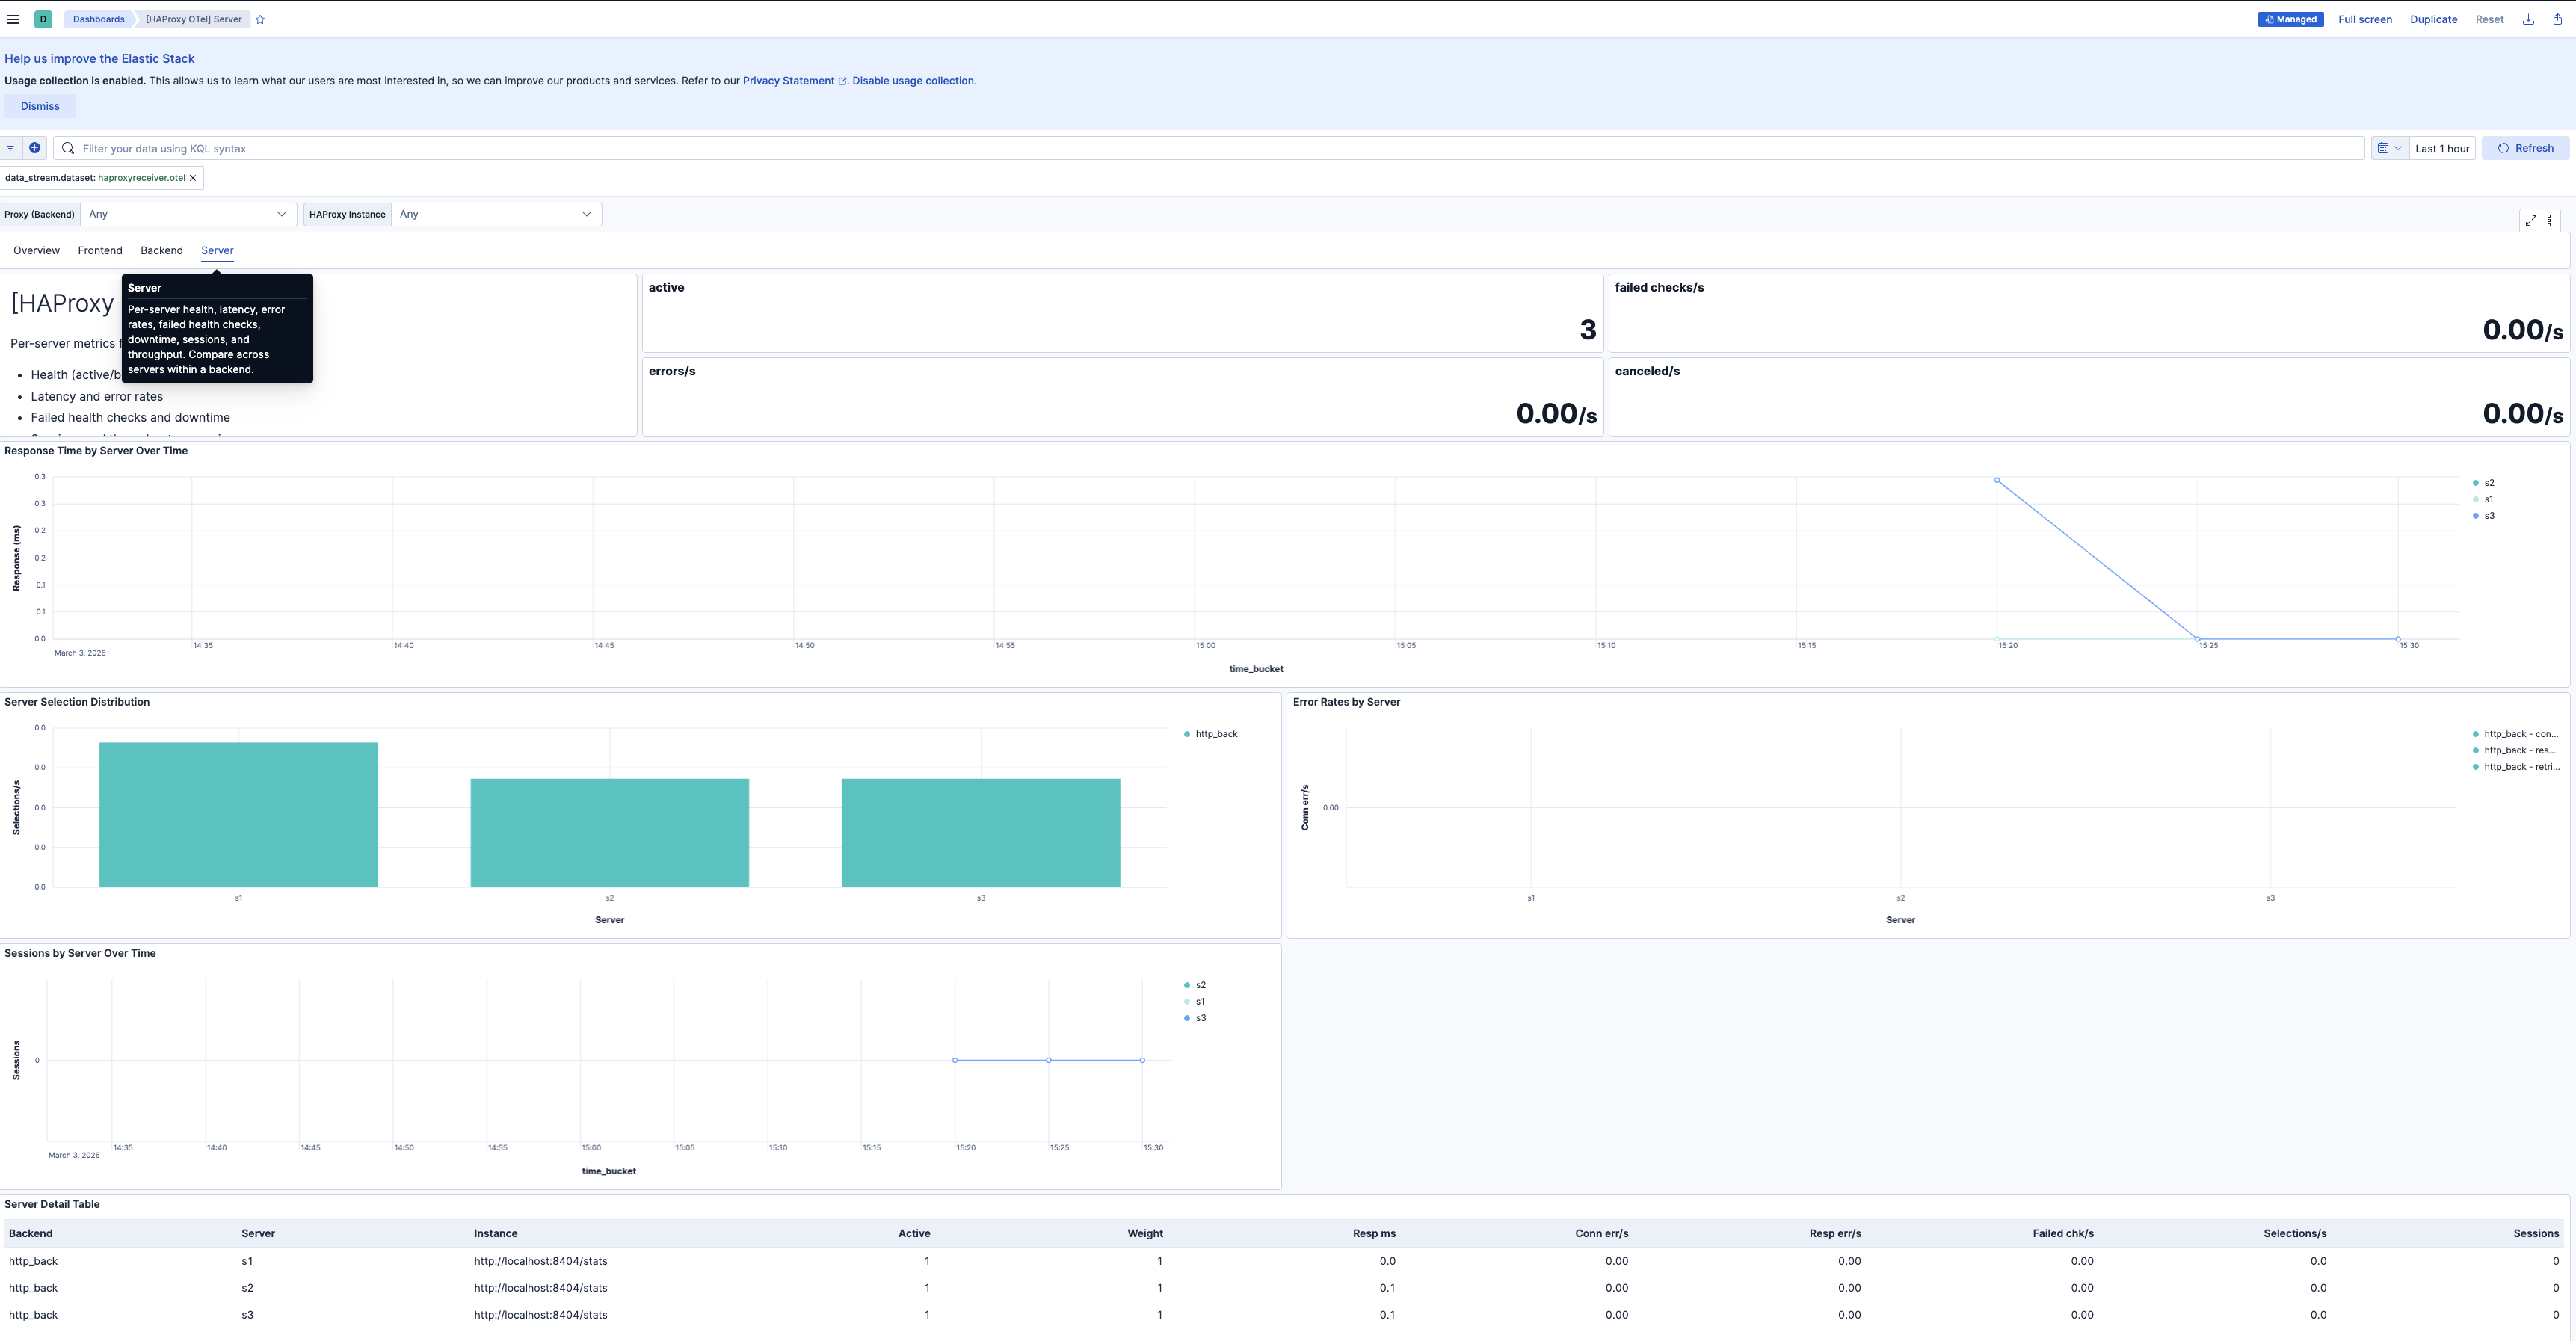
| **[HAProxy OTel] Server** | Per-server health, latency, error rates, failed health checks, downtime, sessions, and throughput. Compare across servers within a backend. |
## Alert rules
| Alert | Trigger | Severity |
|-------------------------------------------------------------|----------------------------------------------------------------------------------------|----------|
| **[HAProxy OTel] Backend has no active servers** | Backend has zero active servers in the evaluation window | Critical |
| **[HAProxy OTel] Connection errors spike** | Connection errors to backend servers exceed threshold in 5-minute window | High |
| **[HAProxy OTel] Request errors spike** | Frontend request errors (malformed, timed out) exceed threshold in 5-minute window | High |
| **[HAProxy OTel] Response errors spike** | Response errors (server aborts, delivery failures) exceed threshold in 5-minute window | High |
| **[HAProxy OTel] Session saturation approaching limit** | Session utilization exceeds 80% of configured limit | High |
| **[HAProxy OTel] High backend connection time** | Backend connection time exceeds 100 ms | Medium |
| **[HAProxy OTel] High backend response time** | Backend response time exceeds 500 ms | Medium |
| **[HAProxy OTel] High backend queue time** | Backend queue time exceeds 10 ms (indicates capacity pressure) | Medium |
| **[HAProxy OTel] Server health check failures** | One or more servers report failed health checks | Medium |
| **[HAProxy OTel] Requests queued at backend** | Requests are queued waiting for an available server | Medium |
| **[HAProxy OTel] Connection retries or redispatches spike** | Retries or redispatches exceed threshold (backend instability signal) | Medium |
## SLO templates
SLO templates require Elastic Stack version 9.4.0 or later.
| SLO | Target | Window | Description |
|----------------------------------------------------------------|--------|----------------|----------------------------------------------------------------------------------------|
| **[HAProxy OTel] Backend availability 99.5% rolling 30 days** | 99.5% | 30-day rolling | Proportion of 1-minute timeslices where each backend has at least one active server. |
| **[HAProxy OTel] Response time latency 99.5% rolling 30 days** | 99.5% | 30-day rolling | Proportion of 1-minute timeslices where average backend response time is below 500 ms. |
| **[HAProxy OTel] Request success rate 99.5% rolling 30 days** | 99.5% | 30-day rolling | Proportion of 1-minute timeslices where non-5xx requests meet the target ratio. |
## Screenshots
This integration includes one or more Kibana dashboards that visualizes the data collected by the integration. The screenshots below illustrate how the ingested data is displayed.
## Changelog
| Version | Details | Minimum Kibana version |
|-----------|--------------------------------------------------------------------------------------------------------------------------------------------|------------------------|
| **0.1.0** | **Enhancement** ([View pull request](https://github.com/elastic/integrations/pull/17189))Initial draft of the Haproxy OTel content package | 9.2.1 |