---
title: IBM MQ OpenTelemetry Assets
description: IBM MQ is an enterprise message-oriented middleware that enables applications to communicate reliably by exchanging messages through queues, supporting...
url: https://docs-v3-preview.elastic.dev/elastic/integration-docs/tree/main/reference/ibmmq_otel
products:
- Elastic integrations
applies_to:
- Serverless Observability projects: Generally available
- Serverless Security projects: Generally available
- Elastic Stack: Generally available since 9.2
---
# IBM MQ OpenTelemetry Assets
| | |
|-------------------------------------------------------------------------------------------------------------------------------|----------------------------------------------------------------|
| **Version** | 0.1.0 : Beta ([View all](#changelog)) |
| **Subscription level**[What's this?](https://www.elastic.co/subscriptions) | Basic |
| **Developed by**[What's this?](https://docs-v3-preview.elastic.dev/elastic/integration-docs/tree/main/reference/developed-by) | Elastic |
| **Minimum Kibana version(s)** | 9.2.1 |
To use beta integrations, go to the **Integrations** page in Kibana, scroll down, and toggle on the _Display beta integrations_ option.
IBM MQ is an enterprise message-oriented middleware that enables applications to communicate reliably by exchanging messages through queues, supporting both point-to-point and publish/subscribe messaging patterns.
These assets provide dashboards, alert rules, and SLO templates for monitoring IBM MQ queue managers using metrics collected via the OpenTelemetry Prometheus receiver scraping the IBM MQ Prometheus exporter. They cover message throughput, transaction health, API error rates, log subsystem performance, filesystem capacity, and compute resource utilization.
## Compatibility
The IBM MQ OpenTelemetry assets have been tested with:
- OpenTelemetry `prometheusreceiver` v0.146.0 from OpenTelemetry Collector Contrib.
- IBM MQ v9.4.5.0
## Requirements
You need Elasticsearch for storing and searching your data and Kibana for visualizing and managing it.
You can use our hosted Elasticsearch Service on Elastic Cloud, which is recommended, or self-manage
the Elastic Stack on your own hardware.
## Setup
### Prerequisites
You must have the [IBM MQ Prometheus exporter](https://github.com/ibm-messaging/mq-metric-samples) running and configured to expose queue manager metrics. The exporter listens on a configurable HTTP port (default 9157) and serves Prometheus-formatted metrics at the `/metrics` endpoint.
Ensure the exporter has connectivity to your IBM MQ queue manager and is configured with the appropriate credentials and queue manager name.
### Configuration
You can use the [OpenTelemetry Collector](https://opentelemetry.io/docs/collector/) or the [Elastic Distribution of the OpenTelemetry Collector (EDOT Collector)](https://www.elastic.co/docs/current/en/observability/edot-collector) to collect IBM MQ metrics and send them to Elasticsearch.
Placeholders used in the configuration below:
- ``: Your Elasticsearch endpoint (e.g. `https://my-deployment.es.us-east-1.aws.elastic.cloud:443`)
- ``: Your Elasticsearch API key for authentication
- ``: Hostname or IP of the IBM MQ Prometheus exporter (e.g. `localhost`)
- ``: Port of the IBM MQ Prometheus exporter (e.g. `9157`)
```yaml
receivers:
prometheus/ibmmq:
config:
scrape_configs:
- job_name: ibmmq
scrape_interval: 60s
metrics_path: /metrics
params:
format: [prometheus]
scheme: http
static_configs:
- targets:
- ":"
processors:
resource/dataset:
attributes:
- key: data_stream.dataset
value: ibmmq
action: upsert
exporters:
elasticsearch/otel:
endpoints:
- "${env:ES_ENDPOINT}"
api_key: "${env:ES_API_KEY}"
mapping:
mode: otel
service:
pipelines:
metrics:
receivers: [prometheus/ibmmq]
processors: [resource/dataset]
exporters: [elasticsearch/otel]
```
The `scrape_interval` of 60s aligns with the default metric publication interval of the IBM MQ Prometheus exporter. Adjust this value if your exporter is configured with a different collection interval.
## Reference
### Metrics
Refer to the [metadata.yaml](https://github.com/open-telemetry/opentelemetry-collector-contrib/blob/main/receiver/prometheusreceiver/metadata.yaml) of the OpenTelemetry Prometheus receiver for details on available metrics. The specific IBM MQ metrics are published by the [IBM MQ Prometheus exporter](https://github.com/ibm-messaging/mq-metric-samples) and use the `ibmmq_qmgr_` prefix.
## Dashboards
| Dashboard | Description |
|-------------------------------------------|-----------------------------------------------------------------------------------------------------------------------------------------------------------------|
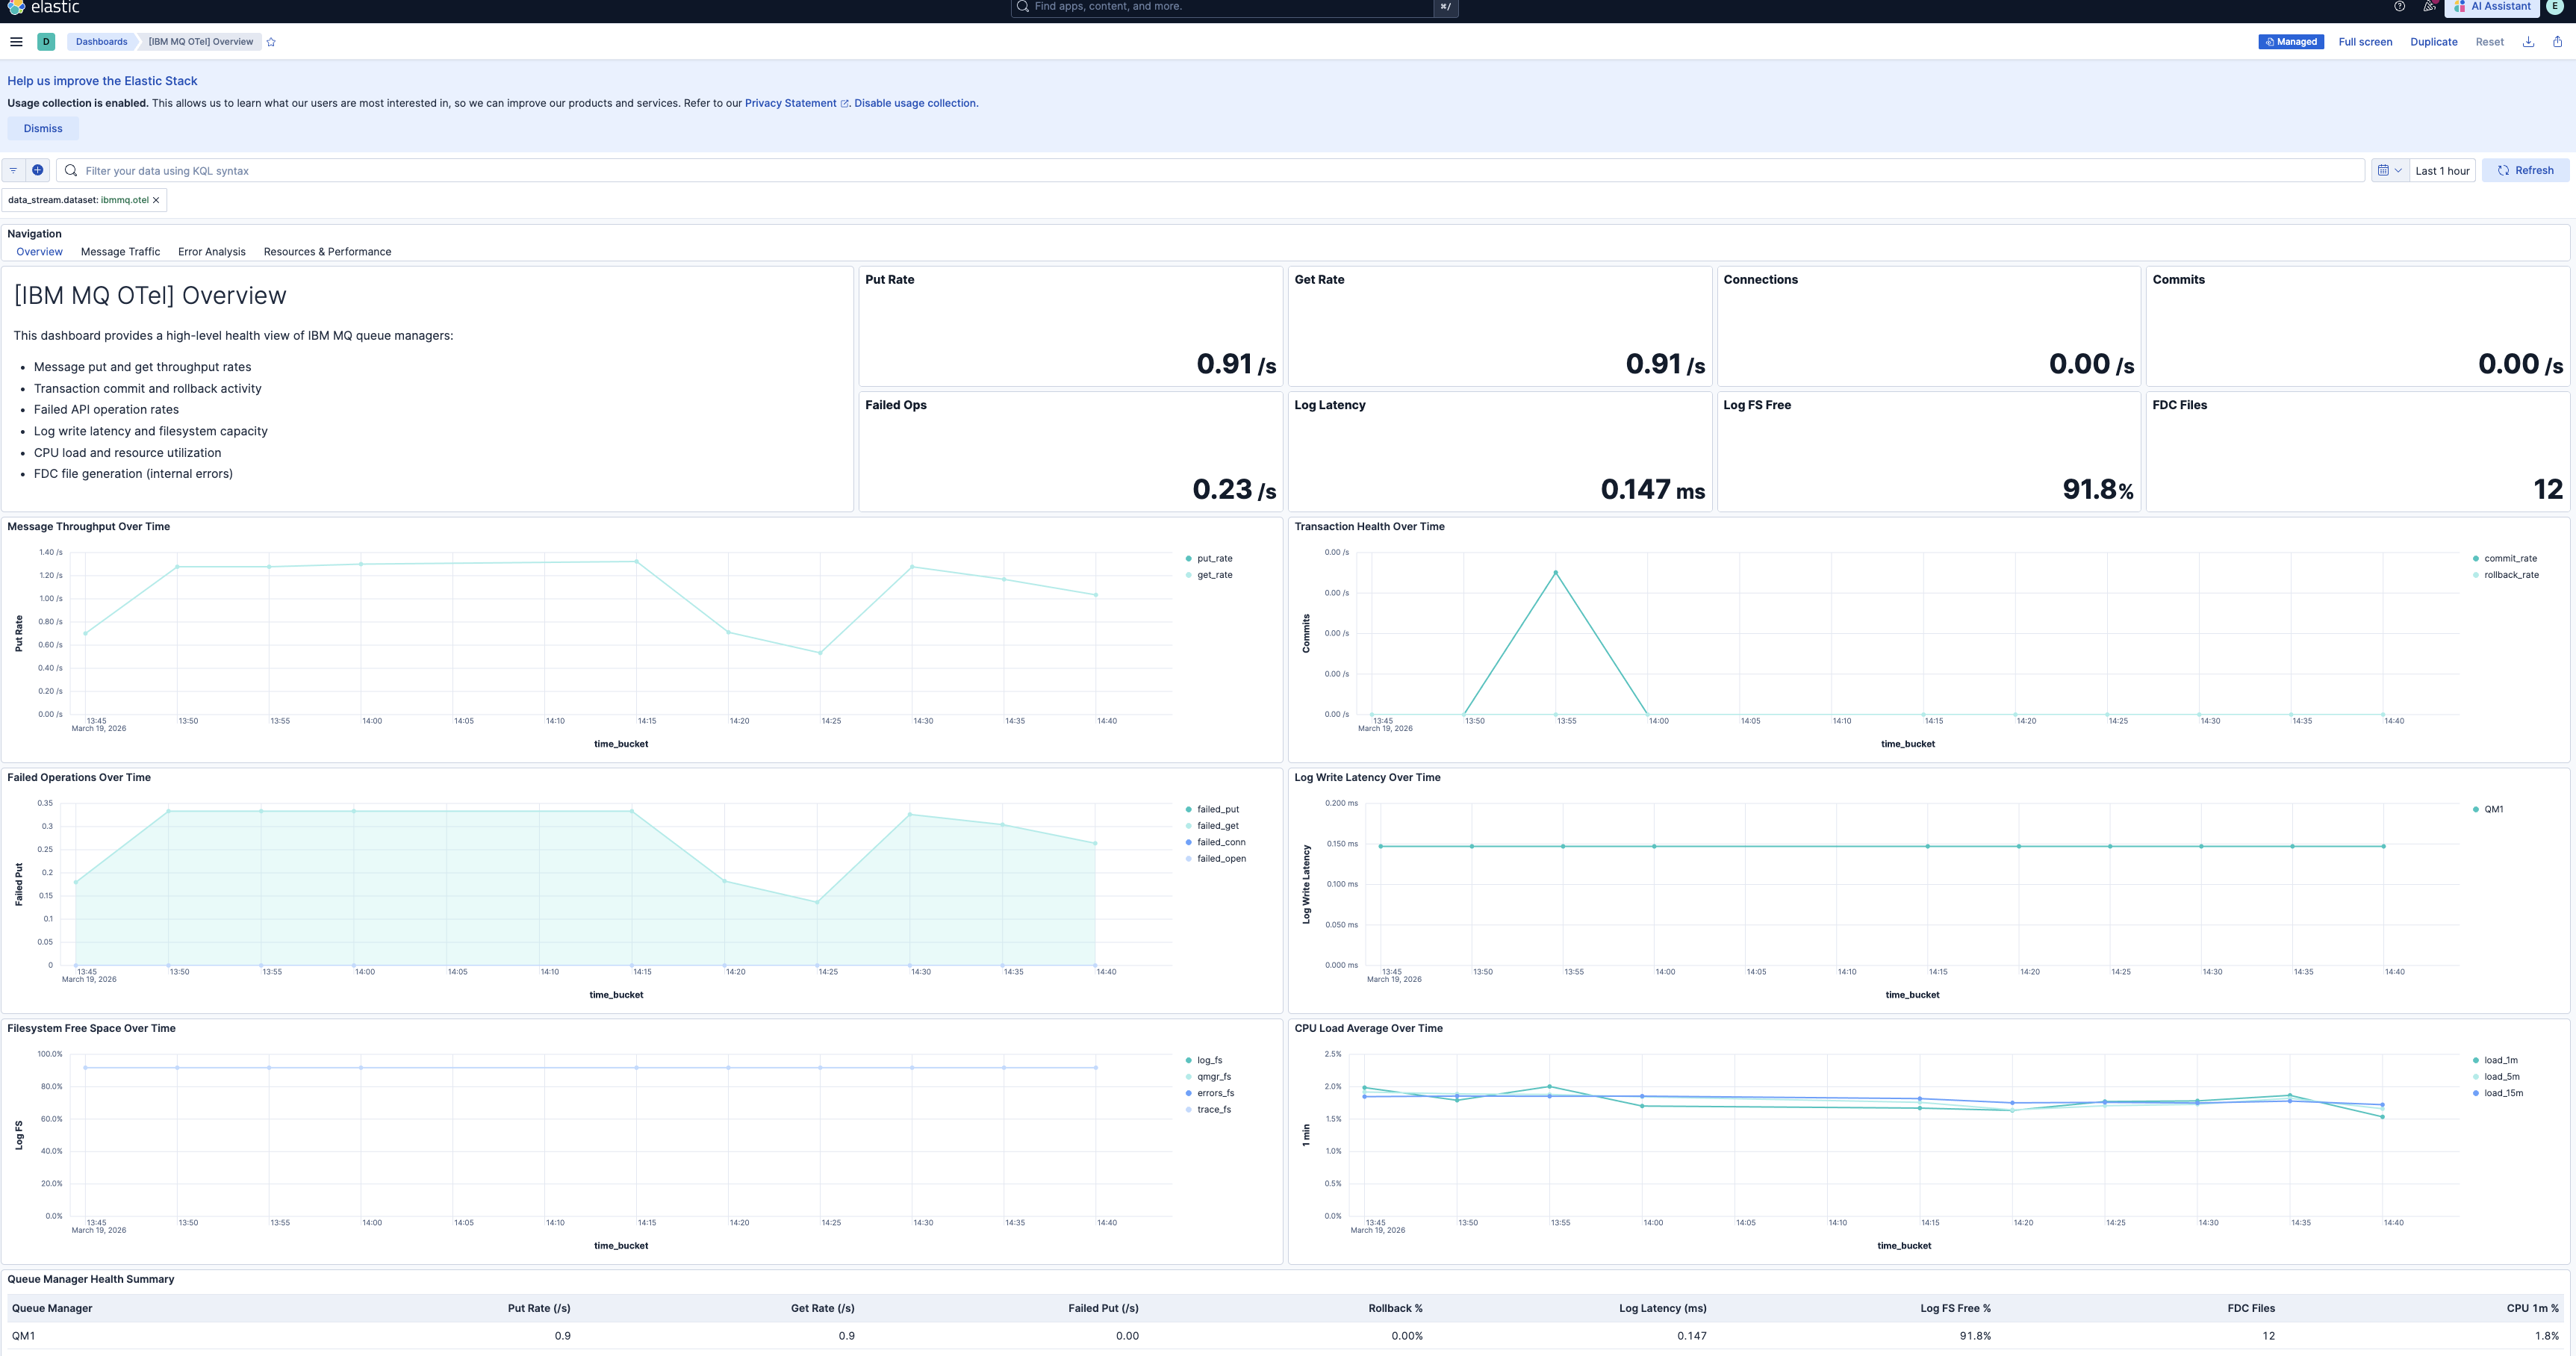
| **[IBM MQ OTel] Overview** | High-level health overview of IBM MQ queue managers showing message throughput, transaction health, API error rates, log performance, and resource utilization. |
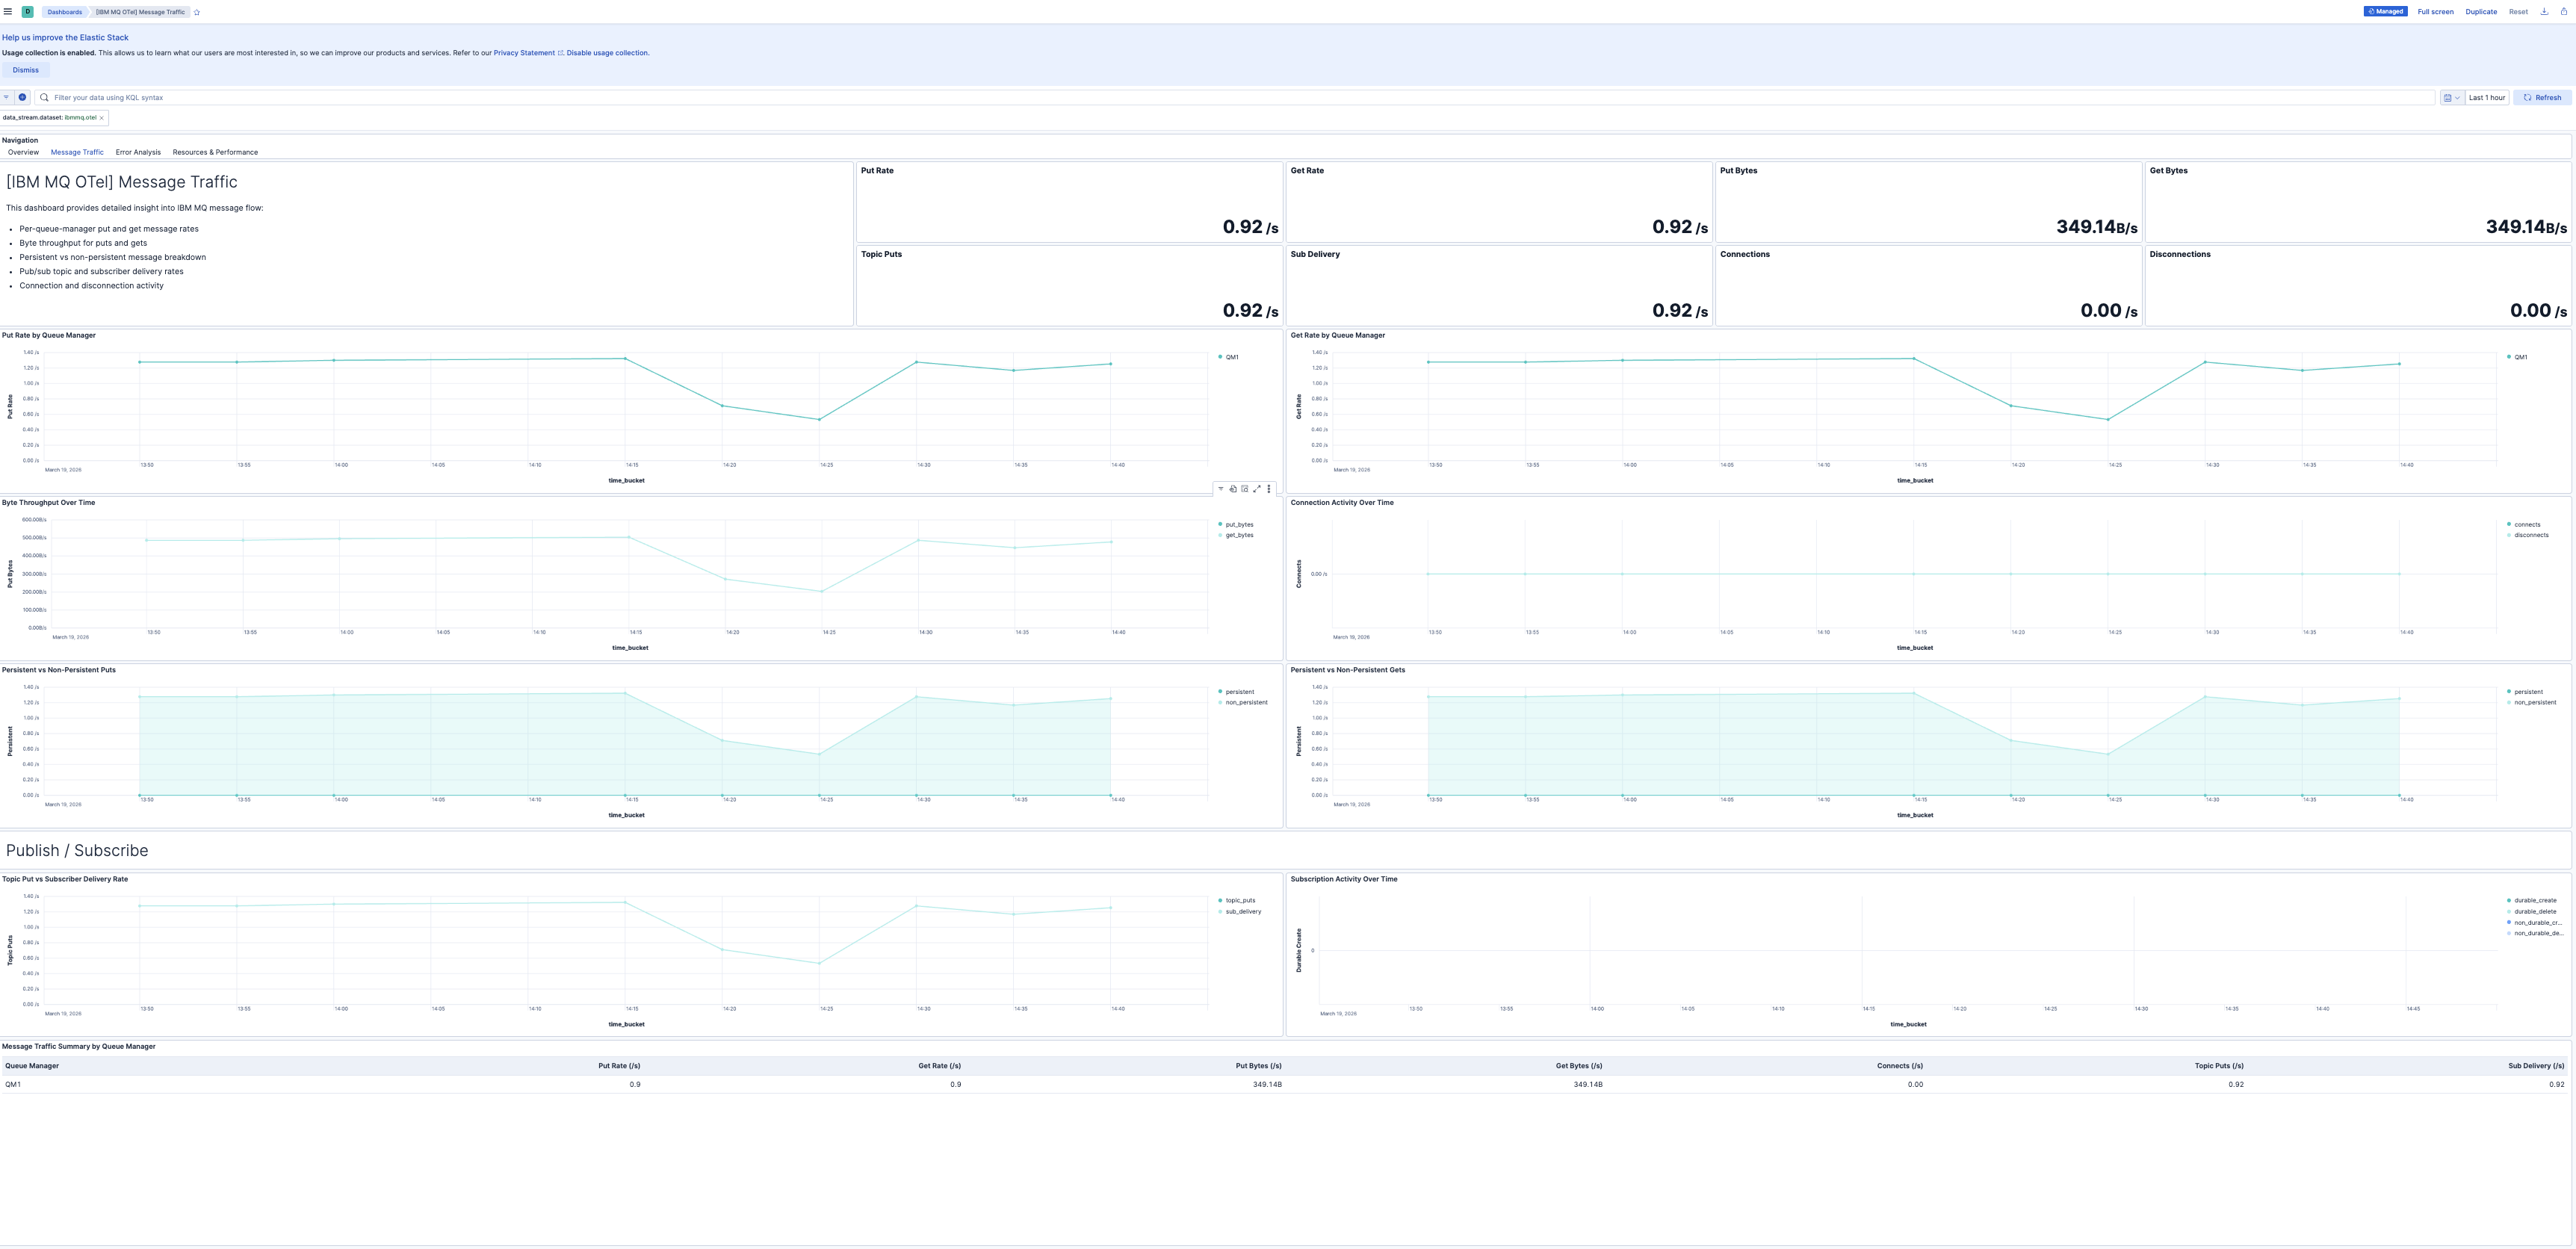
| **[IBM MQ OTel] Message Traffic** | Detailed message throughput analysis including put/get rates, byte throughput, persistence breakdown, pub/sub activity, and connection metrics. |
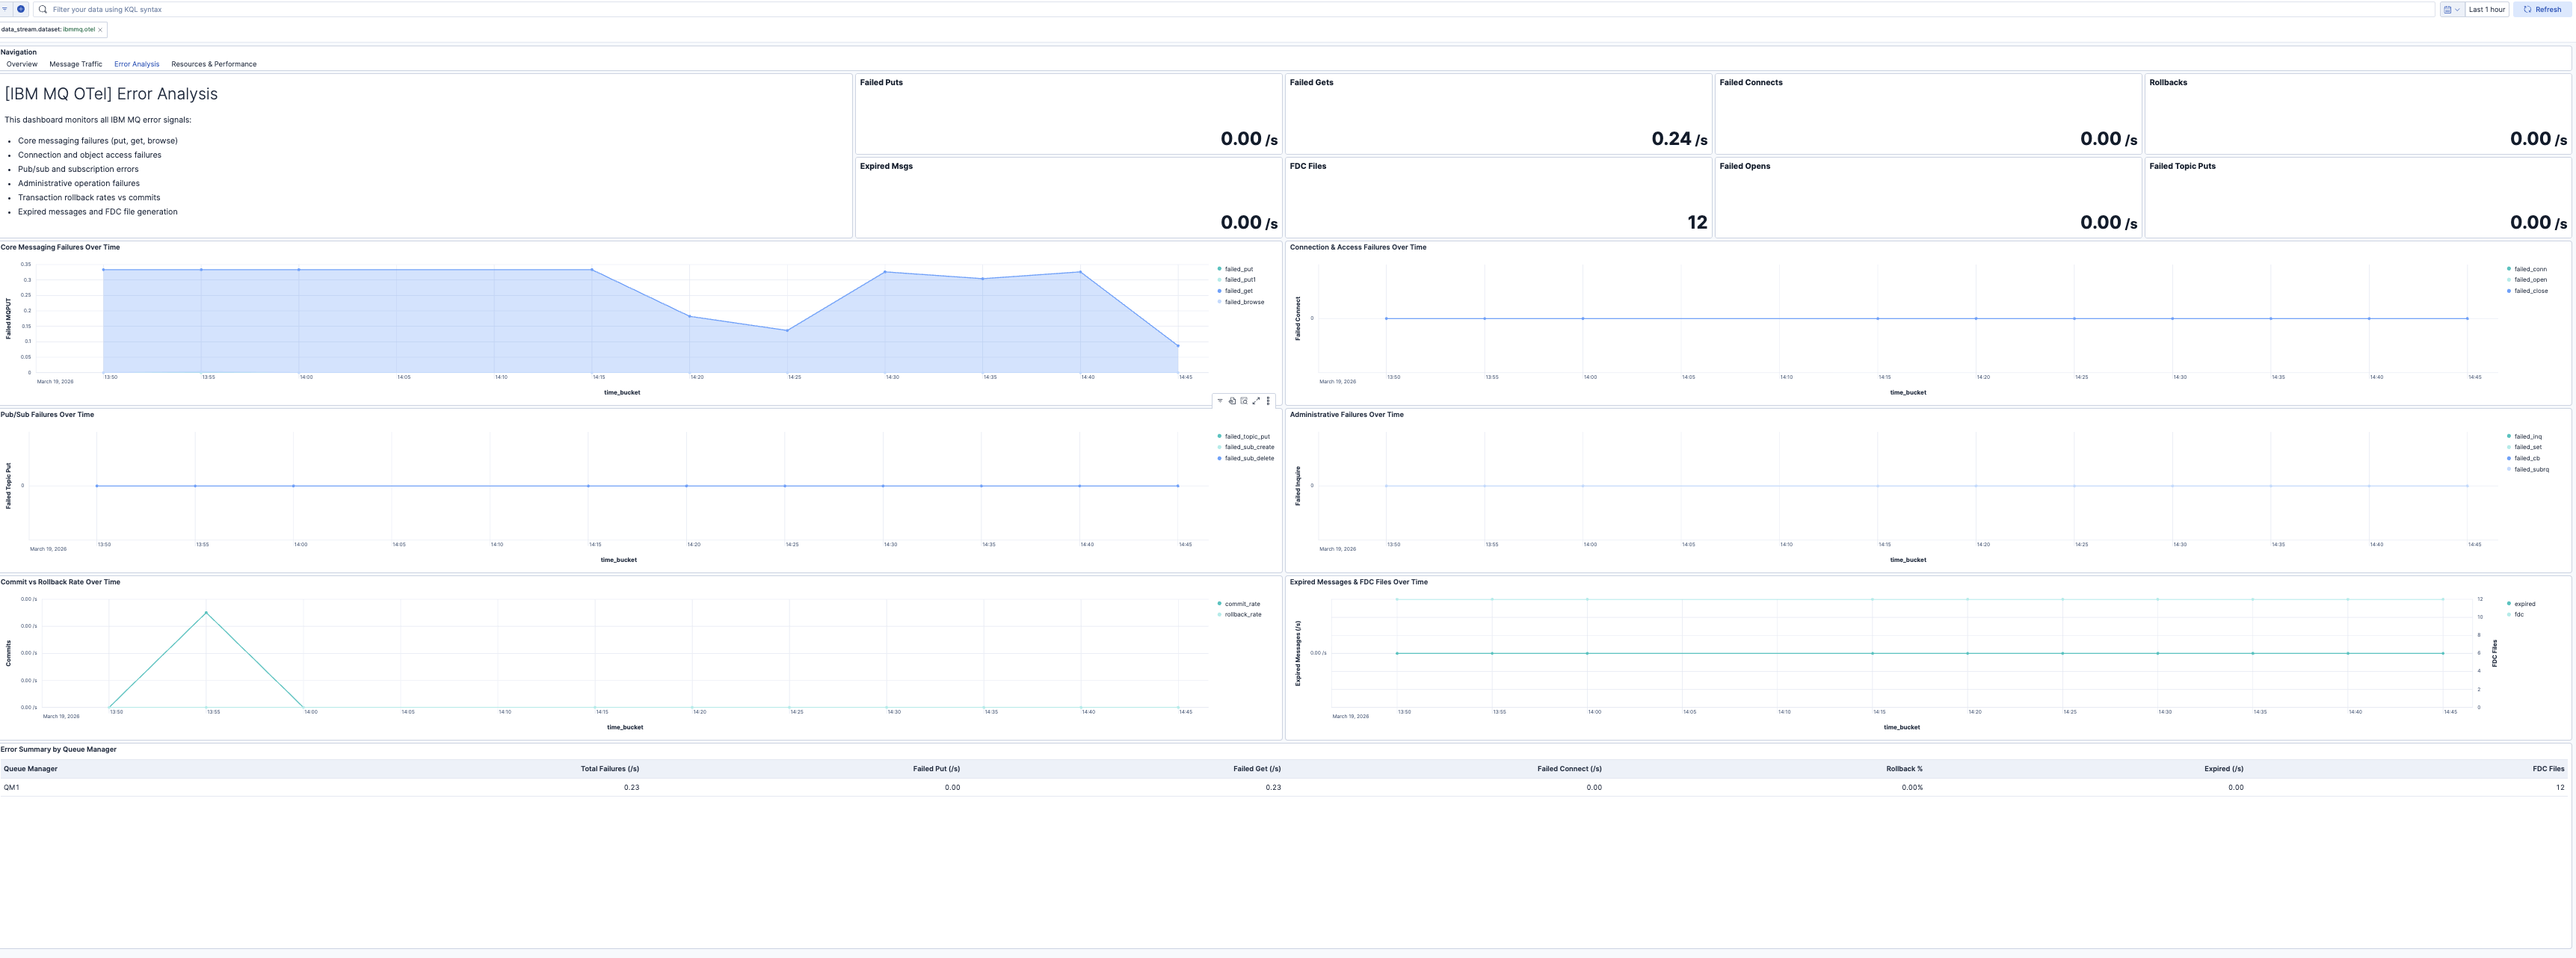
| **[IBM MQ OTel] Error Analysis** | Comprehensive error monitoring covering all failed API operations, transaction rollbacks, expired messages, and FDC file generation. |
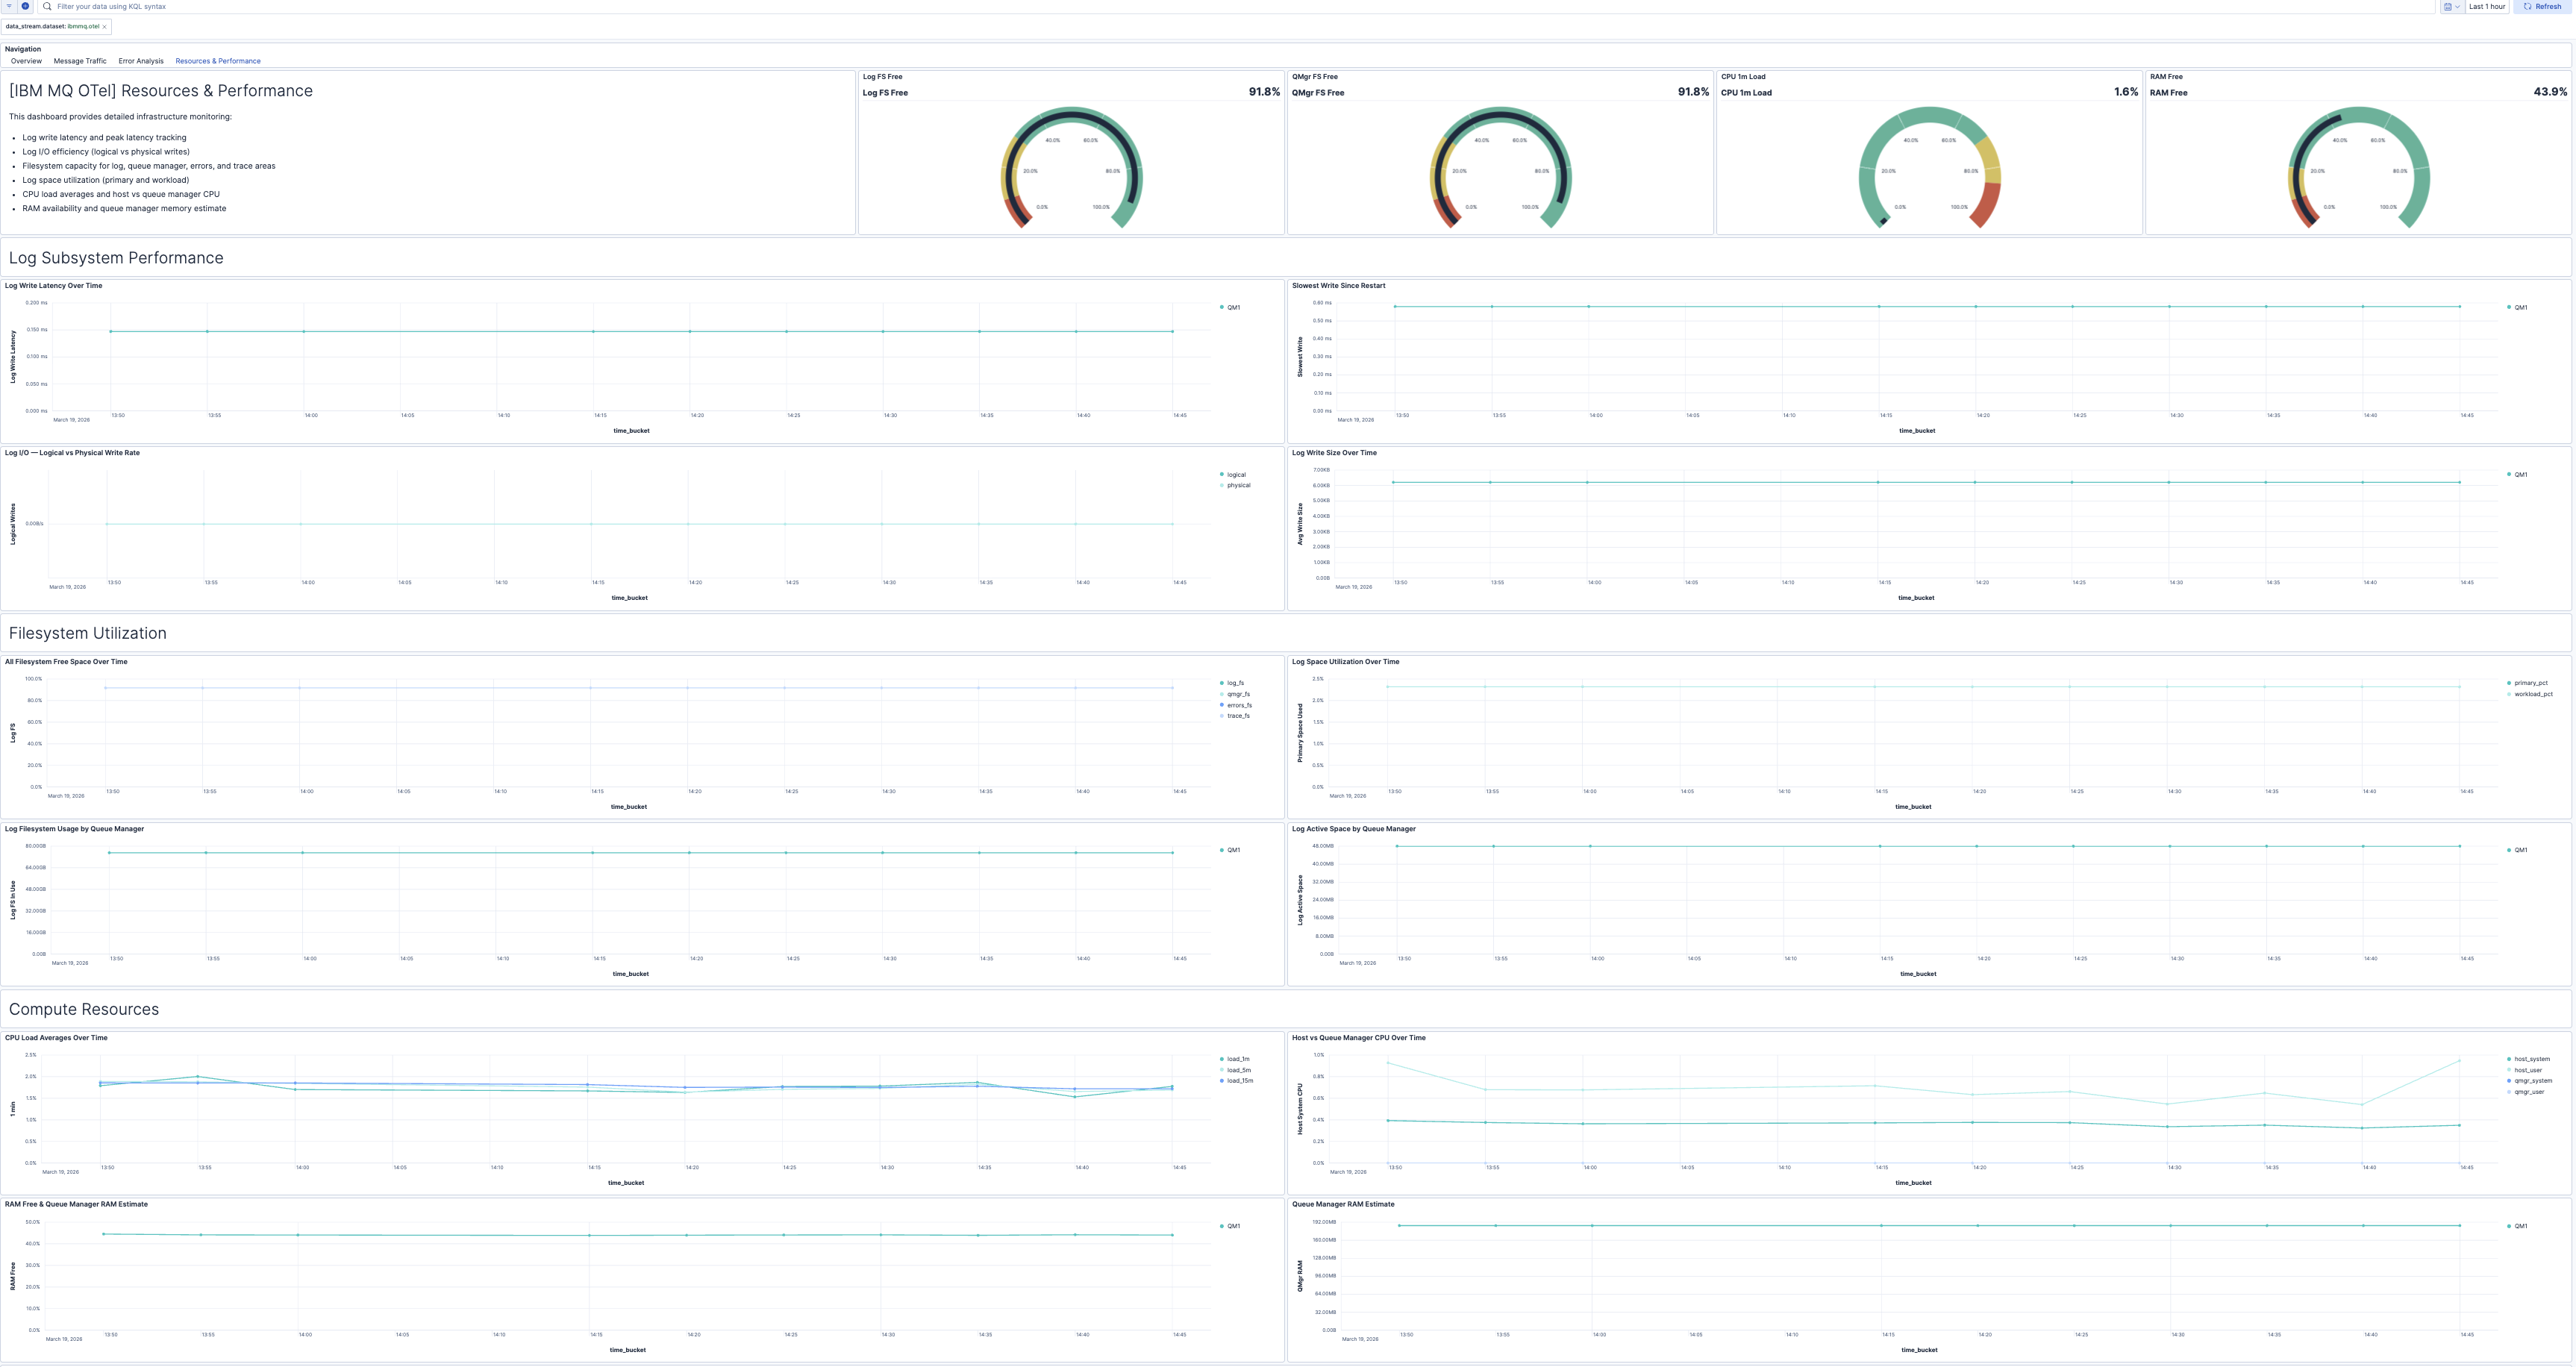
| **[IBM MQ OTel] Resources & Performance** | Resource utilization and log subsystem performance including log write latency, filesystem capacity, CPU load, RAM usage, and log I/O efficiency. |
## Alert rules
| Alert | Trigger | Severity |
|--------------------------------------------------------|------------------------------------------------------|----------|
| **[IBM MQ OTel] CPU load high** | 5-minute CPU load average exceeds 85% | Warning |
| **[IBM MQ OTel] Messages expiring before consumption** | Messages are expiring before being consumed | Warning |
| **[IBM MQ OTel] Failed connection attempts** | Connection or object-open failures detected | High |
| **[IBM MQ OTel] Failed message operations** | Failed MQPUT or MQGET operations detected | High |
| **[IBM MQ OTel] FDC files increasing** | New FDC (First Failure Data Capture) files generated | Critical |
| **[IBM MQ OTel] High log write latency** | Average log write latency exceeds 5 milliseconds | Warning |
| **[IBM MQ OTel] High transaction rollback ratio** | Rollback rate exceeds 5% of total transactions | High |
| **[IBM MQ OTel] Log filesystem critically low** | Log filesystem free space drops below 10% | Critical |
| **[IBM MQ OTel] Queue manager filesystem low** | Queue manager filesystem free space drops below 20% | Warning |
## SLO templates
SLO templates require Elastic Stack version 9.4.0 or later.
| SLO | Target | Window | Description |
|------------------------------------------------------------------|--------|----------------|----------------------------------------------------------------------------------------------|
| **[IBM MQ OTel] Log write latency 99.5% rolling 30 days** | 99.5% | 30-day rolling | Ensures 99.5% of 1-minute intervals maintain average log write latency below 5 milliseconds. |
| **[IBM MQ OTel] Message put availability 99.5% rolling 30 days** | 99.5% | 30-day rolling | Ensures 99.5% of 1-minute intervals maintain at least 99.5% MQPUT/MQPUT1 success rate. |
## Screenshots
This integration includes one or more Kibana dashboards that visualizes the data collected by the integration. The screenshots below illustrate how the ingested data is displayed.
## Changelog
| Version | Details | Minimum Kibana version |
|-----------|----------------------------------------------------------------------------------------------------------------------------------------|------------------------|
| **0.1.0** | **Enhancement** ([View pull request](https://github.com/elastic/integrations/pull/17896))Initial draft of the ibmmq_otel content pack. | 9.2.1 |