---
title: Memcached OpenTelemetry Assets
description: Memcached is a high-performance, distributed, in-memory key-value cache used to reduce latency and offload read-heavy workloads from backing data stores...
url: https://docs-v3-preview.elastic.dev/elastic/integration-docs/tree/main/reference/memcached_otel
products:
- Elastic integrations
applies_to:
- Serverless Observability projects: Generally available
- Serverless Security projects: Generally available
- Elastic Stack: Generally available since 9.3
---
# Memcached OpenTelemetry Assets
| | |
|-------------------------------------------------------------------------------------------------------------------------------|----------------------------------------------------------------|
| **Version** | 0.1.0 : Beta ([View all](#changelog)) |
| **Subscription level**[What's this?](https://www.elastic.co/subscriptions) | Basic |
| **Developed by**[What's this?](https://docs-v3-preview.elastic.dev/elastic/integration-docs/tree/main/reference/developed-by) | Elastic |
| **Minimum Kibana version(s)** | 9.3.0 |
To use beta integrations, go to the **Integrations** page in Kibana, scroll down, and toggle on the _Display beta integrations_ option.
Memcached is a high-performance, distributed, in-memory key-value cache used to reduce latency and offload read-heavy workloads from backing data stores. The Memcached OpenTelemetry assets provide dashboards, alert rules, and SLO templates for the memcachedreceiver data source, covering cache health, command throughput, connections, hit ratio, evictions, and resource utilization.
## Compatibility
The Memcached OpenTelemetry assets have been tested with [OpenTelemetry Memcached receiver v0.146.0](https://github.com/open-telemetry/opentelemetry-collector-contrib/blob/v0.146.0/receiver/memcachedreceiver/README.md) and Memcached 1.6.
## Requirements
You need Elasticsearch for storing and searching your data and Kibana for visualizing and managing it. You can use our hosted Elasticsearch Service on Elastic Cloud, which is recommended, or self-manage the Elastic Stack on your own hardware.
## Setup
### Prerequisites
The Memcached receiver uses the stats command to collect metrics. No special service-side configuration is required; the receiver works out of the box as long as the OpenTelemetry Collector can reach the memcached instance on its stats port (default 11211).
### Configuration
You can run the Memcached receiver with the OpenTelemetry Collector or the Elastic OpenTelemetry Distribution (EDOT) Collector. Configure the receiver, the `elasticsearch/otel` exporter with `mapping.mode: otel`, and the service pipeline as shown below.
| Placeholder | Description | Example |
|------------------------|---------------------------------------------------|------------------------------------------------------------|
| `` | Hostname or IP and port of the memcached instance | `localhost:11211` |
| `` | Elasticsearch ingest endpoint (OTel HTTP) | `https://my-deployment.es.us-central1.gcp.cloud.es.io:443` |
| `${env:ES_API_KEY}` | Elasticsearch API key for authentication | — |
```yaml
receivers:
memcached:
endpoint: ""
collection_interval: 10s
transport: tcp
exporters:
elasticsearch/otel:
apikey: ${env:ES_API_KEY}
endpoint: ""
service:
pipelines:
metrics:
receivers: [memcached]
exporters: [elasticsearch/otel]
```
## Reference
### Metrics
Refer to the [metadata.yaml](https://github.com/open-telemetry/opentelemetry-collector-contrib/blob/main/receiver/memcachedreceiver/metadata.yaml) of the OpenTelemetry Memcached receiver for details on available metrics.
## Dashboards
| Dashboard | Description |
|-------------------------------|----------------------------------------------------------------------------------------------------------------------|
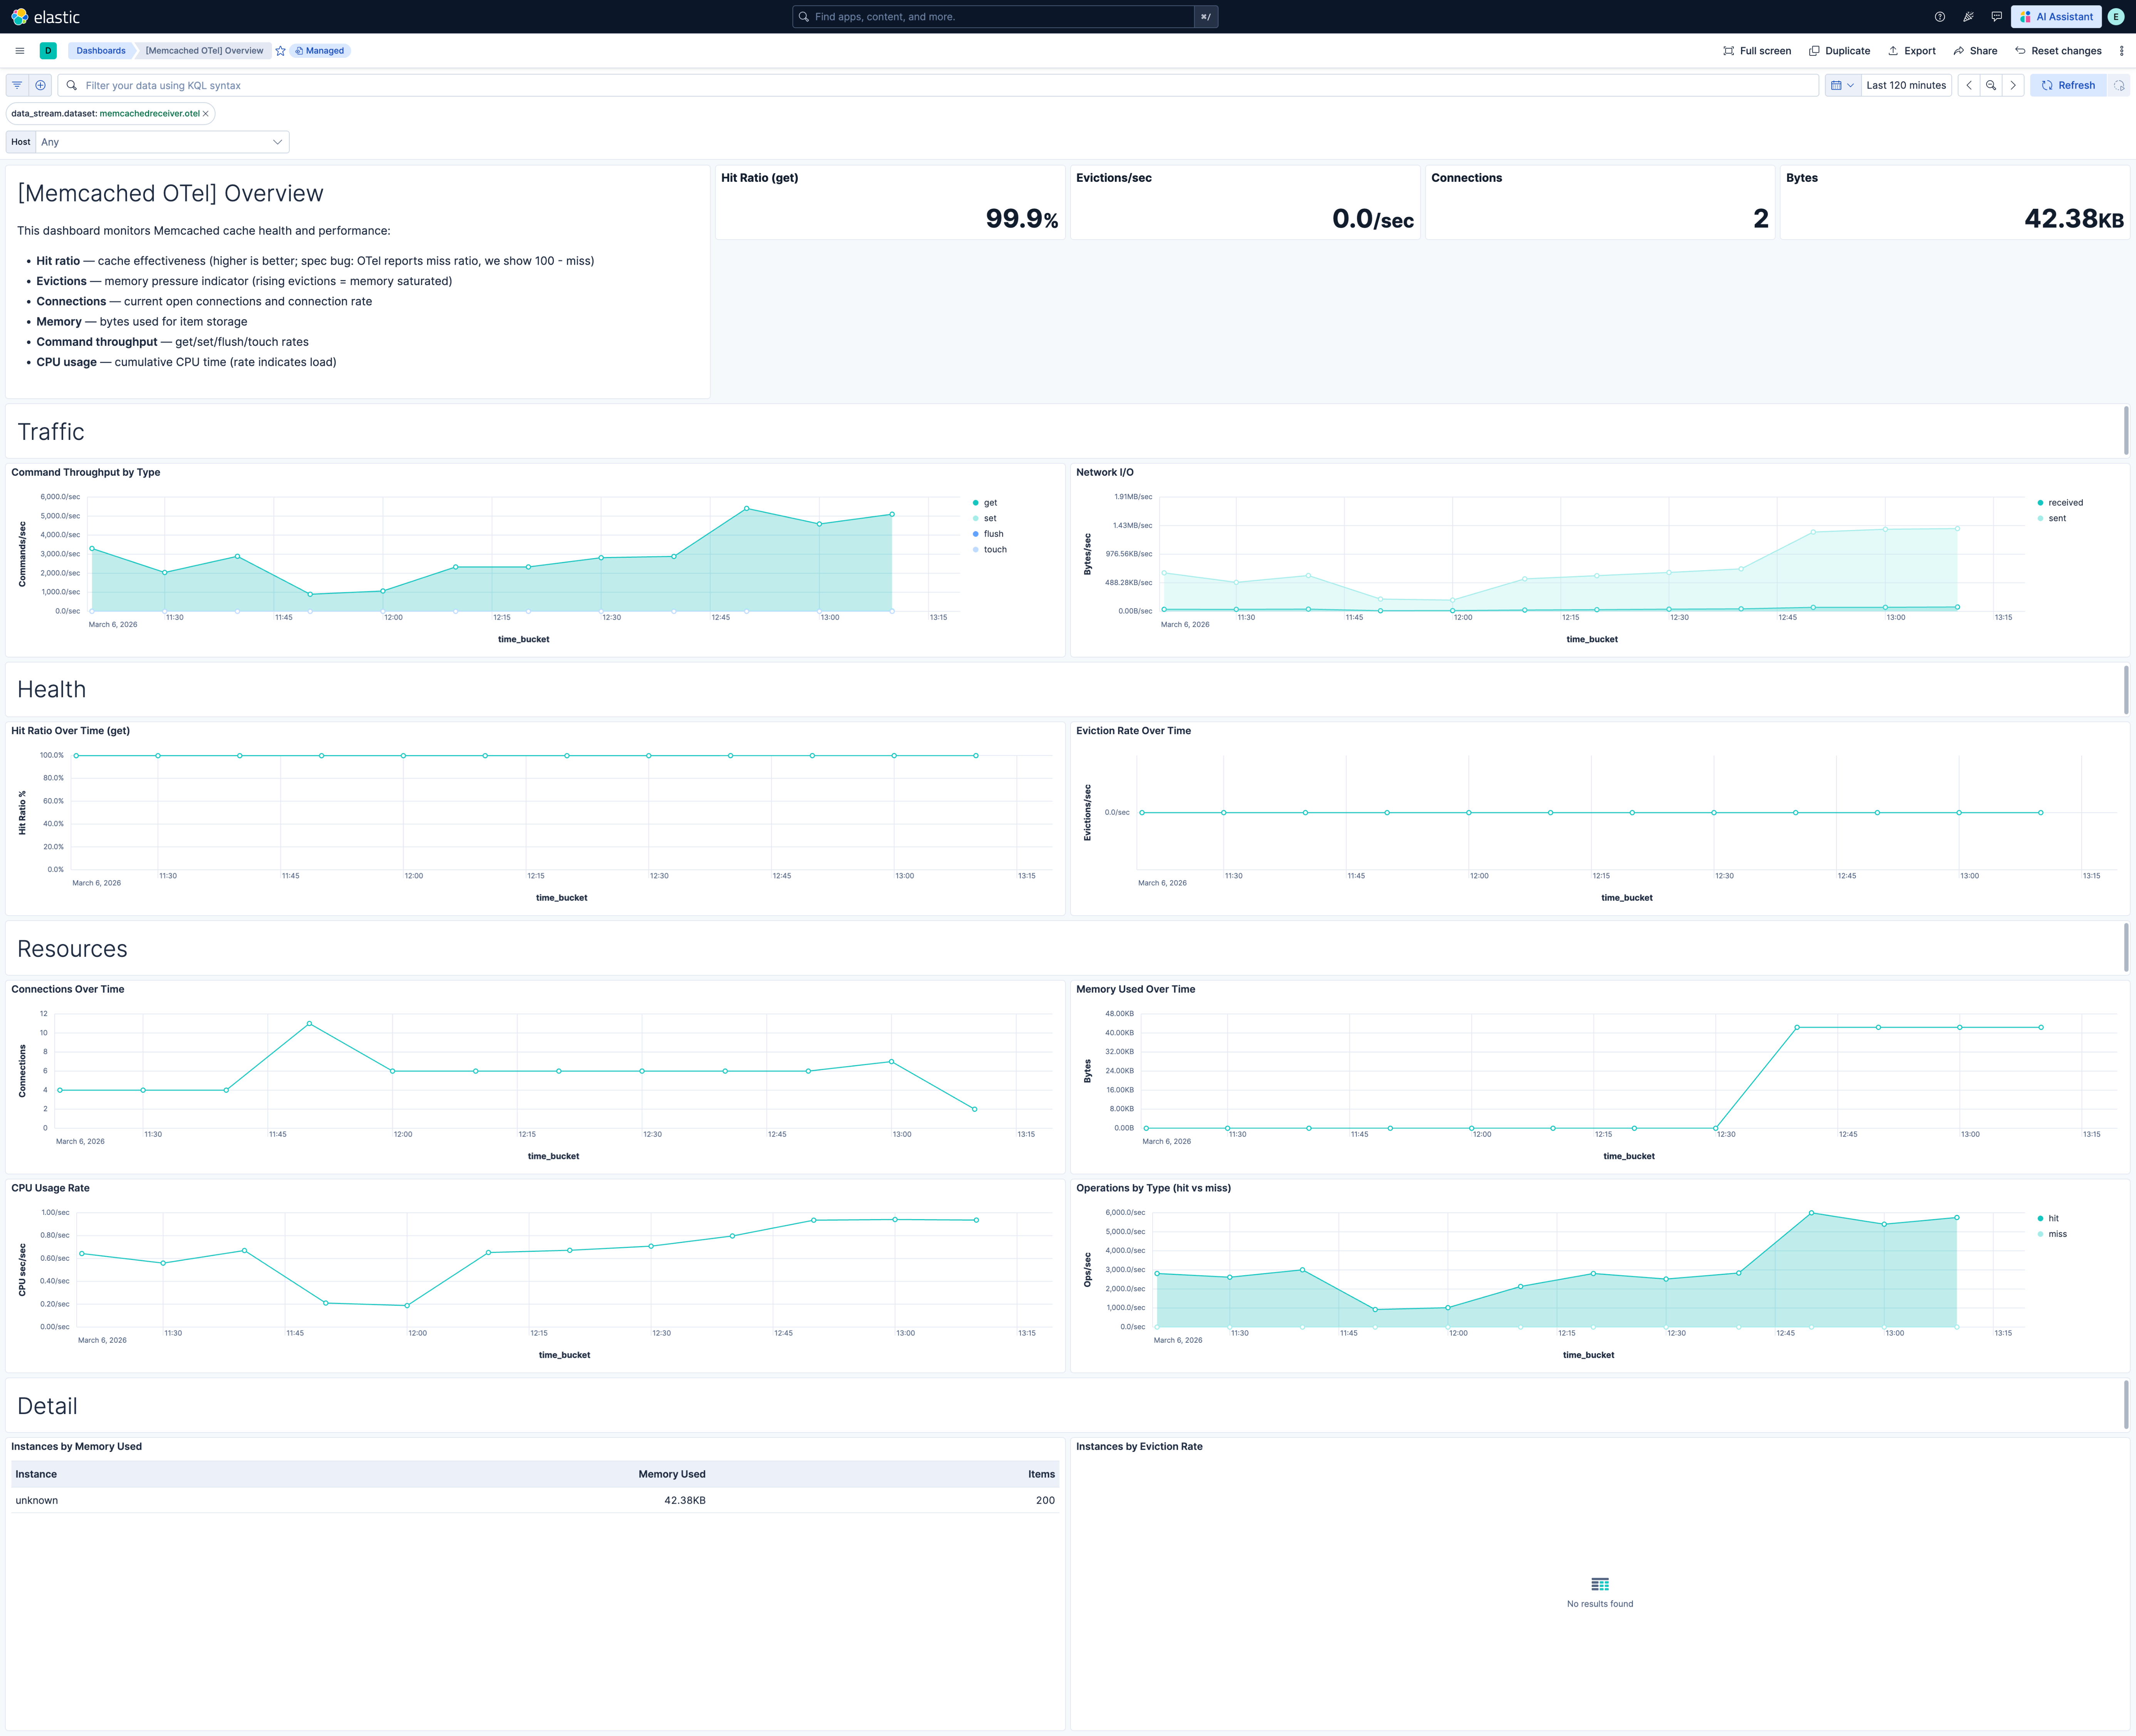
| **[Memcached OTel] Overview** | Overview of Memcached cache health, command throughput, connections, hit ratio, evictions, and resource utilization. |
## Alert rules
| Alert | Trigger | Severity |
|--------------------------------------------------|------------------------------------------------------------------------------|----------|
| **[Memcached OTel] High CPU usage** | CPU usage rate exceeds 80% (cumulative sec/sec) for an instance. | High |
| **[Memcached OTel] Connection spike** | Peak connections exceed 500 in a 15-minute window. | High |
| **[Memcached OTel] High eviction rate** | Eviction rate exceeds 1 eviction per second (indicates memory pressure). | High |
| **[Memcached OTel] Command throughput drop** | Command rate falls below 0.1 commands/sec (instance down or cache bypassed). | Critical |
| **[Memcached OTel] Low get operation hit ratio** | Get operation hit ratio falls below 80% for an instance. | High |
## SLO templates
SLO templates require Elastic Stack version 9.4.0 or later.
| SLO | Target | Window | Description |
|--------------------------------------------------------------------|--------|----------------|----------------------------------------------------------------------------------------------------------------|
| **[Memcached OTel] Get operation hit ratio 99.5% rolling 30 days** | 99.5% | 30-day rolling | Ensures 99.5% of 1-minute intervals show get operation hit ratio at or above 95% over a rolling 30-day period. |
## Screenshots
This integration includes one or more Kibana dashboards that visualizes the data collected by the integration. The screenshots below illustrate how the ingested data is displayed.
## Changelog
| Version | Details | Minimum Kibana version |
|-----------|-------------------------------------------------------------------------------------------------------------------------------------------------------|------------------------|
| **0.1.0** | **Enhancement** ([View pull request](https://github.com/elastic/integrations/pull/17698))First release of the Memcached OpenTelemetry content package | 9.3.0 |