---
title: Microsoft SQL Server OpenTelemetry Assets
description: Microsoft SQL Server is a relational database management system used for OLTP, data warehousing, and mixed workloads. These assets provide dashboards,...
url: https://docs-v3-preview.elastic.dev/elastic/integration-docs/tree/main/reference/microsoft_sqlserver_otel
products:
- Elastic integrations
applies_to:
- Serverless Observability projects: Generally available
- Serverless Security projects: Generally available
- Elastic Stack: Generally available since 9.3
---
# Microsoft SQL Server OpenTelemetry Assets
| | |
|-------------------------------------------------------------------------------------------------------------------------------|----------------------------------------------------------------|
| **Version** | 0.1.0 : Beta ([View all](#changelog)) |
| **Subscription level**[What's this?](https://www.elastic.co/subscriptions) | Basic |
| **Developed by**[What's this?](https://docs-v3-preview.elastic.dev/elastic/integration-docs/tree/main/reference/developed-by) | Elastic |
| **Minimum Kibana version(s)** | 9.3.0 |
To use beta integrations, go to the **Integrations** page in Kibana, scroll down, and toggle on the _Display beta integrations_ option.
Microsoft SQL Server is a relational database management system used for OLTP, data warehousing, and mixed workloads. These assets provide dashboards, alert rules, and SLO templates for monitoring SQL Server using the OpenTelemetry `sqlserverreceiver`, covering memory, concurrency, I/O, TempDB, and query performance.
## Compatibility
The Microsoft SQL Server OpenTelemetry assets have been tested with OpenTelemetry SQL Server receiver v0.146.0.
SQL Server tested against:
- Microsoft SQL Server 2019, 2022
## Requirements
You need Elasticsearch for storing and searching your data and Kibana for visualizing and managing it. You can use our hosted Elasticsearch Service on Elastic Cloud, which is recommended, or self-manage the Elastic Stack on your own hardware.
## Setup
### Prerequisites
When using direct connection mode (recommended for Linux and container deployments), the SQL Server user must have:
1. At least one of: `CREATE DATABASE`, `ALTER ANY DATABASE`, or `VIEW ANY DATABASE`
2. `VIEW SERVER STATE` (SQL Server pre-2022) or `VIEW SERVER PERFORMANCE STATE` (SQL Server 2022 and later)
On Windows, you can alternatively use Windows Performance Counters; run the collector as administrator to collect all counters.
### Configuration
Configure the OpenTelemetry Collector or Elastic Distribution of OpenTelemetry (EDOT) Collector with the SQL Server receiver and the Elasticsearch exporter. Use the following placeholders in the YAML:
- `` — Hostname or IP address of the SQL Server instance (for example `sqlserver.example.com`)
- `` — Port of the SQL Server instance (default `1433`)
- `` — Username for SQL Server authentication
- `` — Password; use `${env:SQL_SERVER_PASSWORD}` to read from an environment variable
```yaml
receivers:
sqlserver:
collection_interval: 10s
server:
port:
username:
password: ${env:SQL_SERVER_PASSWORD}
events:
db.server.query_sample:
enabled: true
db.server.top_query:
enabled: true
top_query_collection:
lookback_time: 60s
max_query_sample_count: 1000
top_query_count: 250
collection_interval: 60s
query_sample_collection:
max_rows_per_query: 100
exporters:
elasticsearch/otel:
endpoints: ["https://"]
auth:
api_key: "${env:ES_API_KEY}"
mapping:
mode: otel
service:
pipelines:
metrics/sqlserver:
receivers: [sqlserver]
exporters: [elasticsearch/otel]
logs/sqlserver:
receivers: [sqlserver]
exporters: [elasticsearch/otel]
```
If you do not need query sample and top query log collection, remove the `events` and related `query_sample_collection` / `top_query_collection` blocks, and remove the `logs/sqlserver` pipeline. Dashboards and alerts that rely on metrics will continue to work.
## Reference
### Metrics
Refer to the [metadata.yaml](https://github.com/open-telemetry/opentelemetry-collector-contrib/blob/main/receiver/sqlserverreceiver/metadata.yaml) of the OpenTelemetry SQL Server receiver for details on available metrics.
### Logs
The receiver emits log events for `db.server.query_sample` (currently executing queries) and `db.server.top_query` (most expensive queries). These events include query text, session and blocking details, CPU time, logical reads, and wait types. Refer to the [logs-documentation.md](https://github.com/open-telemetry/opentelemetry-collector-contrib/blob/main/receiver/sqlserverreceiver/logs-documentation.md) for the full schema.
## Dashboards
| Dashboard | Description |
|--------------------------------------------|------------------------------------------------------------------------------------------------|
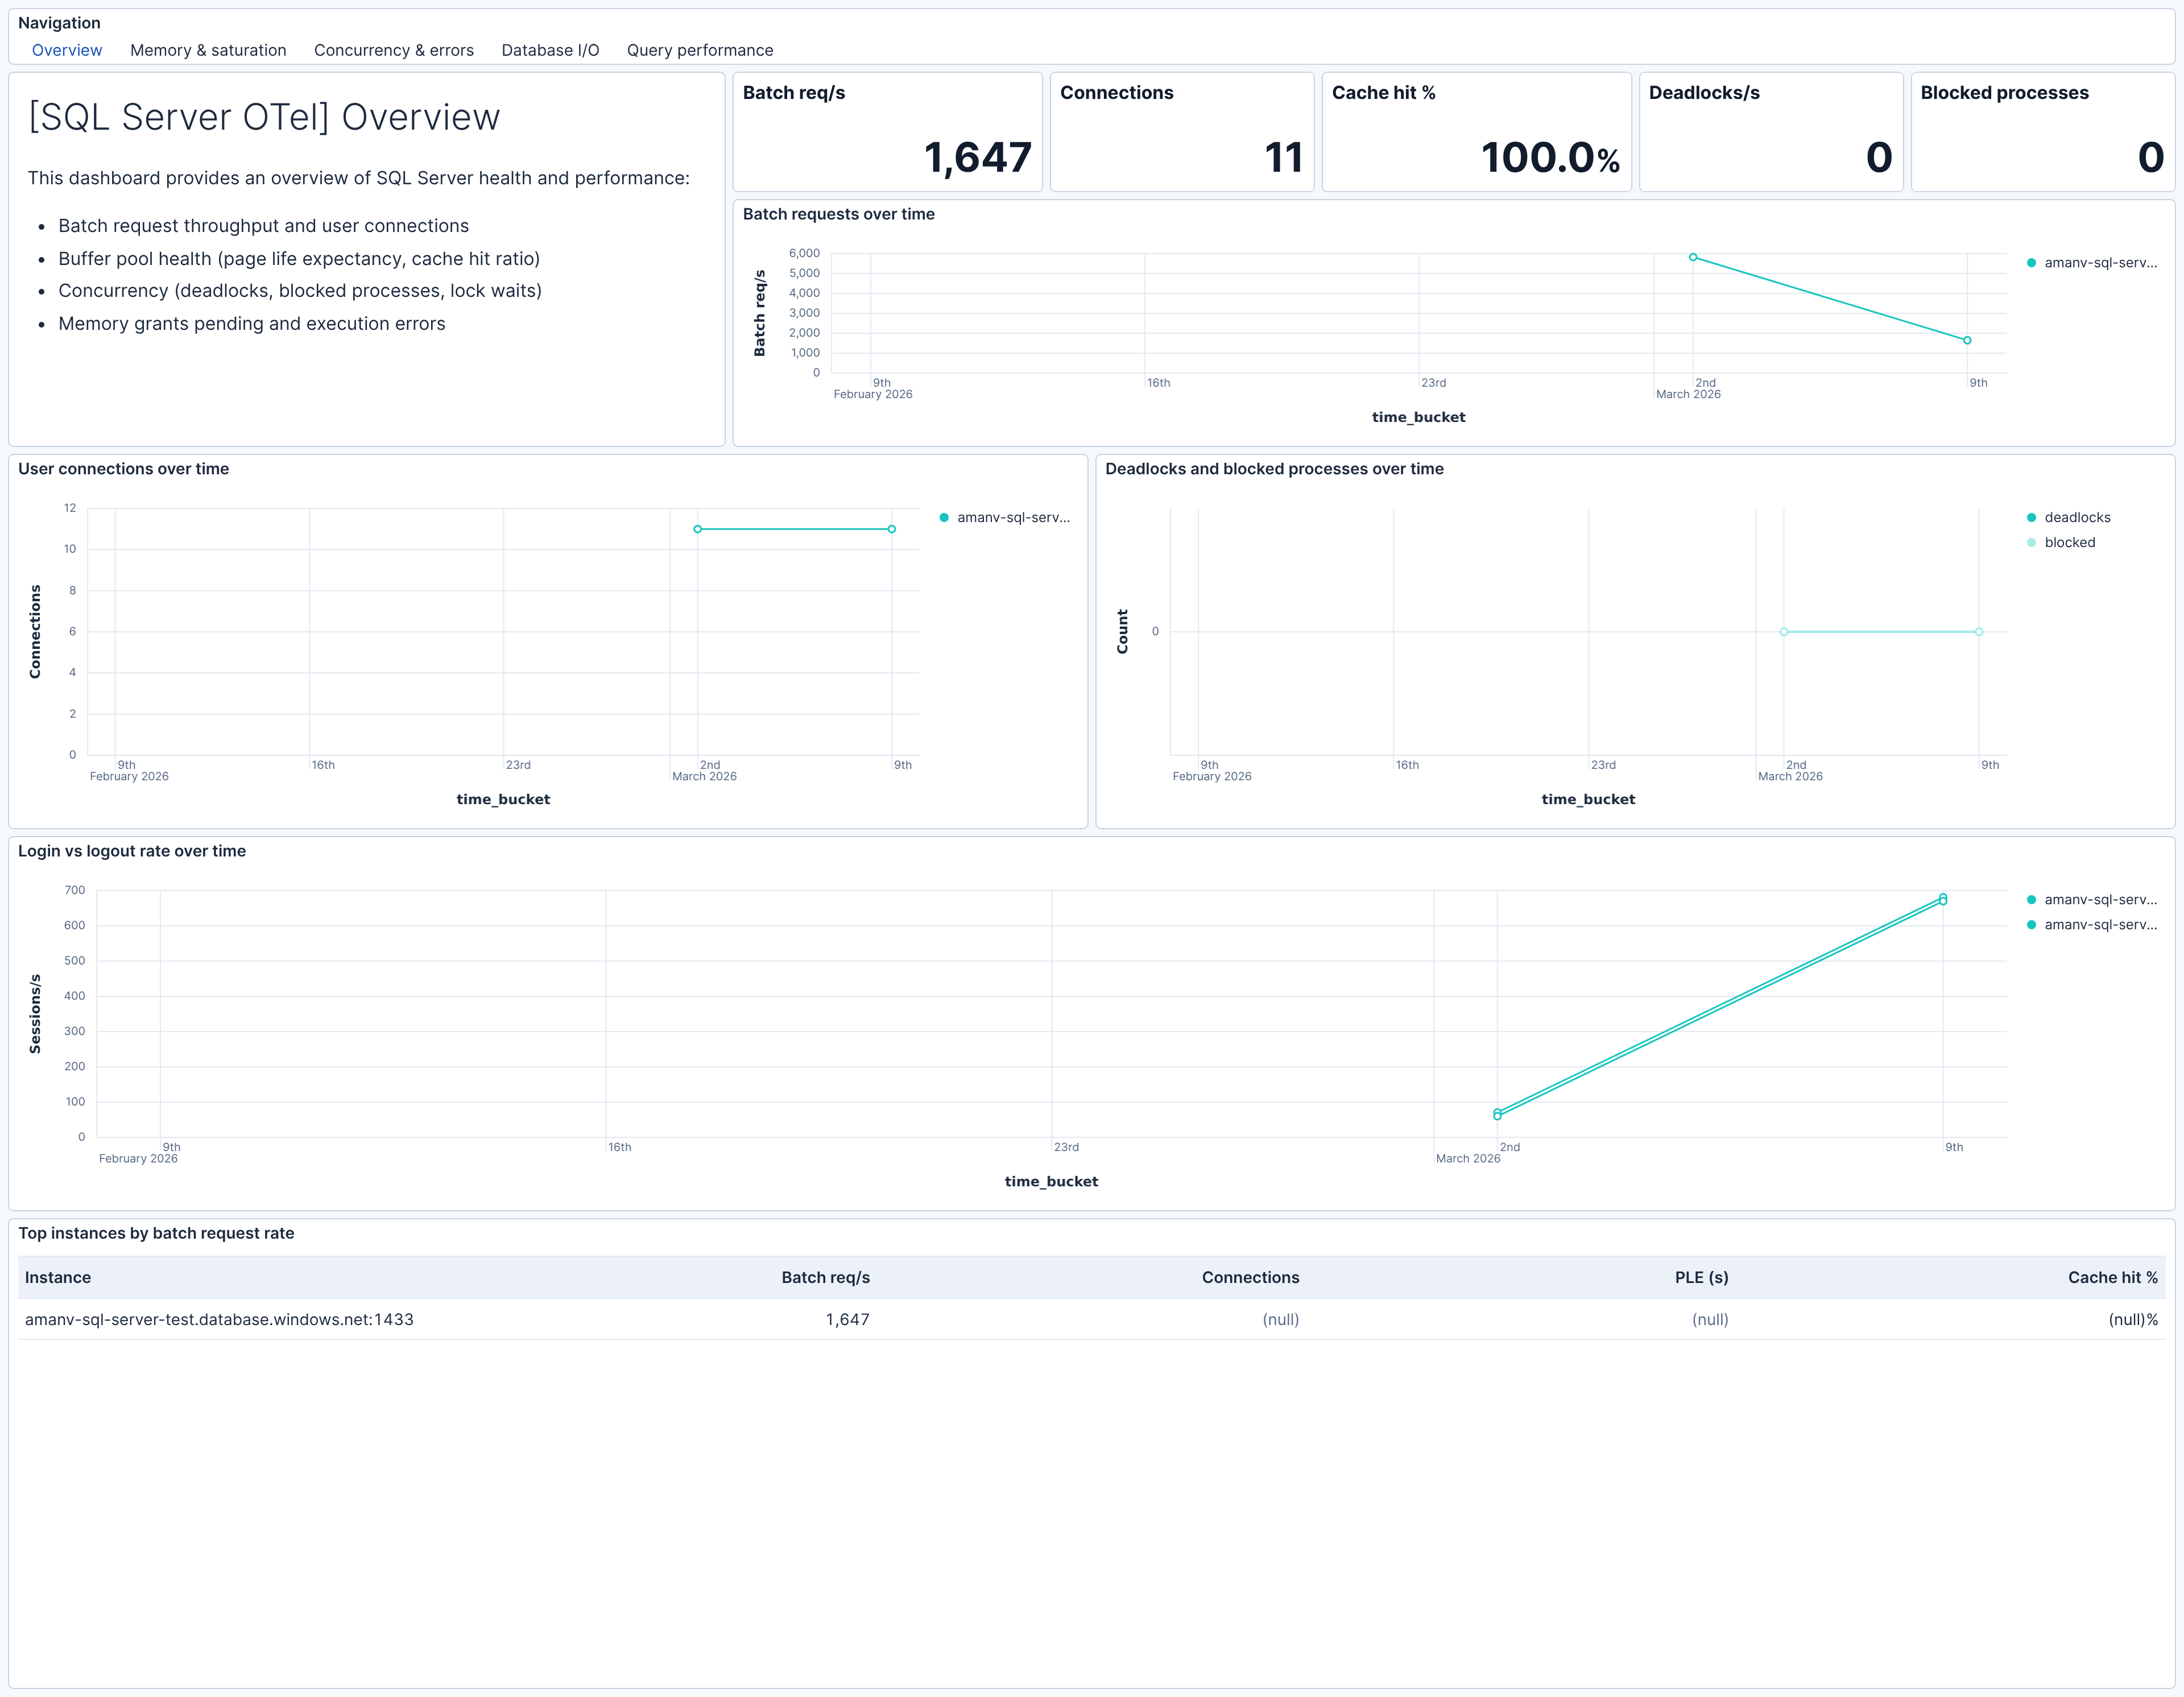
| **[SQL Server OTel] Overview** | High-level SQL Server health — batch throughput, connections, memory, concurrency, and errors. |
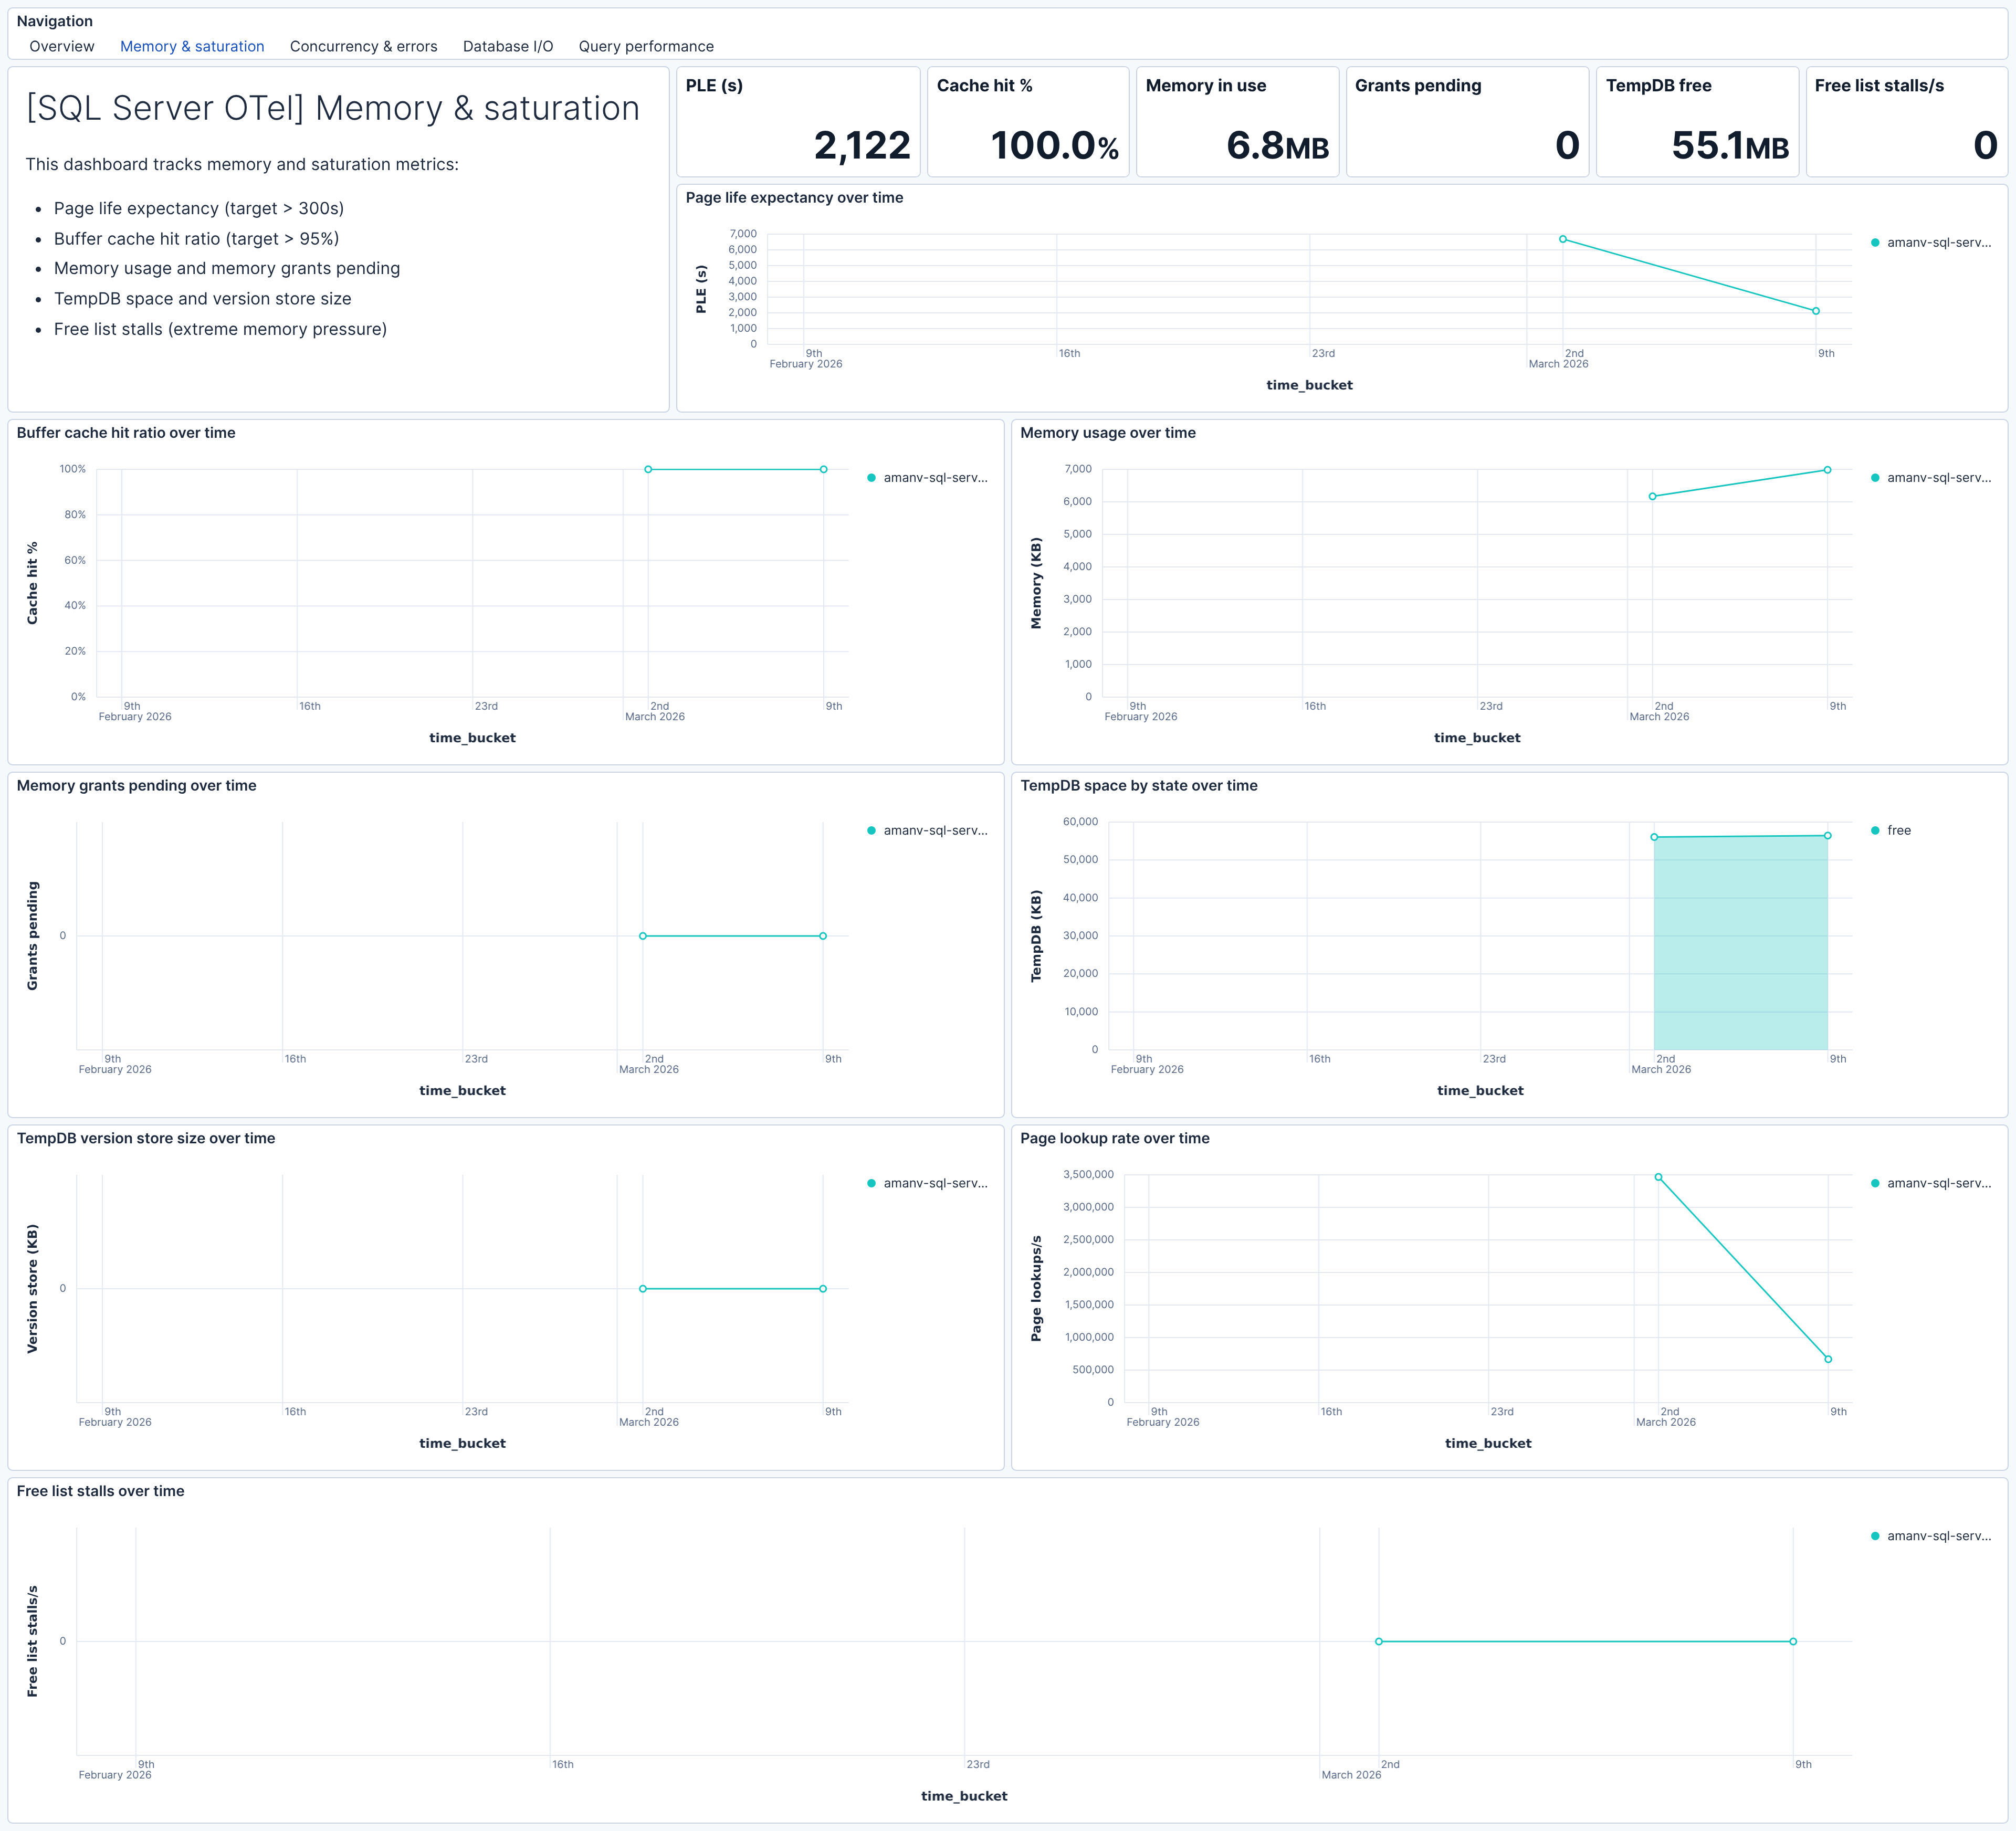
| **[SQL Server OTel] Memory & saturation** | Buffer pool health, memory usage, TempDB space, and memory grant pressure. |
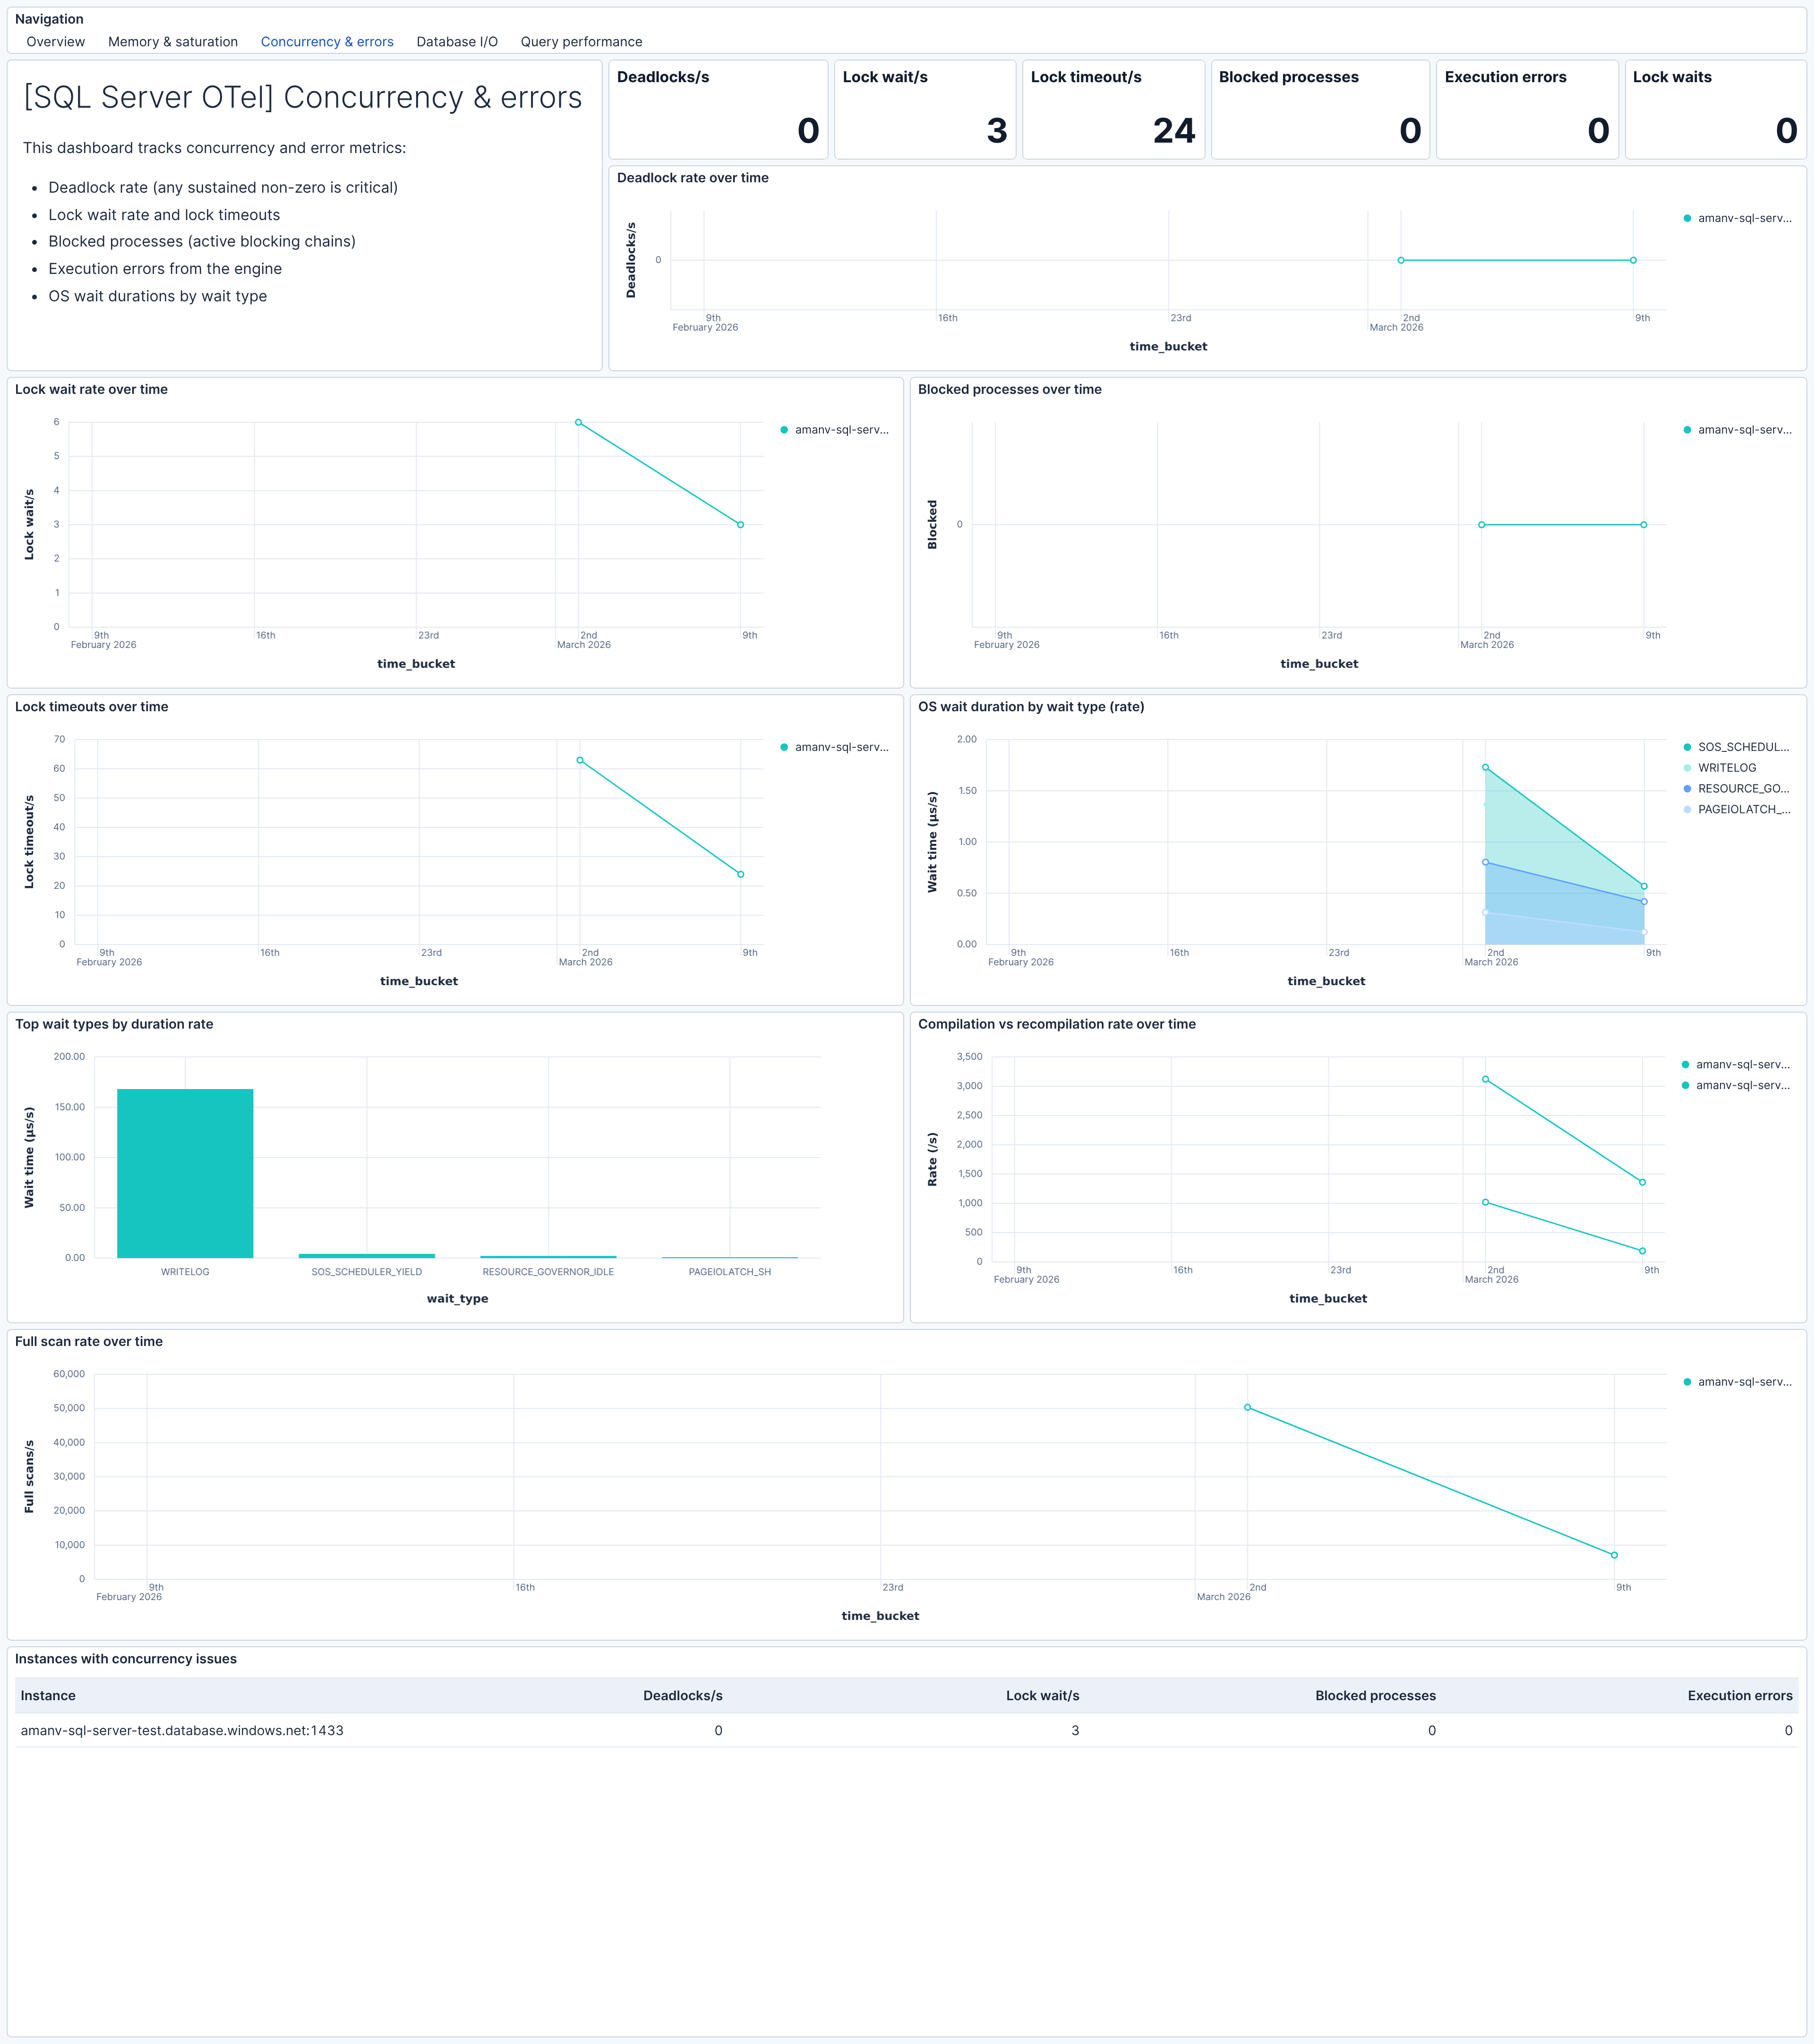
| **[SQL Server OTel] Concurrency & errors** | Deadlocks, lock waits, timeouts, blocked processes, and execution errors. |
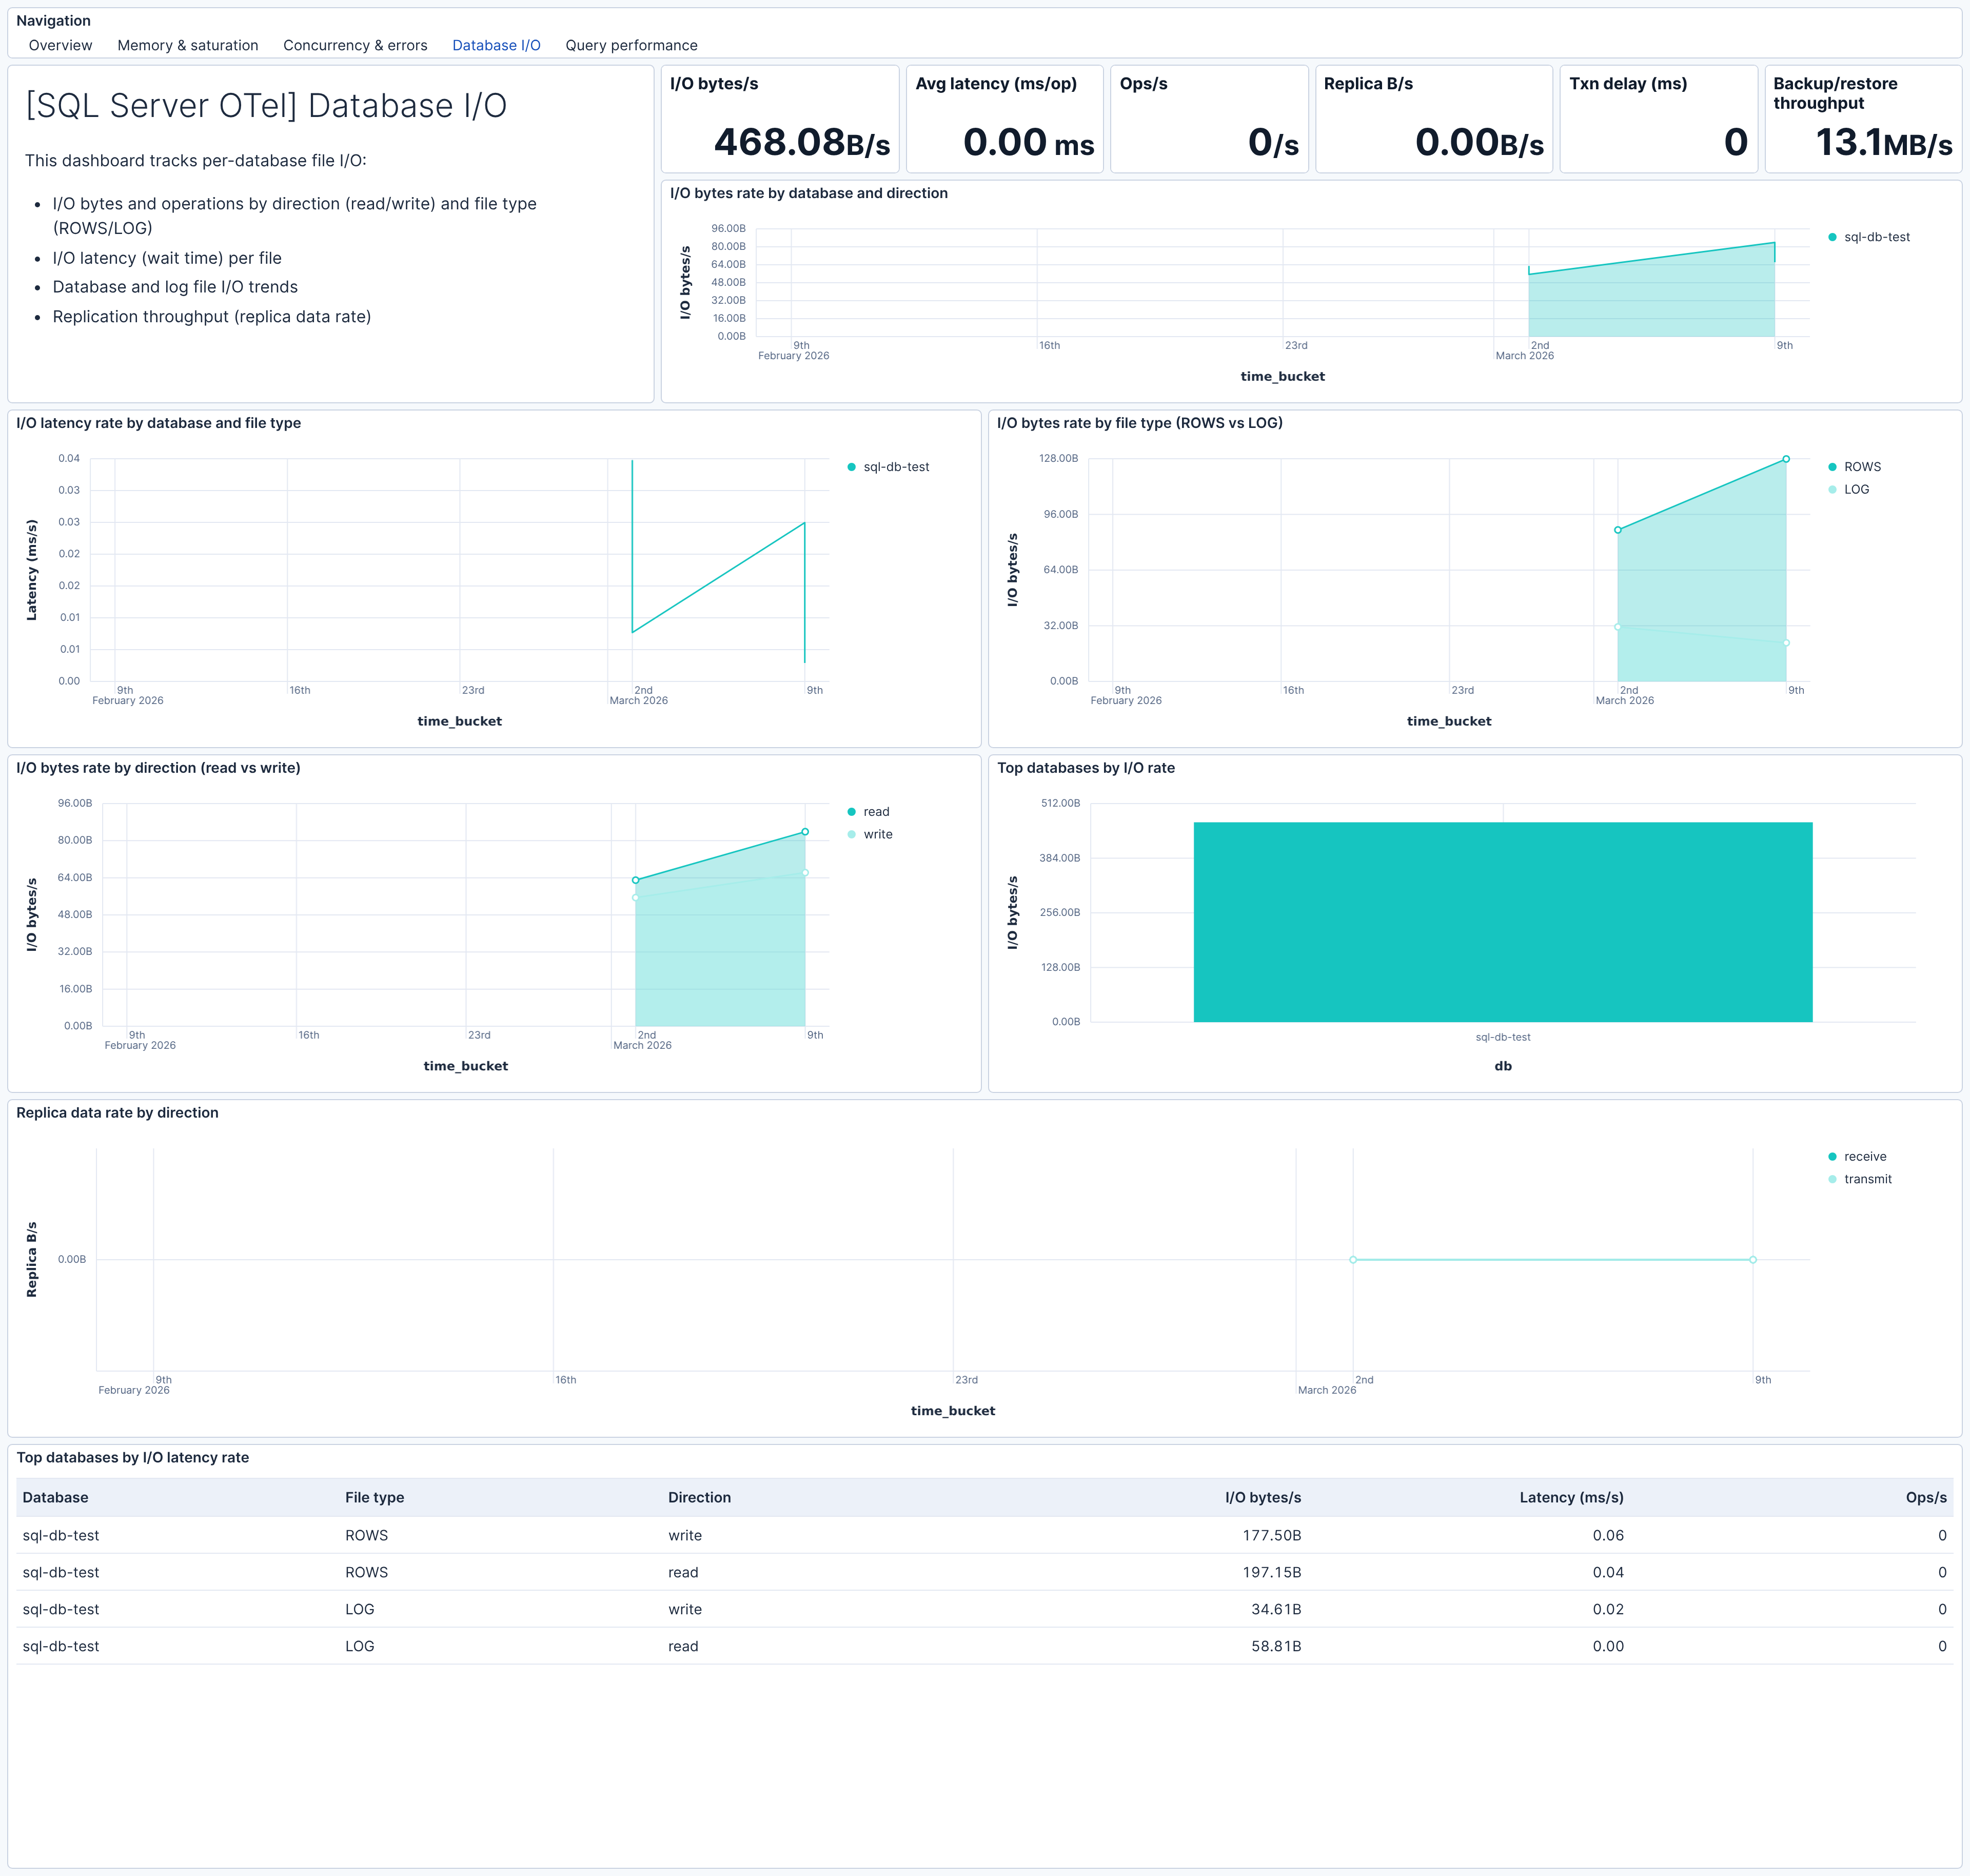
| **[SQL Server OTel] Database I/O** | Per-database file I/O bytes, latency, and operations by direction and file type. |
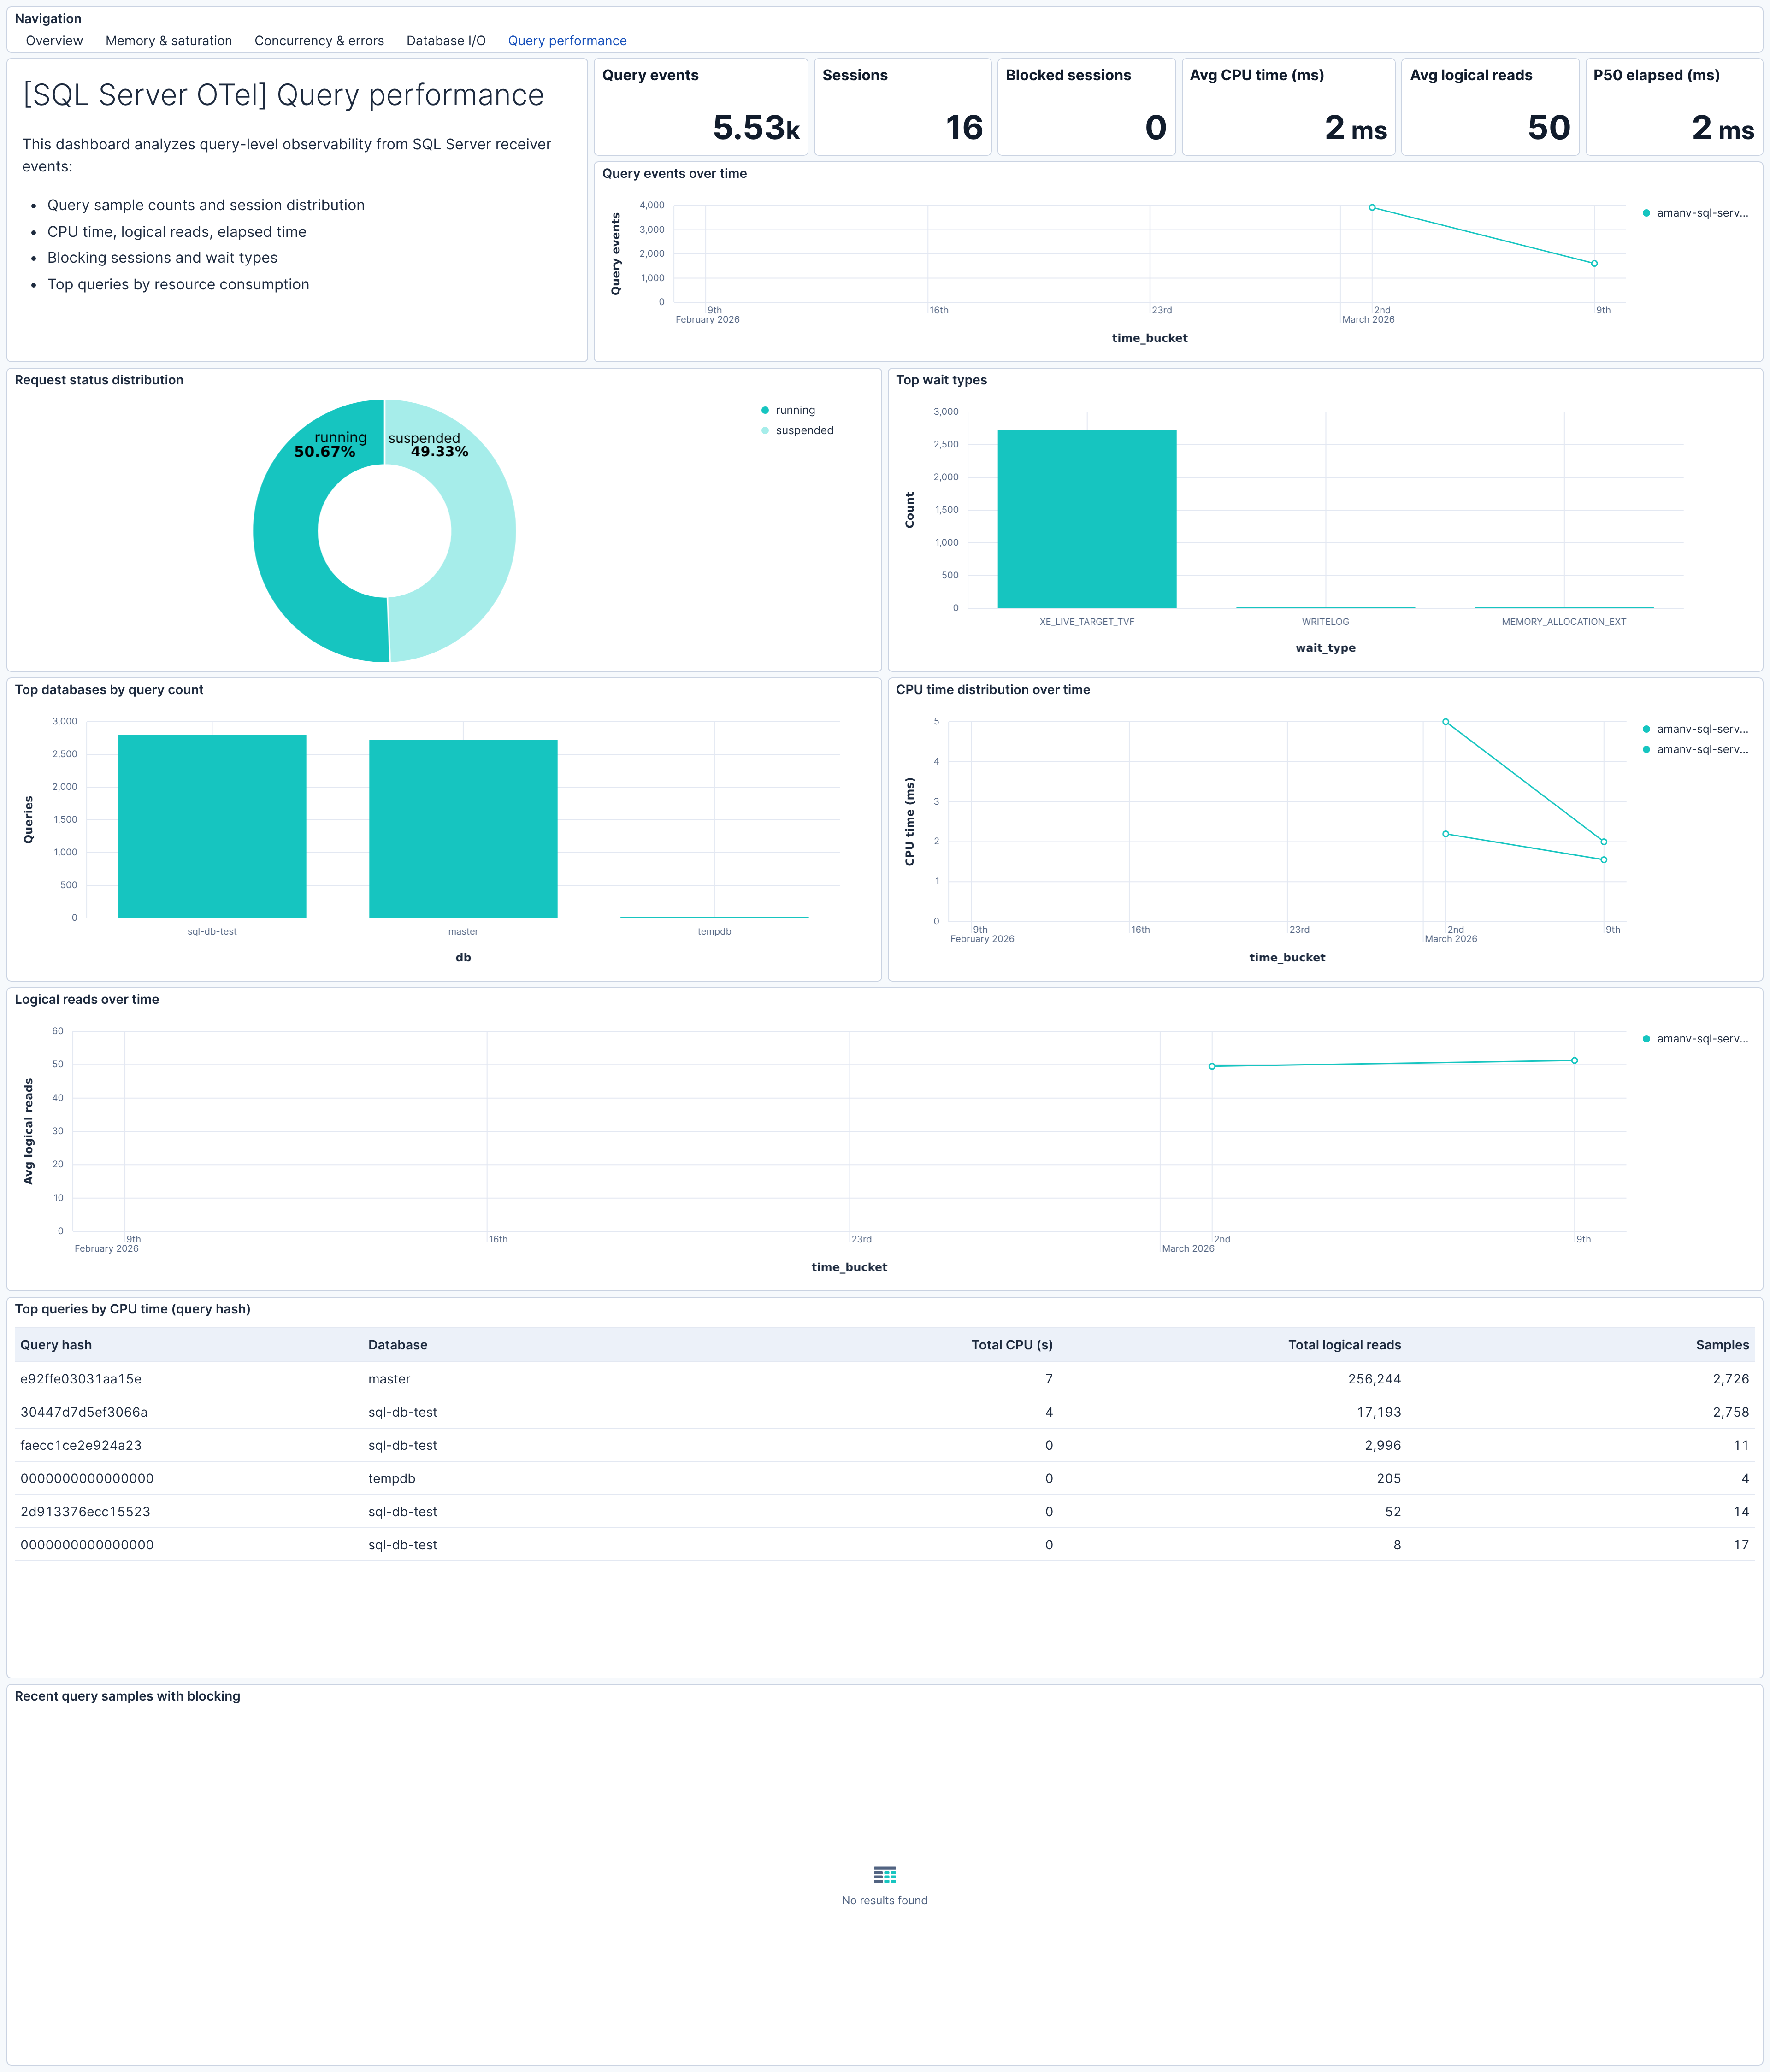
| **[SQL Server OTel] Query performance** | Query samples and top queries from db.server.query_sample and db.server.top_query events. |
## Alert rules
| Alert | Trigger | Severity |
|--------------------------------------------------|-------------------------------------------------|----------|
| **[SQL Server OTel] Page life expectancy low** | PLE below 300 seconds (severe memory pressure) | High |
| **[SQL Server OTel] Buffer cache hit ratio low** | Hit ratio below 95% | High |
| **[SQL Server OTel] Memory grants pending** | Queries waiting for memory grants | Critical |
| **[SQL Server OTel] Free list stalls** | Buffer pool cannot find free pages | Critical |
| **[SQL Server OTel] Deadlocks detected** | Non-zero deadlock rate | Critical |
| **[SQL Server OTel] Blocked processes** | Active blocking chains detected | Critical |
| **[SQL Server OTel] Lock wait rate high** | Lock wait rate above threshold | High |
| **[SQL Server OTel] Lock timeouts** | Queries timing out waiting for locks | High |
| **[SQL Server OTel] Execution errors** | Engine execution errors | High |
| **[SQL Server OTel] Database I/O latency high** | Per-file I/O latency above 100 ms per operation | High |
| **[SQL Server OTel] OS wait duration high** | Sustained wait time increase by wait type | High |
| **[SQL Server OTel] TempDB space low** | TempDB free space below 100 MB | High |
| **[SQL Server OTel] TempDB version store large** | Version store exceeds 1 GB | Medium |
| **[SQL Server OTel] Login rate spike** | Login rate above 50/s (connection storm) | Warning |
## SLO templates
| SLO | Target | Window | Description |
|--------------------------------------------------------------------|--------|----------------|-------------------------------------------------------------------------------|
| **[SQL Server OTel] Buffer cache hit ratio 99.5% rolling 30 days** | 99.5% | 30-day rolling | Percentage of 1-minute intervals with buffer cache hit ratio at or above 95%. |
| **[SQL Server OTel] Page life expectancy 99.5% rolling 30 days** | 99.5% | 30-day rolling | Percentage of 1-minute intervals with PLE at or above 300 seconds. |
| **[SQL Server OTel] Memory grants pending 99.5% rolling 30 days** | 99.5% | 30-day rolling | Percentage of 1-minute intervals with zero queries waiting for memory grants. |
| **[SQL Server OTel] Blocked processes 99.5% rolling 30 days** | 99.5% | 30-day rolling | Percentage of 1-minute intervals with zero blocked processes. |
| **[SQL Server OTel] Deadlock rate 99.5% rolling 30 days** | 99.5% | 30-day rolling | Percentage of 1-minute intervals with zero deadlocks per second. |
## Screenshots
This integration includes one or more Kibana dashboards that visualizes the data collected by the integration. The screenshots below illustrate how the ingested data is displayed.
## Changelog
| Version | Details | Minimum Kibana version |
|-----------|------------------------------------------------------------------------------------------------------------------------------------------------------------------------|------------------------|
| **0.1.0** | **Enhancement** ([View pull request](https://github.com/elastic/integrations/pull/17730))First release of the Microsoft SQL Server Assets for OpenTelemetry Collector. | 9.3.0 |