---
title: NVIDIA GPU OpenTelemetry Assets
description: NVIDIA Data Center GPU Manager (DCGM) is NVIDIA's telemetry and health management framework for monitoring GPU performance, temperature, memory, power,...
url: https://docs-v3-preview.elastic.dev/elastic/integration-docs/tree/main/reference/nvidia_gpu_otel
products:
- Elastic integrations
applies_to:
- Serverless Observability projects: Generally available
- Serverless Security projects: Generally available
- Elastic Stack: Generally available since 9.2
---
# NVIDIA GPU OpenTelemetry Assets
| | |
|-------------------------------------------------------------------------------------------------------------------------------|----------------------------------------------------------------|
| **Version** | 0.1.0 : Beta ([View all](#changelog)) |
| **Subscription level**[What's this?](https://www.elastic.co/subscriptions) | Basic |
| **Developed by**[What's this?](https://docs-v3-preview.elastic.dev/elastic/integration-docs/tree/main/reference/developed-by) | Elastic |
| **Minimum Kibana version(s)** | 9.2.1 |
To use beta integrations, go to the **Integrations** page in Kibana, scroll down, and toggle on the _Display beta integrations_ option.
NVIDIA Data Center GPU Manager (DCGM) is NVIDIA's telemetry and health management framework for monitoring GPU performance, temperature, memory, power, and hardware errors in data center environments.
This content pack provides dashboards, alert rules, and SLO templates for NVIDIA GPU metrics collected via the OpenTelemetry Collector's Prometheus receiver scraping the DCGM exporter. The assets cover GPU thermal health, compute and memory utilization, power consumption, clock frequencies, framebuffer memory, and XID hardware errors.
## Compatibility
The NVIDIA GPU OpenTelemetry assets have been tested with the OpenTelemetry Collector Contrib Prometheus receiver v0.146.1, scraping metrics from the NVIDIA DCGM exporter.
DCGM exporter tested against:
- DCGM exporter v3.3.9
## Requirements
You need Elasticsearch for storing and searching your data and Kibana for visualizing and managing it.
You can use our hosted Elasticsearch Service on Elastic Cloud, which is recommended, or self-manage
the Elastic Stack on your own hardware.
## Setup
### Prerequisites
The NVIDIA DCGM exporter must be running and exposing a Prometheus `/metrics` endpoint. In Kubernetes environments, dcgm-exporter is typically deployed as a DaemonSet on GPU nodes.
Verify that the DCGM exporter is accessible:
```bash
curl http://:9400/metrics
```
You should see Prometheus-formatted metrics with names starting with `DCGM_FI_`.
### Configuration
Configure the OpenTelemetry Collector (or EDOT Collector) to scrape DCGM metrics and export them to Elasticsearch.
Placeholders used in the configuration below:
- `` — Hostname or IP of the DCGM exporter (e.g. `localhost`)
- `` — Port of the DCGM exporter (e.g. `9400`)
- `` — Your Elasticsearch endpoint (e.g. `https://my-cluster.es.io:443`)
- `${env:ES_API_KEY}` — Elasticsearch API key, set via the `ES_API_KEY` environment variable
```yaml
receivers:
prometheus/nvidia_gpu:
config:
scrape_configs:
- job_name: nvidia_gpu
scrape_interval: 10s
metrics_path: /metrics
scheme: http
static_configs:
- targets:
- :
processors:
resourcedetection/system:
detectors: [system]
system:
hostname_sources: [os]
resource/nvidia_gpu:
attributes:
- key: data_stream.dataset
value: nvidia_gpu
action: upsert
exporters:
elasticsearch/otel:
endpoint:
api_key: ${env:ES_API_KEY}
mapping:
mode: otel
service:
pipelines:
metrics:
receivers: [prometheus/nvidia_gpu]
processors: [resourcedetection/system, resource/nvidia_gpu]
exporters: [elasticsearch/otel]
```
## Reference
### Metrics
Refer to the NVIDIA DCGM exporter documentation for the full list of available metrics. The key metrics used by the generated assets are:
| Metric | Type | Description |
|----------------------------------------|---------|-------------------------------------------------|
| `DCGM_FI_DEV_GPU_TEMP` | Gauge | GPU core temperature in degrees Celsius |
| `DCGM_FI_DEV_MEMORY_TEMP` | Gauge | GPU memory temperature in degrees Celsius |
| `DCGM_FI_DEV_GPU_UTIL` | Gauge | GPU compute utilization percentage |
| `DCGM_FI_DEV_MEM_COPY_UTIL` | Gauge | Memory bandwidth utilization percentage |
| `DCGM_FI_DEV_POWER_USAGE` | Gauge | Current power draw in watts |
| `DCGM_FI_DEV_FB_USED` | Gauge | Used framebuffer memory in MiB |
| `DCGM_FI_DEV_FB_FREE` | Gauge | Free framebuffer memory in MiB |
| `DCGM_FI_DEV_SM_CLOCK` | Gauge | Streaming Multiprocessor clock frequency in MHz |
| `DCGM_FI_DEV_MEM_CLOCK` | Gauge | Memory clock frequency in MHz |
| `DCGM_FI_DEV_ENC_UTIL` | Gauge | Hardware encoder utilization percentage |
| `DCGM_FI_DEV_DEC_UTIL` | Gauge | Hardware decoder utilization percentage |
| `DCGM_FI_DEV_XID_ERRORS` | Gauge | XID error value (0 = no error) |
| `DCGM_FI_DEV_TOTAL_ENERGY_CONSUMPTION` | Counter | Total energy consumed since boot in millijoules |
| `DCGM_FI_DEV_PCIE_REPLAY_COUNTER` | Counter | PCIe packet retransmission count |
| `DCGM_FI_DEV_NVLINK_BANDWIDTH_TOTAL` | Counter | Total NVLink data transferred in bytes |
## Dashboards
| Dashboard | Description |
|--------------------------------|-------------------------------------------------------------------------------------------------------------------------------------|
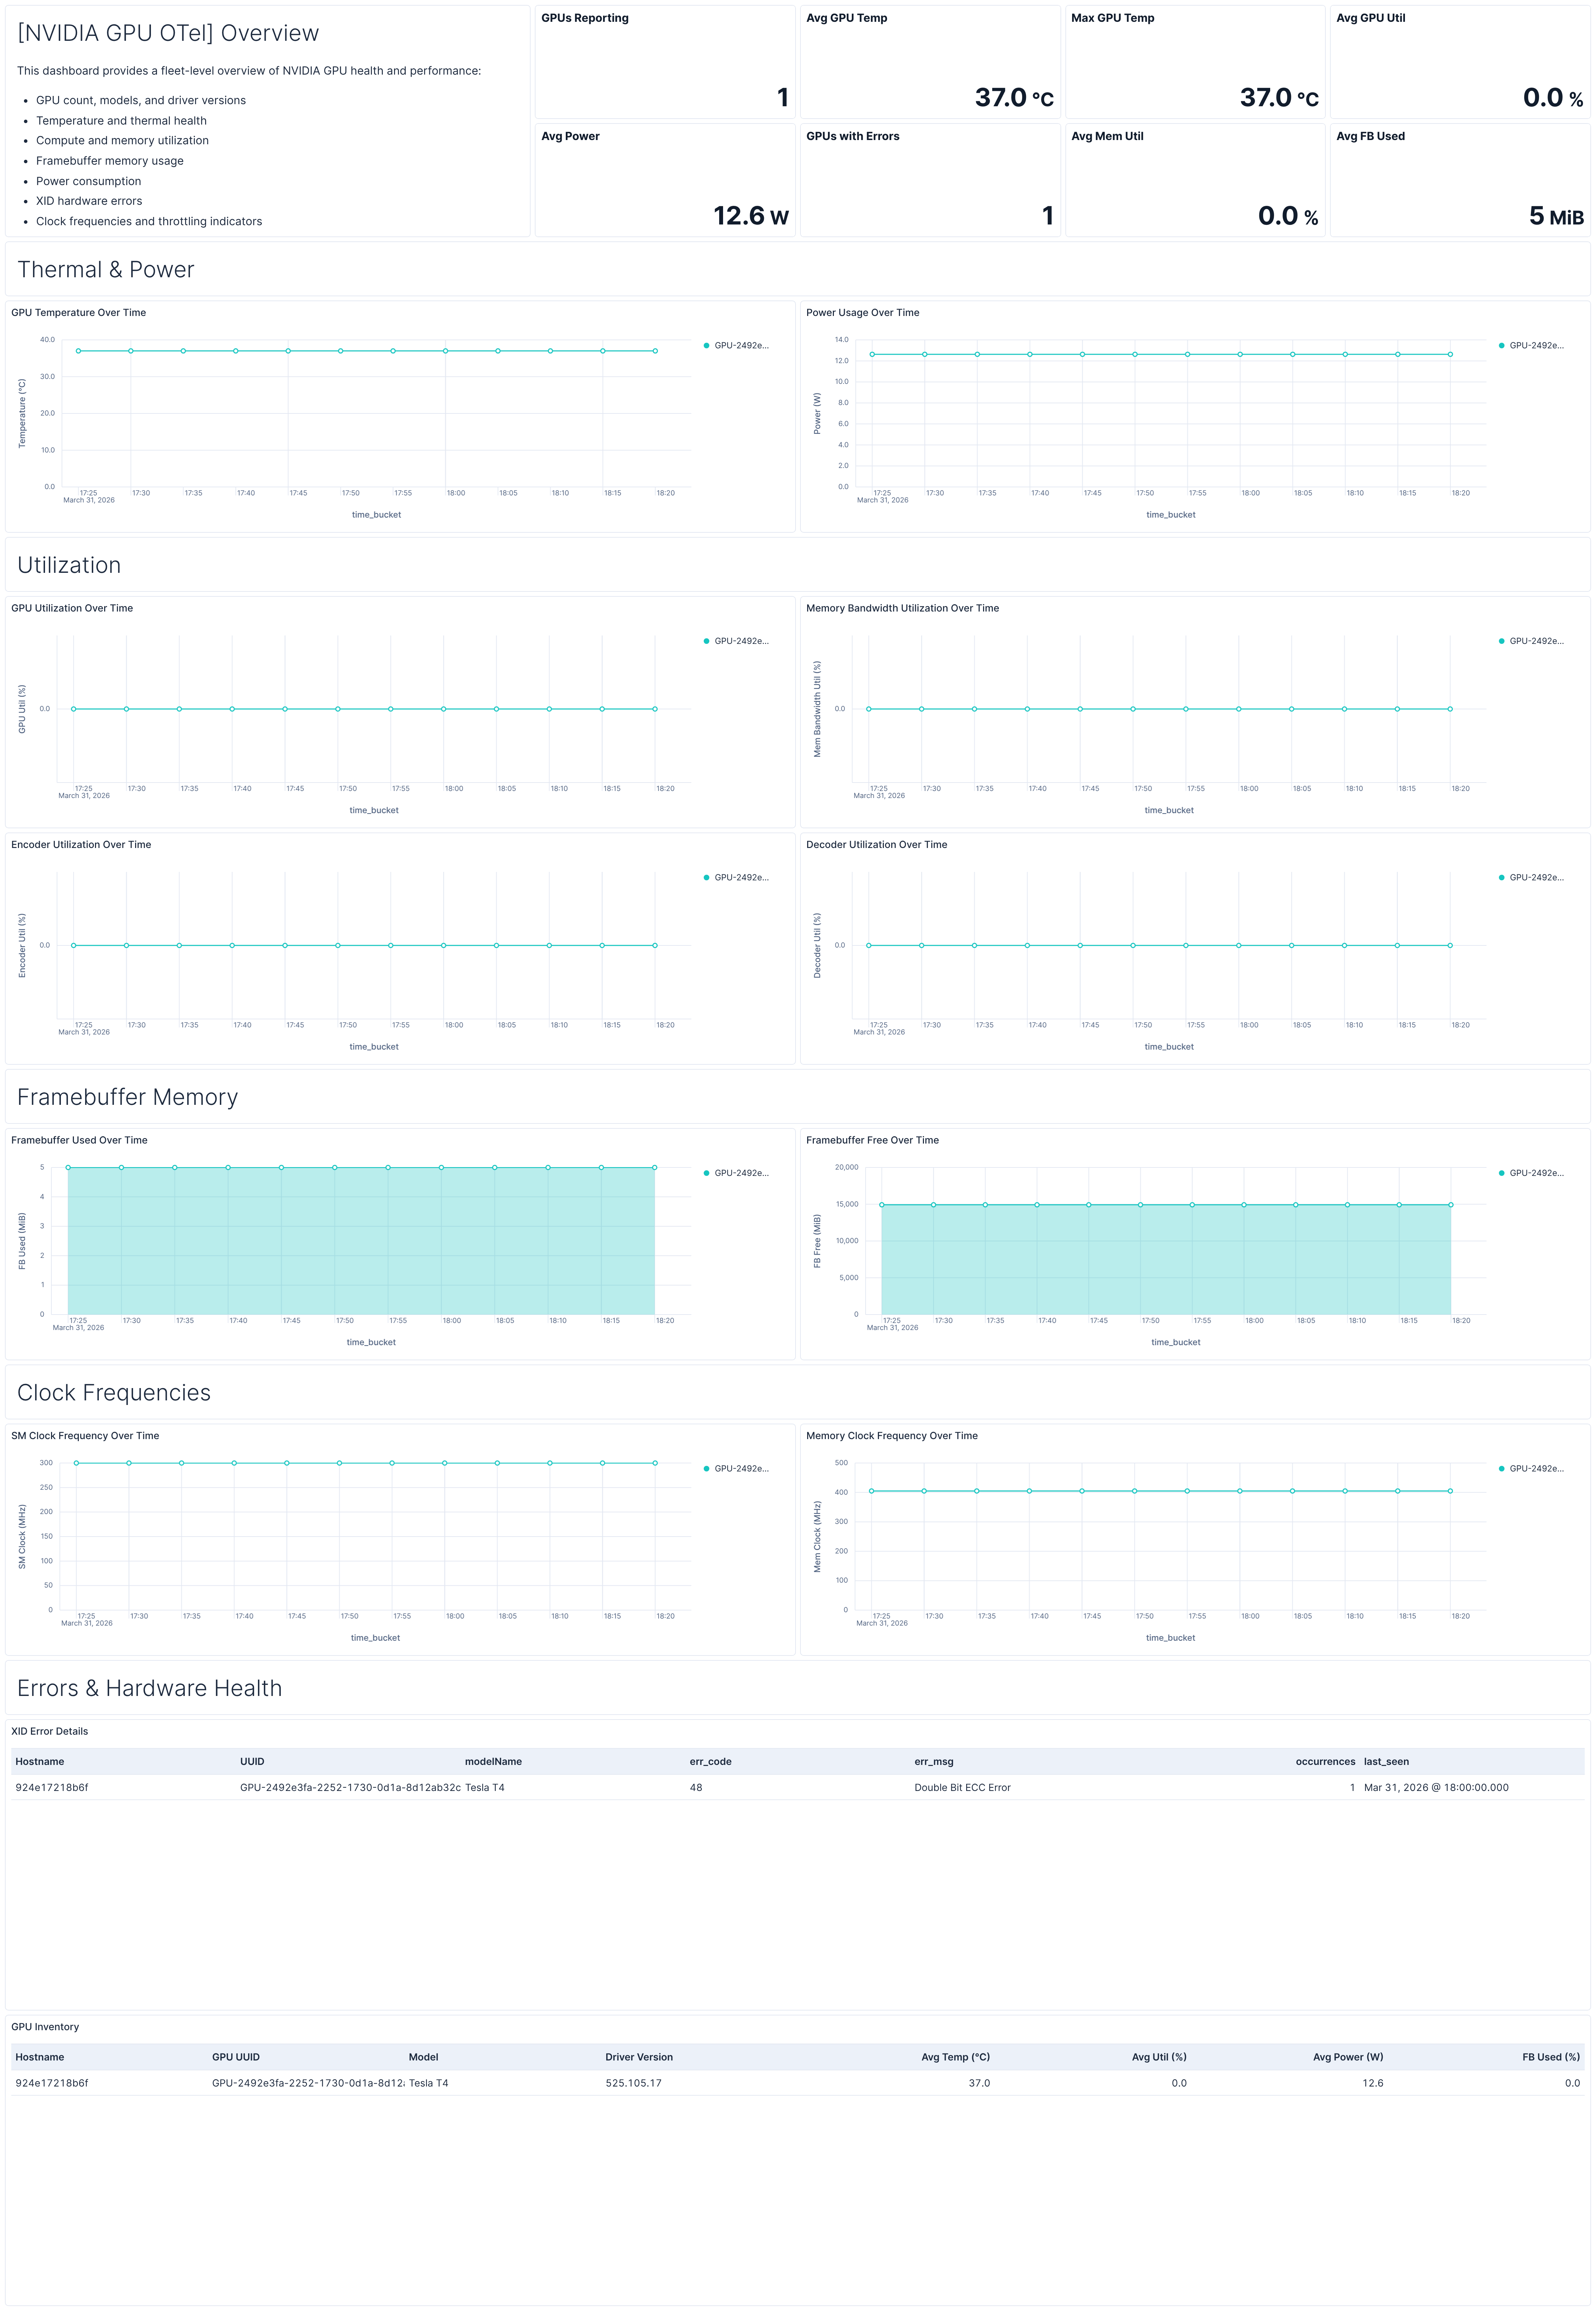
| **[NVIDIA GPU OTel] Overview** | Fleet-level overview of GPU health covering temperature, utilization, memory, power, clocks, errors, and a per-GPU inventory table. |
## Alert rules
| Alert | Trigger | Severity |
|------------------------------------------------------------|---------------------------------------------------------------------------------|----------|
| **[NVIDIA GPU OTel] GPU temperature critical** | GPU temperature exceeds 83°C for 3 consecutive checks | Critical |
| **[NVIDIA GPU OTel] XID errors detected** | Non-zero XID errors reported by any GPU | Critical |
| **[NVIDIA GPU OTel] Framebuffer memory utilization high** | Framebuffer memory usage exceeds 90% for 3 consecutive checks | High |
| **[NVIDIA GPU OTel] GPU utilization saturated** | Average GPU utilization exceeds 95% for 3 consecutive checks over 15 minutes | Medium |
| **[NVIDIA GPU OTel] GPU idle during expected workload** | GPU utilization stays below 1% for 30 minutes (6 consecutive checks) | Warning |
| **[NVIDIA GPU OTel] Clock frequency throttled under load** | SM clock drops below 70% of observed maximum while GPU utilization is above 50% | Medium |
## SLO templates
| SLO | Target | Window | Description |
|-----------------------------------------------------------------------------|--------|----------------|----------------------------------------------------------------------------------------------------------------------|
| **[NVIDIA GPU OTel] GPU temperature below threshold 99.5% rolling 30 days** | 99.5% | 30-day rolling | Tracks that GPU core temperature remains below the 83°C thermal throttling threshold across 5-minute time intervals. |
## Screenshots
This integration includes one or more Kibana dashboards that visualizes the data collected by the integration. The screenshots below illustrate how the ingested data is displayed.
## Changelog
| Version | Details | Minimum Kibana version |
|-----------|-----------------------------------------------------------------------------------------------------------------------|------------------------|
| **0.1.0** | **Enhancement** ([View pull request](https://github.com/elastic/integrations/pull/18160))Initial draft of the package | 9.2.1 |