---
title: Oracle Database OTel Content Pack
description: This content pack provides monitoring for Oracle Database instances via the OpenTelemetry oracledbreceiver. It targets SREs and database administrators...
url: https://docs-v3-preview.elastic.dev/elastic/integration-docs/tree/main/reference/oracle_otel
products:
- Elastic integrations
applies_to:
- Serverless Observability projects: Generally available
- Serverless Security projects: Generally available
- Elastic Stack: Generally available since 9.3
---
# Oracle Database OTel Content Pack
| | |
|-------------------------------------------------------------------------------------------------------------------------------|----------------------------------------------------------------|
| **Version** | 0.1.0 : Beta ([View all](#changelog)) |
| **Subscription level**[What's this?](https://www.elastic.co/subscriptions) | Basic |
| **Developed by**[What's this?](https://docs-v3-preview.elastic.dev/elastic/integration-docs/tree/main/reference/developed-by) | Elastic |
| **Minimum Kibana version(s)** | 9.3.0 |
To use beta integrations, go to the **Integrations** page in Kibana, scroll down, and toggle on the _Display beta integrations_ option.
## Overview
This content pack provides monitoring for Oracle Database instances via the OpenTelemetry `oracledbreceiver`. It targets SREs and database administrators managing production Oracle deployments.
The pack operates on two data streams:
- **`metrics-oracledbreceiver.otel-*`** — Instance-level metrics (resource capacity, SQL execution, I/O, memory, locking, transaction health, storage). Powers the metrics dashboards: **[Metrics Oracle] Overview**, **[Metrics Oracle] Resource Capacity, Sessions & Locking**, **[Metrics Oracle] SQL Execution, I/O & Cache Performance**, and **[Metrics Oracle] Transaction Health & Storage Management**.
- **`logs-oracledbreceiver.otel-*`** — Per-query log events. Powers **[Logs Oracle] Active Query Analysis** and **[Logs Oracle] Query Performance & Plans** for active session analysis and top-N query optimization.
## Prerequisites
- **OTel Collector Contrib** — Use a version that includes the `oracledbreceiver`. See the [OpenTelemetry Collector Contrib](https://github.com/open-telemetry/opentelemetry-collector-contrib) documentation for compatibility.
- **Oracle Database** — Supported versions are defined in the oracledbreceiver documentation.
- **Receiver permissions** — The database user must have the grants required by the oracledbreceiver for base metrics. Consult the oracledbreceiver documentation for the exact list.
For per-query analysis in **[Logs Oracle] Active Query Analysis** and **[Logs Oracle] Query Performance & Plans**, additional Oracle grants are required. See *Query Event Configuration*.
## Dashboards
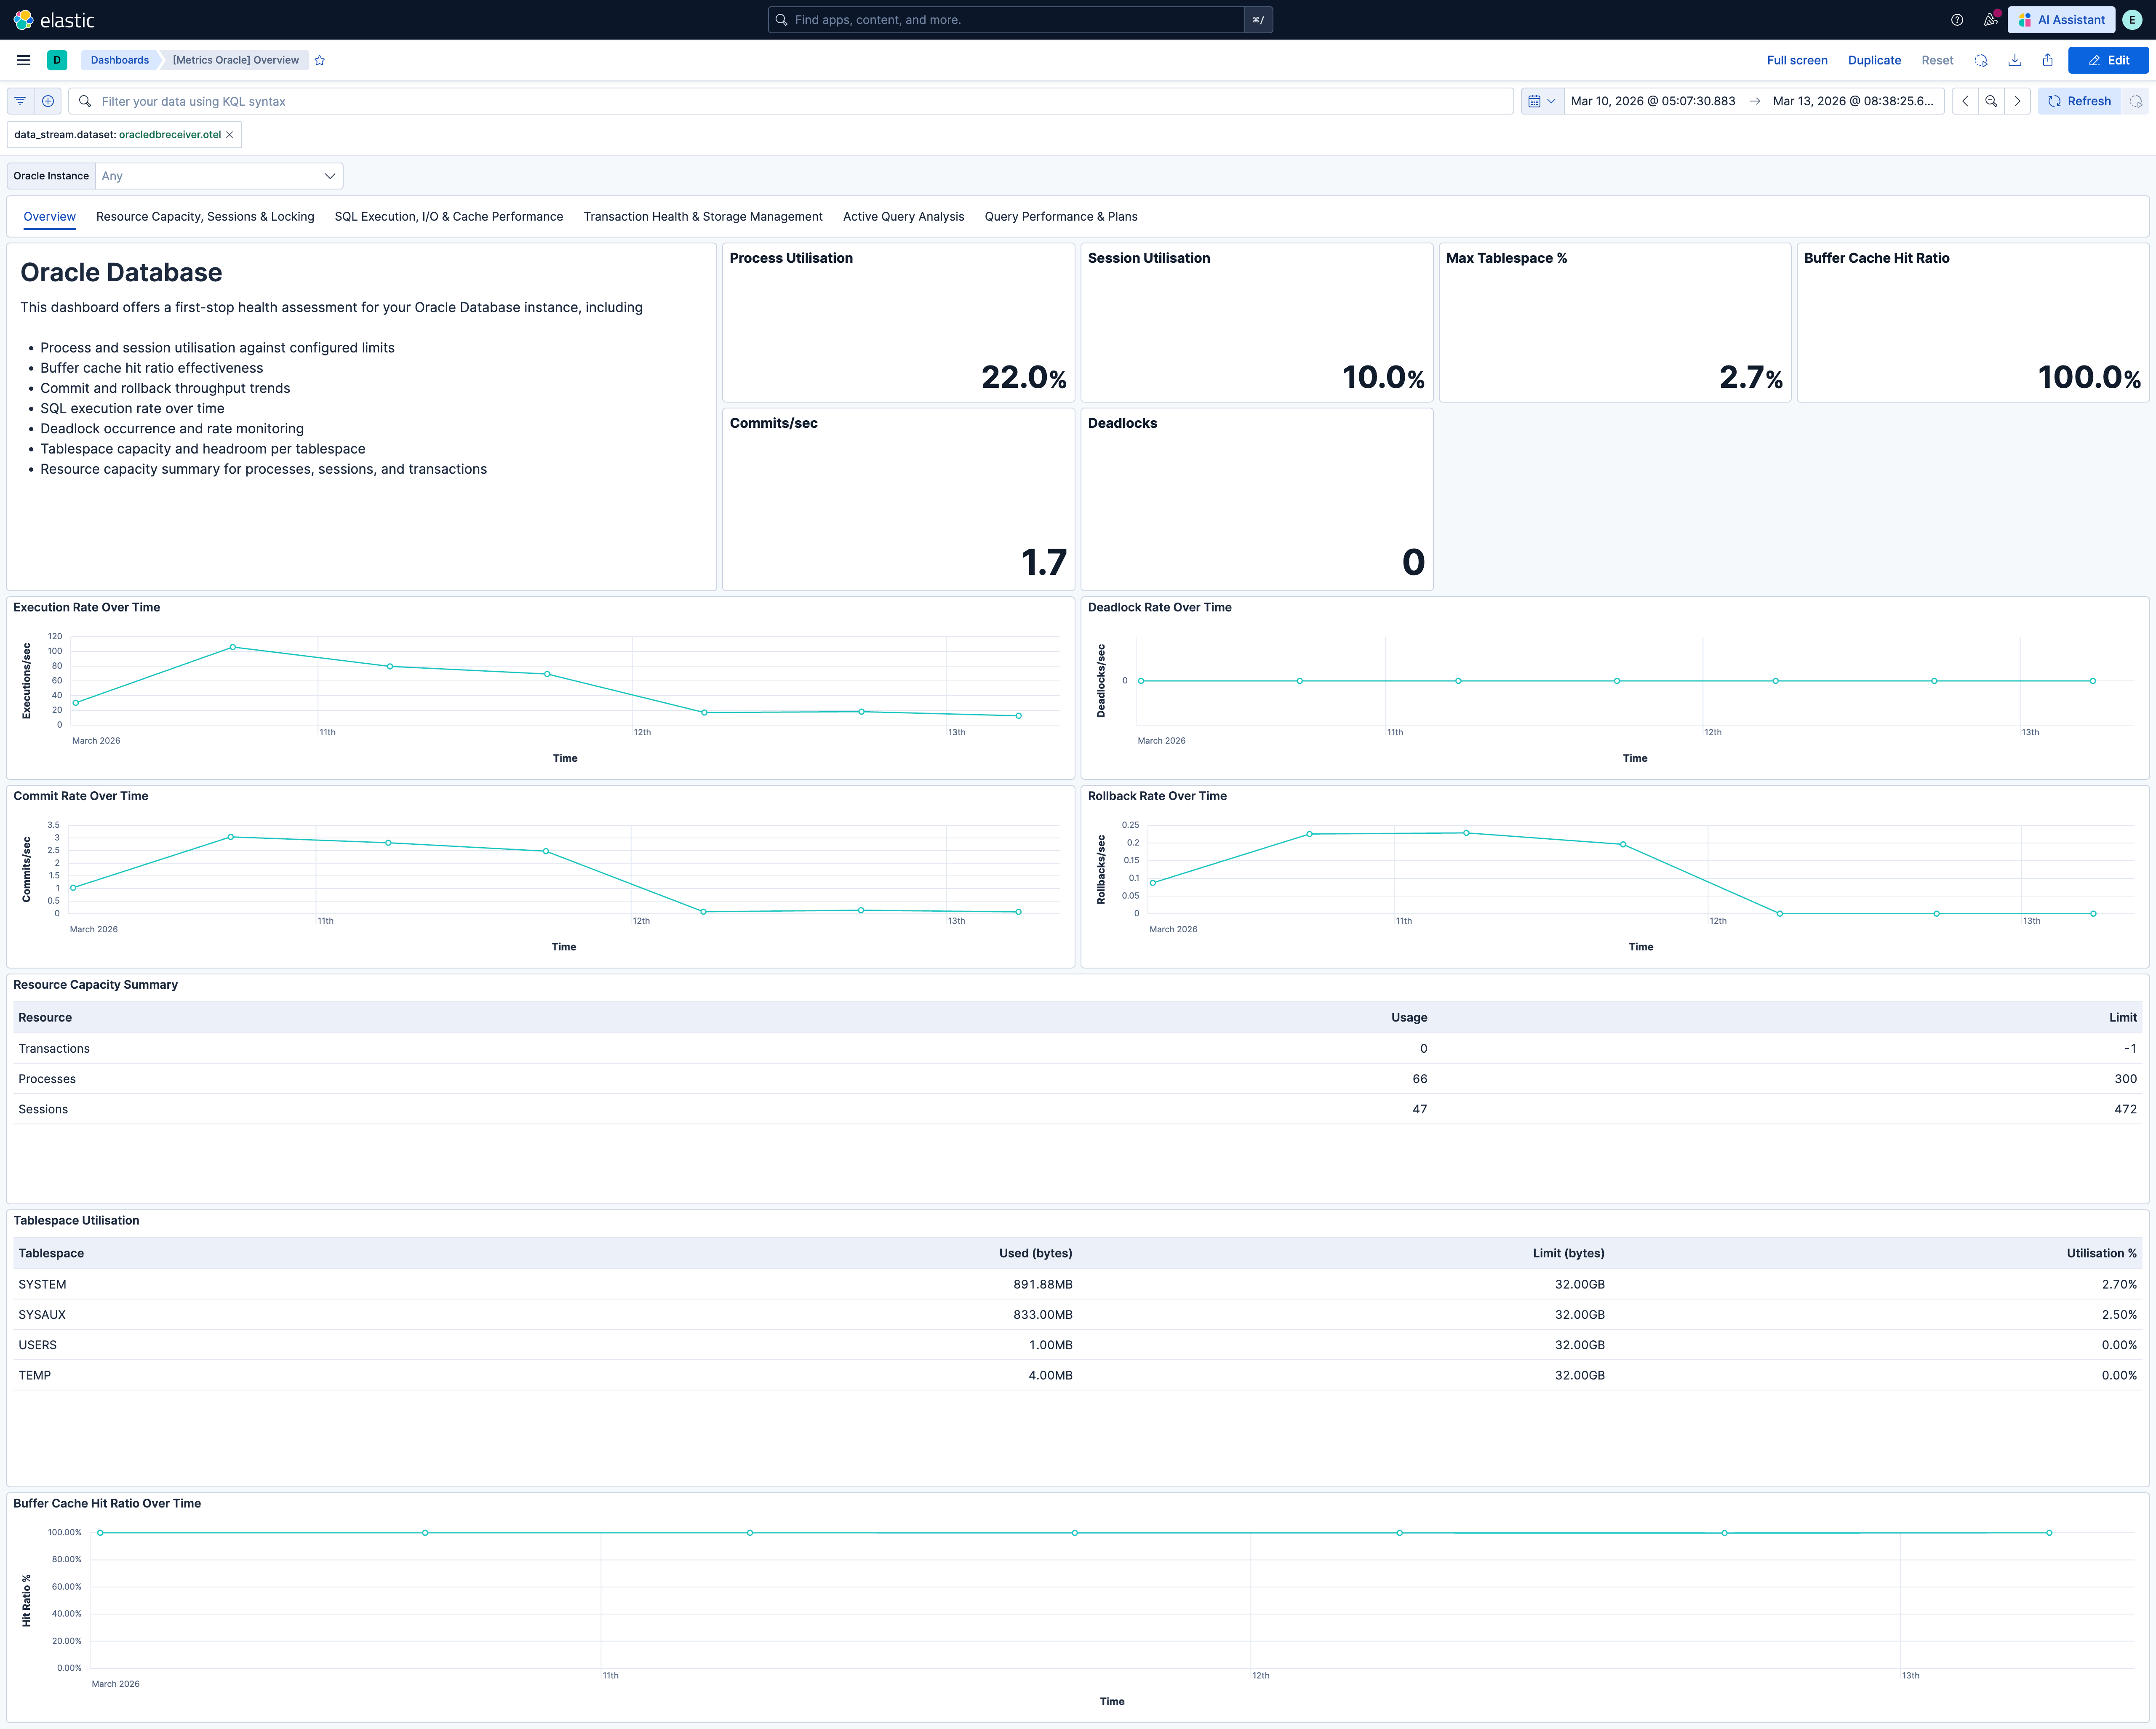
### 1. [Metrics Oracle] Overview
**Purpose:** First-stop health assessment. Answers: "Is the Oracle instance healthy?"
**Data source:** `metrics-oracledbreceiver.otel-*`
**Key panels:** Process utilisation, session utilisation, buffer cache hit ratio, commit rate, deadlocks in time range, max tablespace utilisation. Execution rate, deadlock rate, commit rate, and rollback rate over time. Resource capacity summary table. Tablespace utilisation table. Buffer cache hit ratio over time.
**Derived metrics:** Buffer cache hit ratio = `1 - (physical_reads / logical_reads)` (displayed as %). Process/session utilisation = usage / limit. Rollback-to-commit ratio (via user_commits and user_rollbacks).
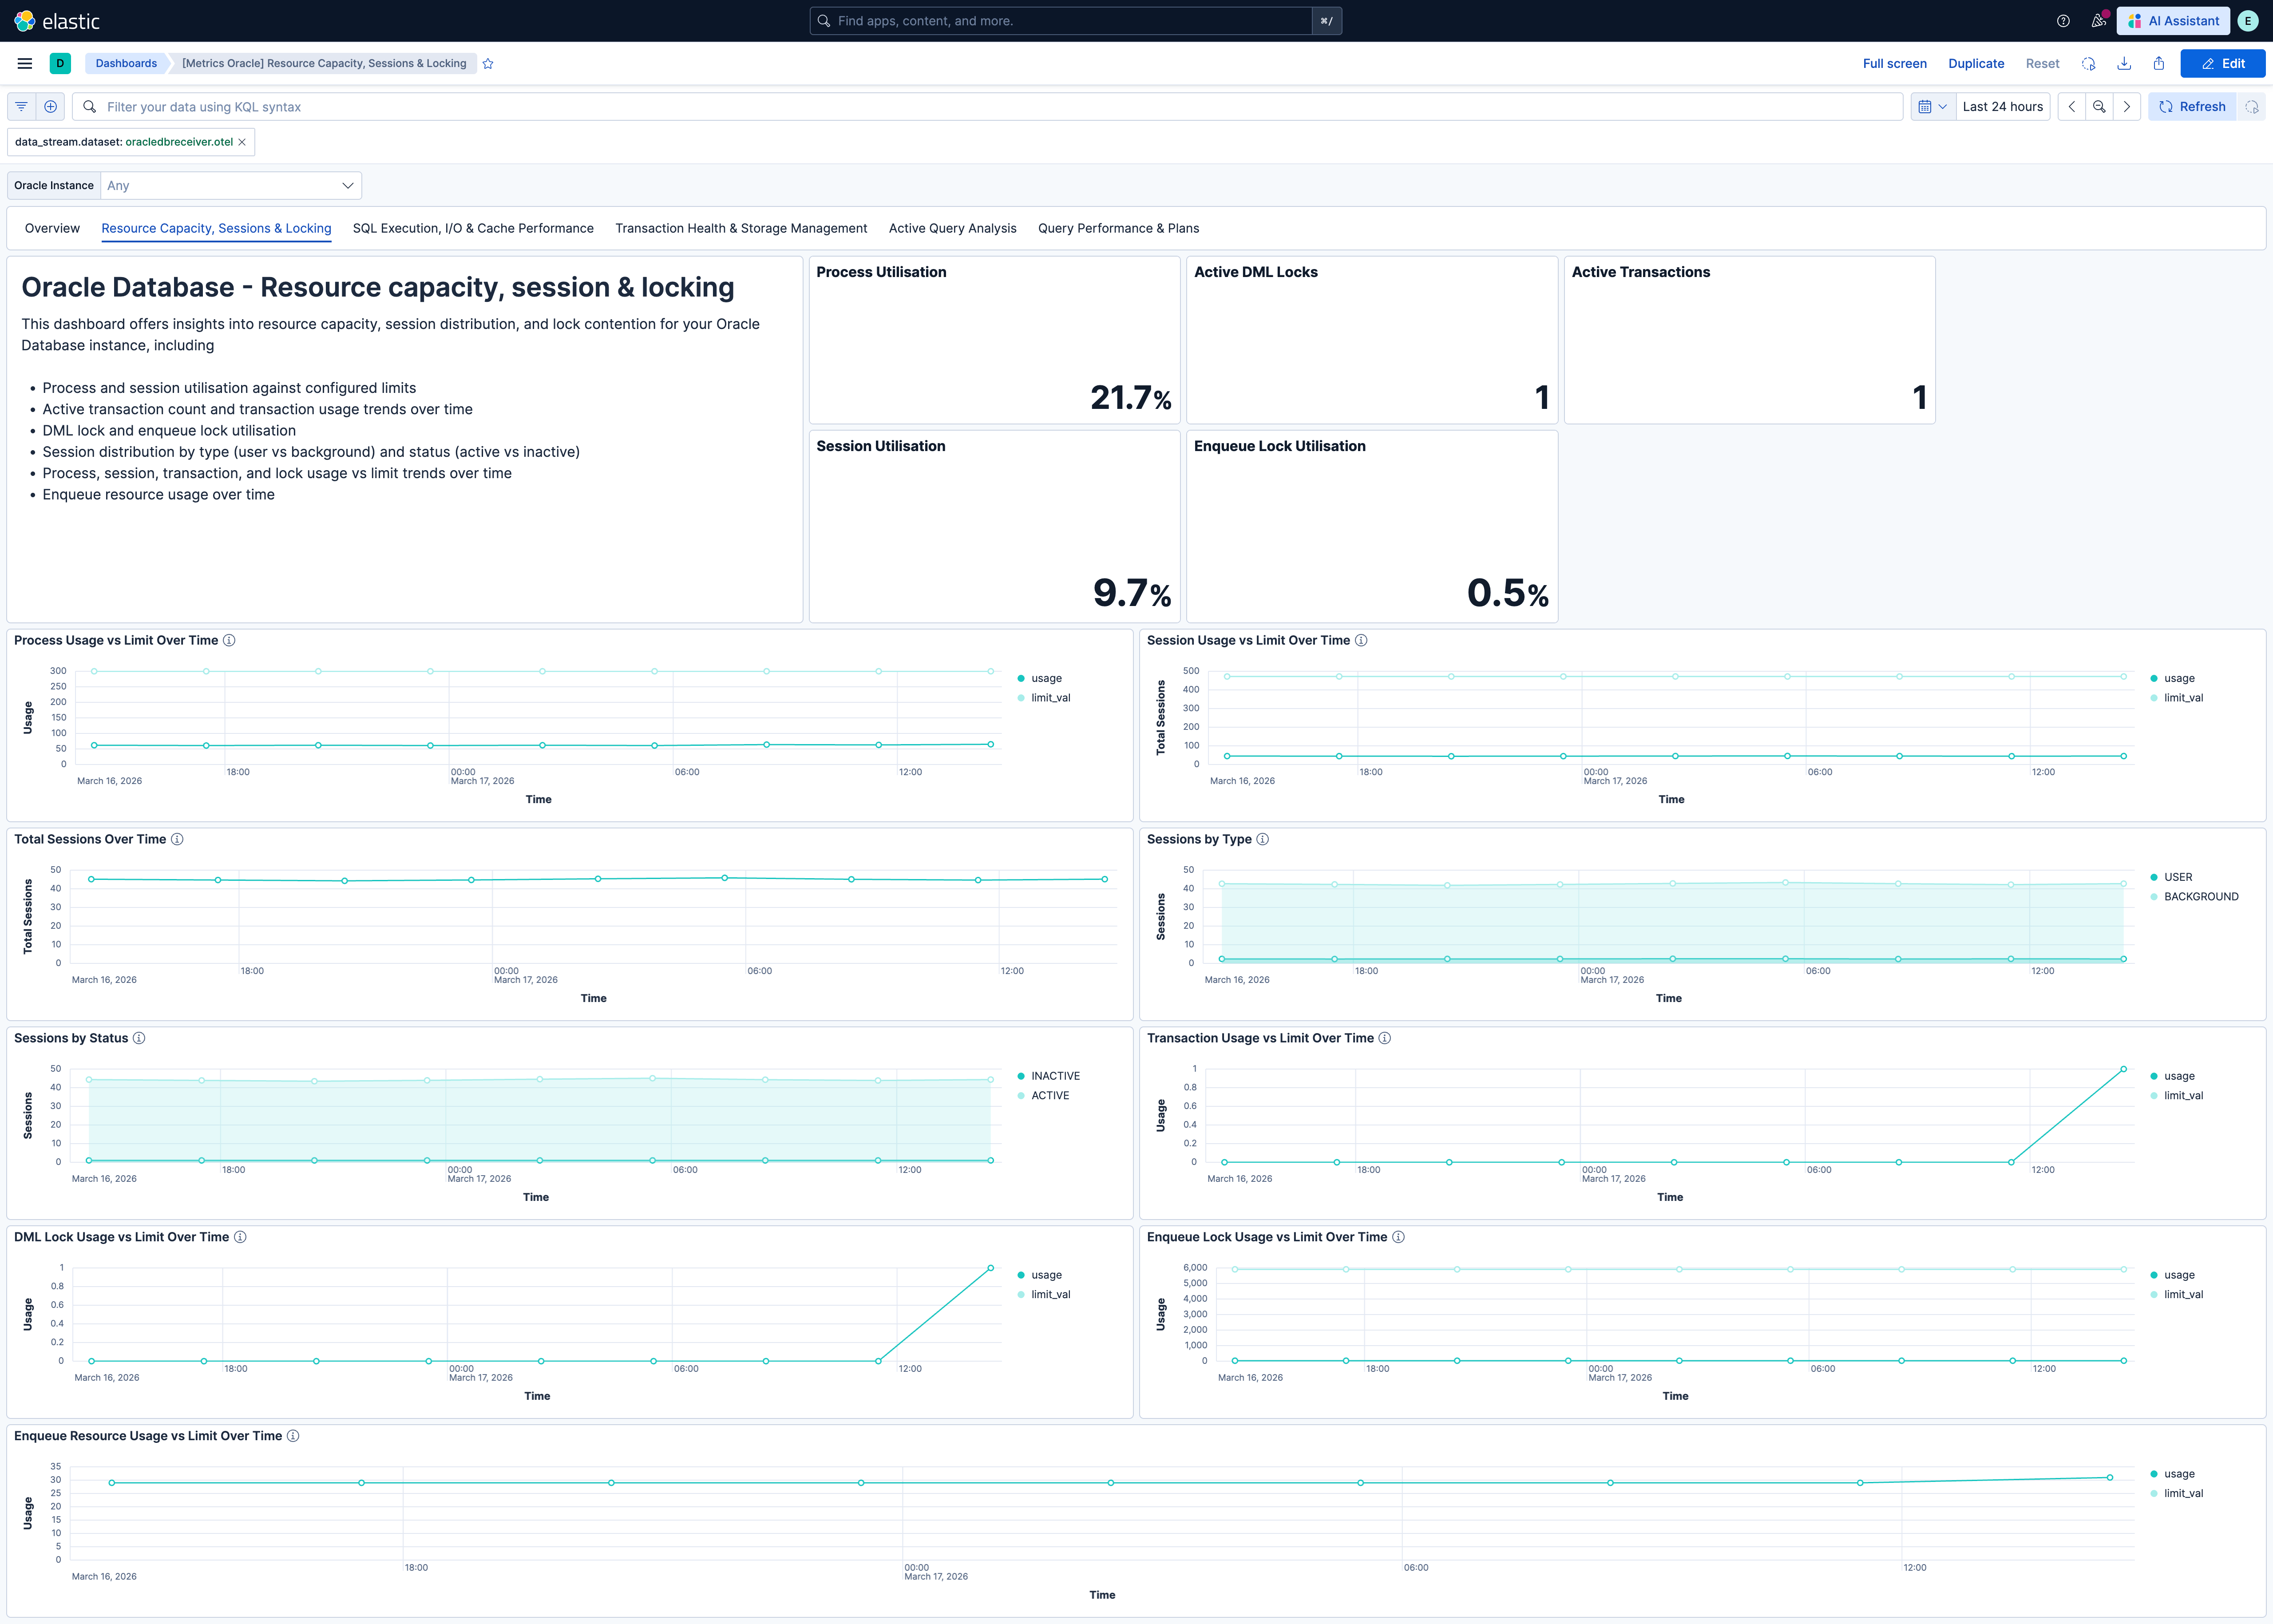
### 2. [Metrics Oracle] Resource Capacity, Sessions & Locking
**Purpose:** Deep dive into connection capacity and resource contention. Answers: "Are we approaching any resource limits? How are sessions distributed? Is lock contention emerging?"
**Data source:** `metrics-oracledbreceiver.otel-*`
**Key panels:** Process, session, DML lock, and enqueue lock utilisation stats. Process and session usage vs limit over time. Total sessions, sessions by type (USER/BACKGROUND), sessions by status (ACTIVE/INACTIVE). Transaction, DML lock, enqueue lock, and enqueue resource usage vs limit over time.
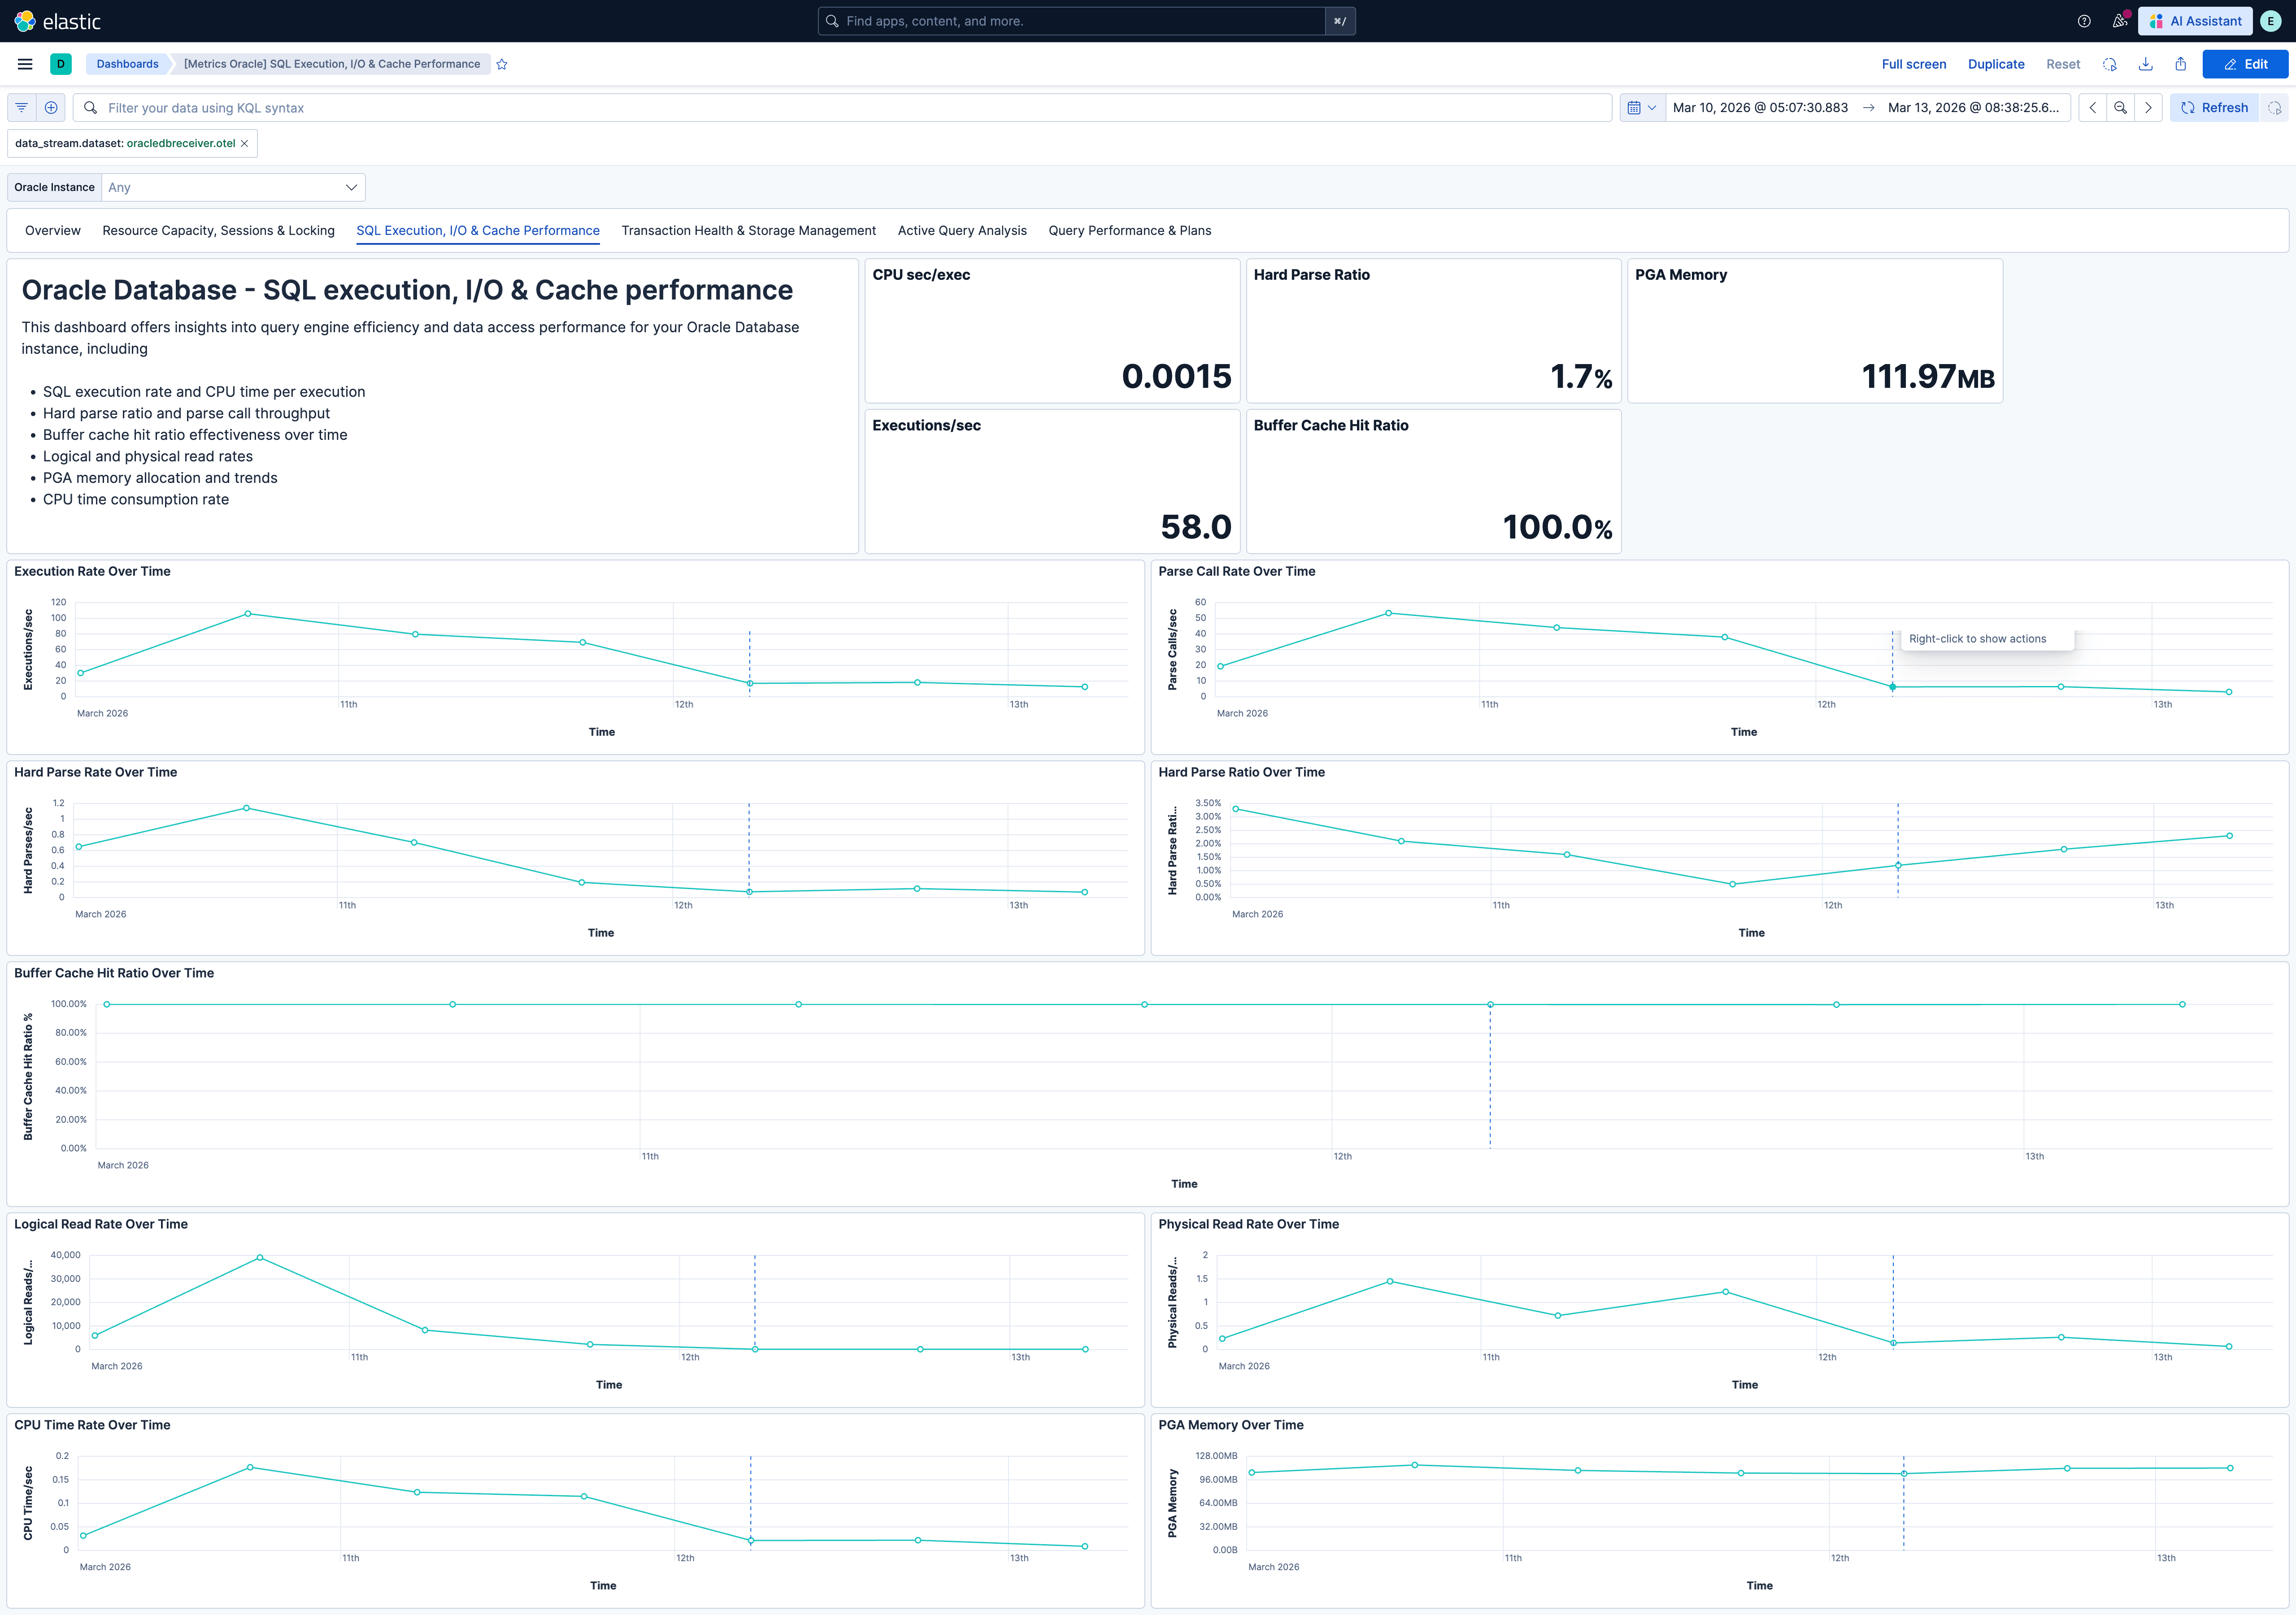
### 3. [Metrics Oracle] SQL Execution, I/O & Cache Performance
**Purpose:** Query engine efficiency and data access performance. Answers: "Are applications using the database efficiently? Is the buffer cache effective? Is the instance doing excessive disk I/O?"
**Data source:** `metrics-oracledbreceiver.otel-*`
**Key panels:** Execution rate, hard parse ratio, buffer cache hit ratio, CPU time per execution, PGA memory. Execution rate, parse call rate, hard parse rate, hard parse ratio over time. Buffer cache hit ratio, logical read rate, physical read rate over time. CPU time rate and PGA memory over time.
**Derived metrics:** Buffer cache hit ratio = `1 - (physical_reads / logical_reads)`. Hard parse ratio = `hard_parses / parse_calls`. CPU time per execution = `delta(cpu_time) / delta(executions)`.
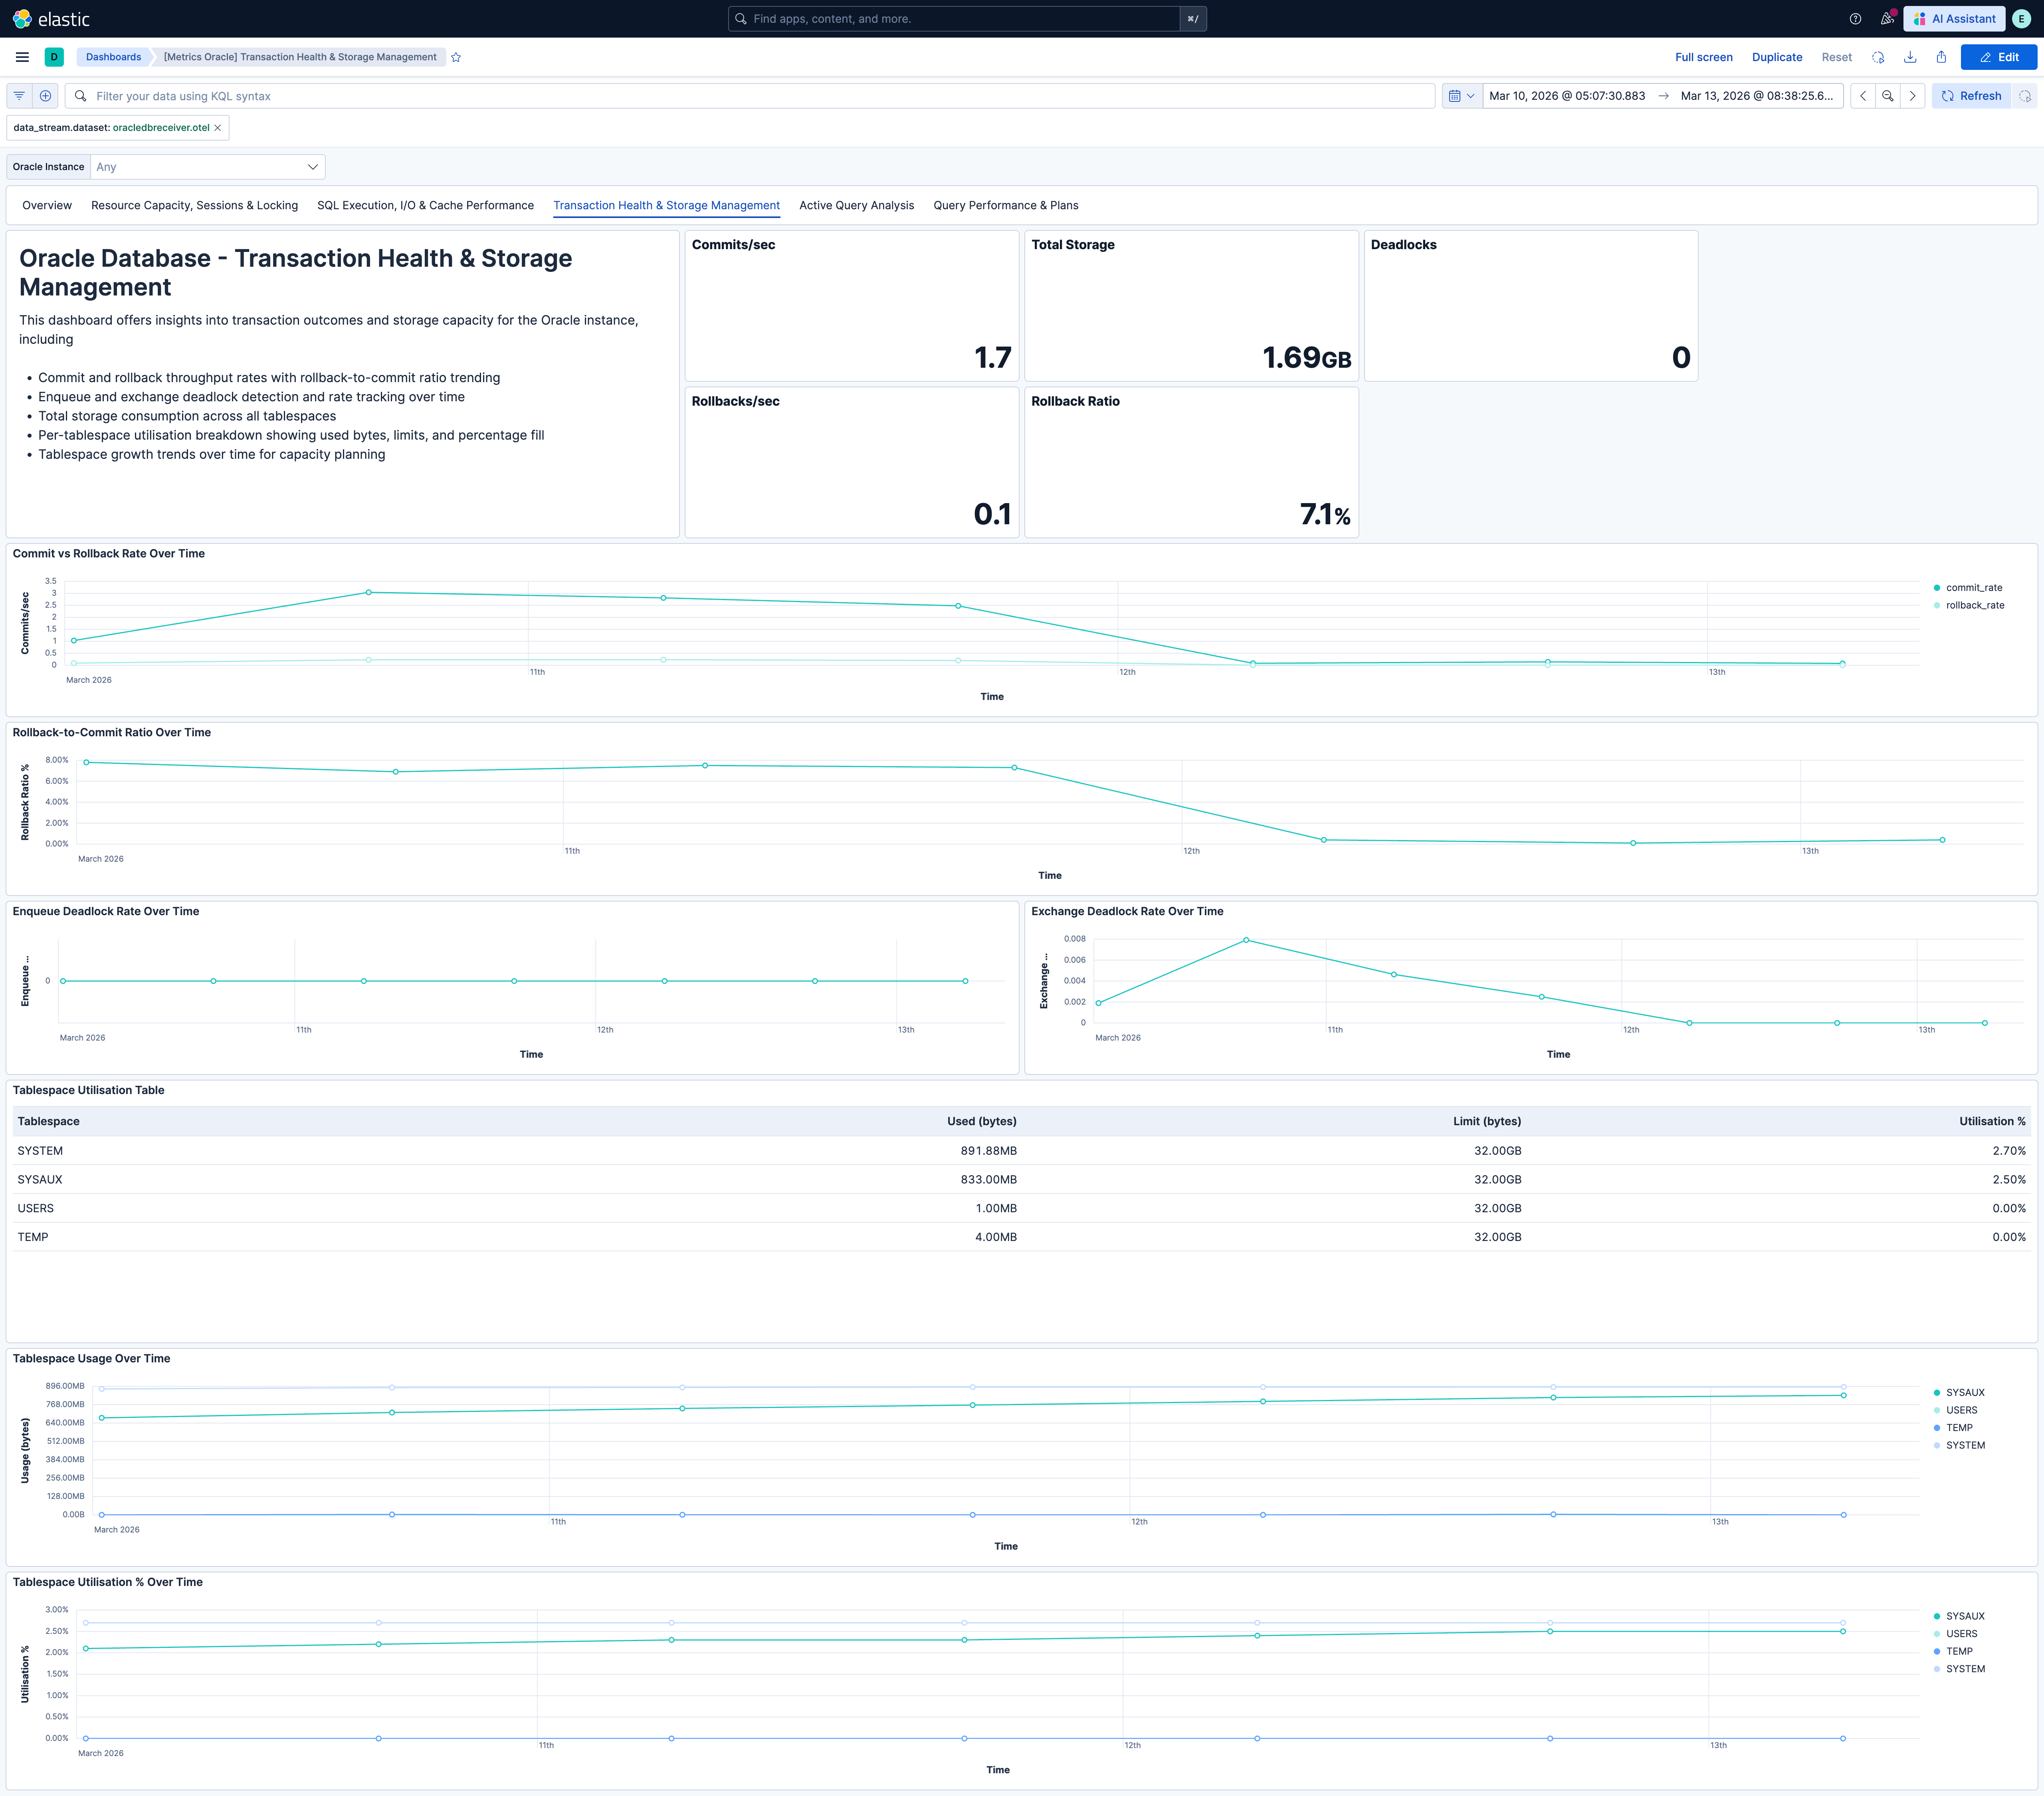
### 4. [Metrics Oracle] Transaction Health & Storage Management
**Purpose:** Transaction outcomes and tablespace capacity. Answers: "Are transactions succeeding? Are deadlocks occurring? Which tablespaces are growing?"
**Data source:** `metrics-oracledbreceiver.otel-*`
**Key panels:** Commit rate, rollback rate, rollback-to-commit ratio, deadlocks in time range, total storage consumed. Commit vs rollback rate over time. Rollback-to-commit ratio over time. Enqueue and exchange deadlock rate over time. Tablespace utilisation table. Tablespace usage and utilisation % over time by tablespace.
**Derived metrics:** Rollback-to-commit ratio = `user_rollbacks / (user_commits + user_rollbacks)`. Tablespace utilisation = usage / limit per tablespace.
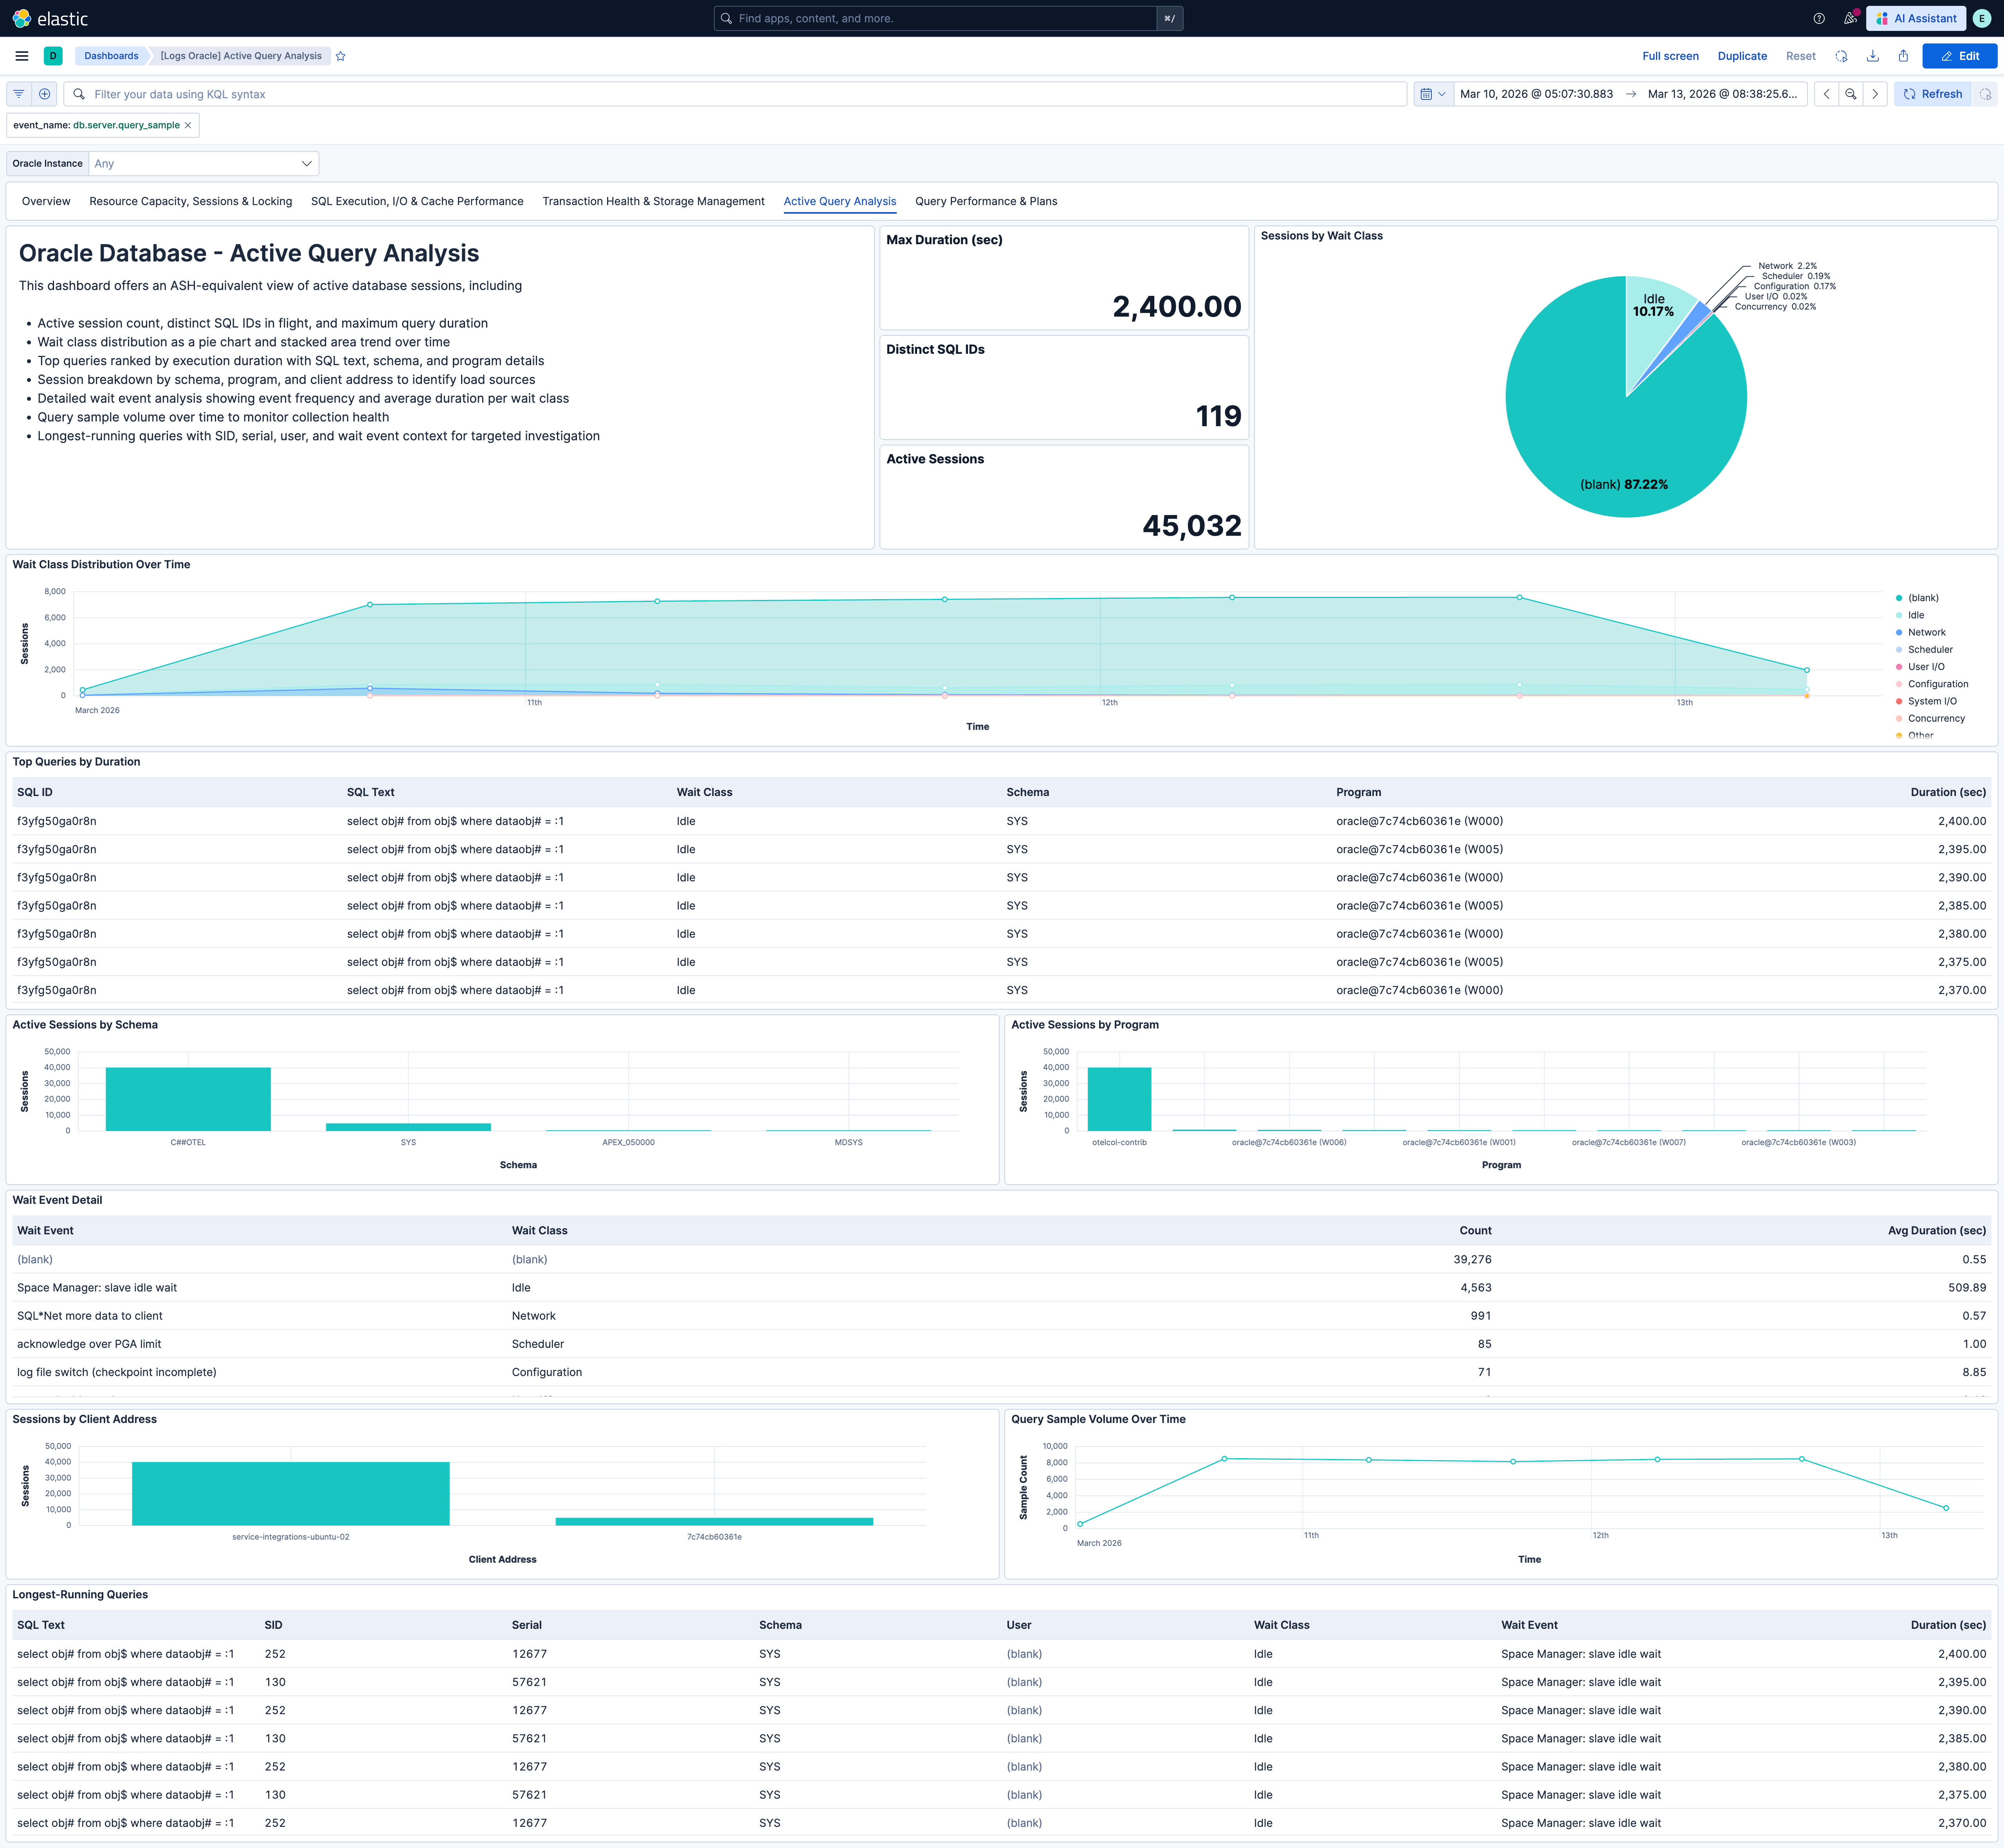
### 5. [Logs Oracle] Active Query Analysis
**Purpose:** Real-time view of currently executing queries (ASH-equivalent). Answers: "What is running right now? What are sessions waiting on? Which schemas, programs, and clients are driving load?"
**Data source:** `logs-oracledbreceiver.otel-*` filtered by `event_name == "db.server.query_sample"`
**Key panels:** Sampled active sessions, distinct active SQL IDs, max query duration. Sessions by wait class (donut), wait class distribution over time. Top queries by duration (SQL text, duration, wait class, schema, program). Active sessions by schema and by program. Wait event detail table. Sessions by client address. Query sample volume over time. Longest-running queries table.
This dashboard requires `db.server.query_sample` events to be enabled. See *Query Event Configuration*.
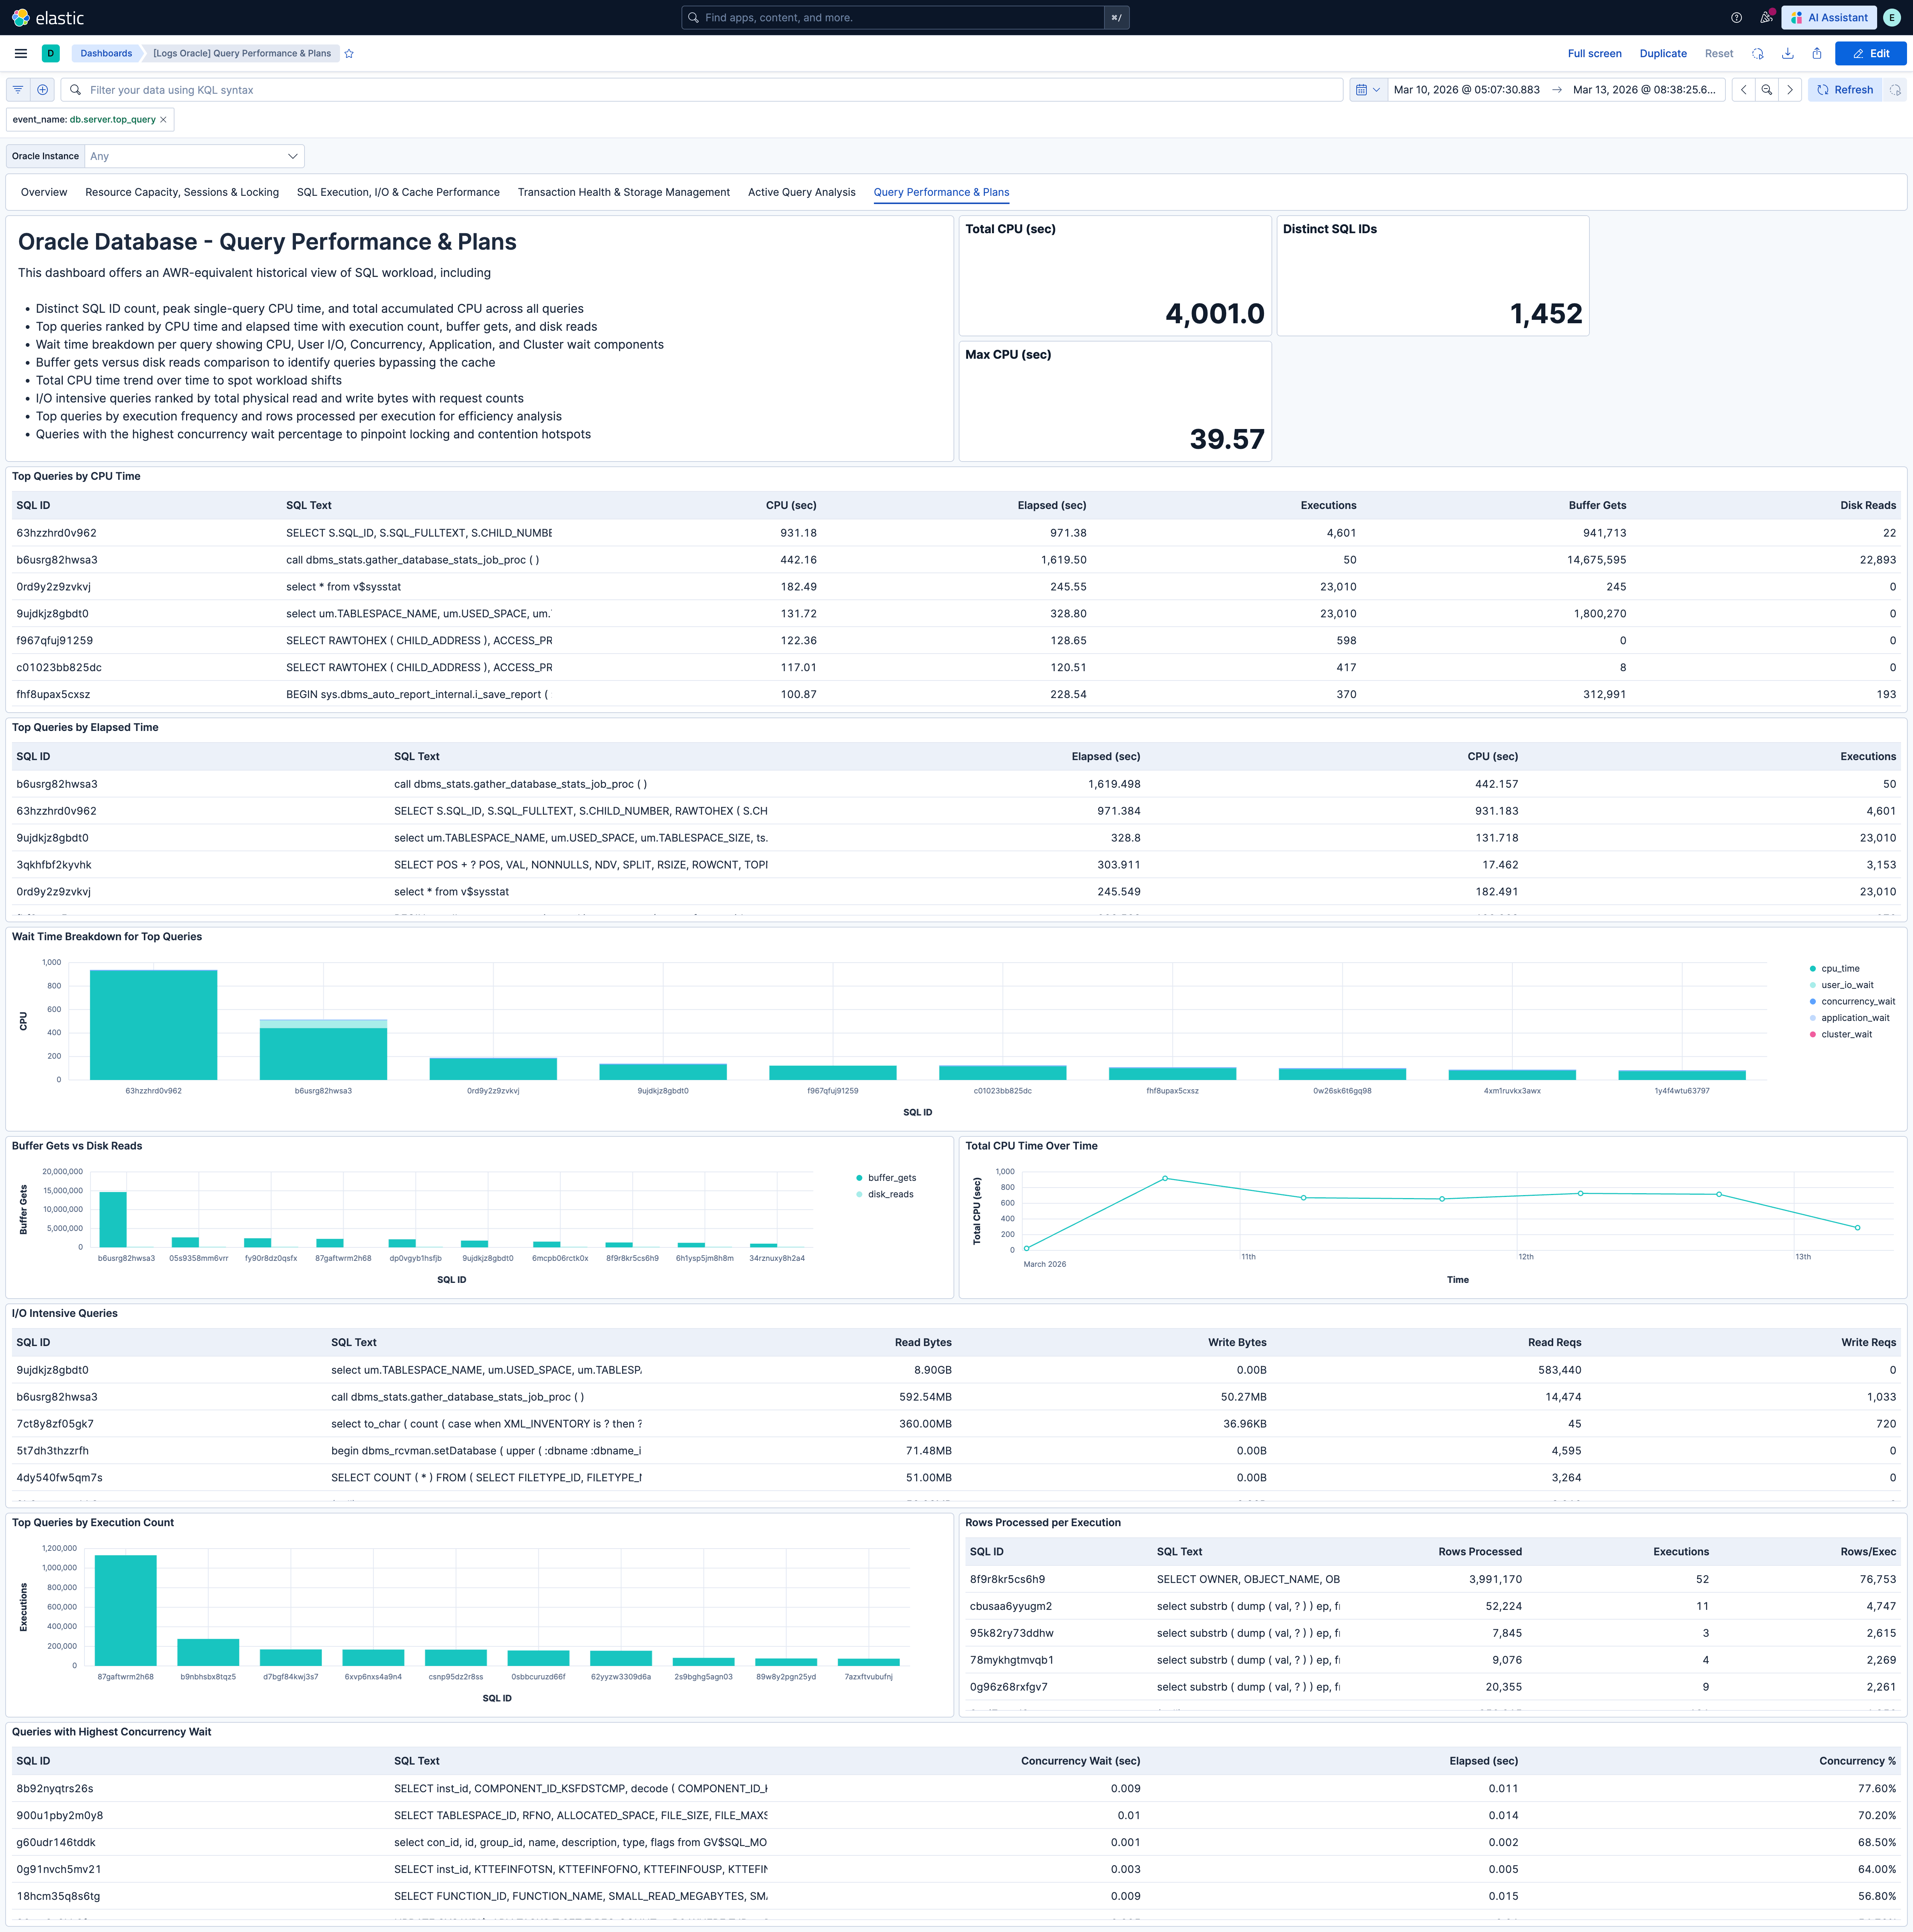
### 6. [Logs Oracle] Query Performance & Plans
**Purpose:** Historical top-N query analysis (AWR-equivalent). Answers: "What has been most expensive? Where is CPU time going? Which queries are doing excessive I/O? Are there lock contention hotspots at the query level?"
**Data source:** `logs-oracledbreceiver.otel-*` filtered by `event_name == "db.server.top_query"`
**Key panels:** Distinct SQL IDs, top query CPU time, total CPU time. Top queries by CPU time and by elapsed time. Wait time breakdown for top queries (CPU, user I/O, concurrency, application, cluster). Buffer gets vs disk reads. Total CPU time over time. I/O intensive queries. Top queries by execution count. Rows processed per execution. Queries with highest concurrency wait.
This dashboard requires `db.server.top_query` events to be enabled. See *Query Event Configuration*.
---
## Optional Metrics Configuration
Several dashboard panels display data from metrics that are disabled by default in the oracledbreceiver. To see data in these panels, you must explicitly enable the corresponding metrics in your OTel Collector configuration.
### Enabling Individual Metrics
To enable a single optional metric, add it under `receivers.oracledb.metrics` in your collector configuration:
```yaml
receivers:
oracledb:
datasource: "oracle://otel:password@localhost:1521/ORCLCDB"
metrics:
oracledb.physical_writes:
enabled: true
```
### Enabling All Optional Metrics
To get the full monitoring experience across all dashboards (including optional panels), enable all optional metrics:
```yaml
receivers:
oracledb:
datasource: "oracle://otel:password@localhost:1521/ORCLCDB"
metrics:
# I/O Detail
oracledb.physical_reads_direct:
enabled: true
oracledb.physical_writes:
enabled: true
oracledb.physical_writes_direct:
enabled: true
oracledb.physical_read_io_requests:
enabled: true
oracledb.physical_write_io_requests:
enabled: true
# Buffer Cache Detail
oracledb.consistent_gets:
enabled: true
oracledb.db_block_gets:
enabled: true
# Session & Authentication
oracledb.logons:
enabled: true
# Parallel Execution
oracledb.queries_parallelized:
enabled: true
oracledb.ddl_statements_parallelized:
enabled: true
oracledb.dml_statements_parallelized:
enabled: true
oracledb.parallel_operations_not_downgraded:
enabled: true
oracledb.parallel_operations_downgraded_to_serial:
enabled: true
oracledb.parallel_operations_downgraded_1_to_25_pct:
enabled: true
oracledb.parallel_operations_downgraded_25_to_50_pct:
enabled: true
oracledb.parallel_operations_downgraded_50_to_75_pct:
enabled: true
oracledb.parallel_operations_downgraded_75_to_99_pct:
enabled: true
```
### Optional Metric Reference
| Metric | Dashboard | Panel | What It Provides |
|-----------------------------------------------|-----------------------------------------|-----------------------------------------|-------------------------------------------------------------------------------------------|
| `oracledb.logons` | Resource Capacity, Sessions & Locking | Logon rate | Tracks authentication load — useful for detecting connection storms or leaked connections |
| `oracledb.physical_writes` | SQL Execution, I/O & Cache Performance | Physical write rate | Shows disk write throughput alongside read metrics for complete I/O picture |
| `oracledb.physical_reads_direct` | SQL Execution, I/O & Cache Performance | Direct path I/O | Physical reads bypassing the buffer cache (relevant for data warehouse workloads) |
| `oracledb.physical_writes_direct` | SQL Execution, I/O & Cache Performance | Direct path I/O | Physical writes bypassing the buffer cache |
| `oracledb.physical_read_io_requests` | SQL Execution, I/O & Cache Performance | Physical I/O request rates | I/O operation count (vs bytes) — helps identify many-small-I/O patterns |
| `oracledb.physical_write_io_requests` | SQL Execution, I/O & Cache Performance | Physical I/O request rates | Paired with read I/O requests for complete I/O operation picture |
| `oracledb.consistent_gets` | SQL Execution, I/O & Cache Performance | Buffer cache access breakdown | Read-consistent buffer cache accesses — reveals read/write mix |
| `oracledb.db_block_gets` | SQL Execution, I/O & Cache Performance | Buffer cache access breakdown | Current-mode buffer cache accesses (DML operations) |
| `oracledb.queries_parallelized` | Transaction Health & Storage Management | Parallel operations rate | Tracks parallel query utilisation |
| `oracledb.dml_statements_parallelized` | Transaction Health & Storage Management | Parallel operations rate | Tracks parallel DML utilisation |
| `oracledb.ddl_statements_parallelized` | Transaction Health & Storage Management | Parallel operations rate | Tracks parallel DDL utilisation |
| `oracledb.parallel_operations_not_downgraded` | Transaction Health & Storage Management | Parallel execution success vs downgrade | Shows operations running at full parallelism |
| `oracledb.parallel_operations_downgraded_*` | Transaction Health & Storage Management | Downgrade severity distribution | Shows operations running below requested parallelism — indicates resource contention |
---
## Query Event Configuration
The **[Logs Oracle] Active Query Analysis** and **[Logs Oracle] Query Performance & Plans** dashboards require per-query log events to be enabled. These events provide Oracle ASH and AWR-equivalent analysis through the oracledbreceiver.
**Active Query Sampling** (`db.server.query_sample`) — Captures currently executing queries with wait class, duration, SQL text, and session details. Powers **[Logs Oracle] Active Query Analysis** for real-time incident response.
**Top N Queries by CPU** (`db.server.top_query`) — Captures the most expensive queries with full execution plans and per-query wait-time breakdowns. Powers **[Logs Oracle] Query Performance & Plans** for query optimization and capacity planning.
### Enabling Query Events
```yaml
receivers:
oracledb:
datasource: "oracle://otel:password@localhost:1521/ORCLCDB"
events:
db.server.query_sample:
enabled: true
db.server.top_query:
enabled: true
query_sample_collection:
max_rows_per_query: 100
top_query_collection:
max_query_sample_count: 1000
top_query_count: 200
collection_interval: 60s
```
### Required Oracle Grants
The database user must have SELECT access to additional views beyond the base metrics grants:
```sql
GRANT SELECT ON V_$SQL TO ;
GRANT SELECT ON V_$SQLAREA TO ;
GRANT SELECT ON V_$SQL_PLAN TO ;
GRANT SELECT ON V_$SQL_PLAN_STATISTICS_ALL TO ;
GRANT SELECT ON V_$PROCESS TO ;
GRANT SELECT ON DBA_PROCEDURES TO ;
GRANT SELECT ON DBA_OBJECTS TO ;
```
> **Multitenant (CDB) deployments:** If you are using a common user (e.g. `C##OTEL`) in a Container Database, append `CONTAINER=ALL` to each grant so the privileges apply across all pluggable databases. For non-CDB deployments or local PDB users, omit the clause.
### Pipeline Configuration
The OTel Collector service must include a `logs` pipeline for query events:
```yaml
service:
pipelines:
metrics:
receivers: [oracledb]
exporters: [elasticsearch/otel]
logs:
receivers: [oracledb]
exporters: [elasticsearch/otel]
```
These event types are at `development` stability. Query events are emitted as OTel log records to `logs-oracledbreceiver.otel-*`, separate from the metrics data stream.
---
## Alert Rules
| Rule | Condition | Default Threshold |
|------------------------------------|--------------------------------------------------------------------|-------------------|
| Process utilisation high | Process usage / limit exceeds threshold | > 85% |
| Session utilisation high | Session usage / limit exceeds threshold | > 85% |
| Tablespace utilisation high | Any tablespace usage / limit exceeds threshold | > 90% |
| Enqueue deadlocks detected | Any increase in enqueue_deadlocks counter | Any increase |
| Buffer cache hit ratio low | `1 - (physical_reads / logical_reads)` below threshold | < 90% |
| Hard parse ratio high | hard_parses / parse_calls exceeds threshold | > 10% |
| Rollback-to-commit ratio high | user_rollbacks / (user_commits + user_rollbacks) exceeds threshold | > 10% |
| DML lock utilisation high | DML lock usage / limit exceeds threshold | > 85% |
| Enqueue lock utilisation high | Enqueue lock usage / limit exceeds threshold | > 85% |
| Transaction limit utilisation high | Transaction usage / limit exceeds threshold | > 85% |
All alert rules use default metrics only; none depend on optional metrics.
---
## SLO Templates
SLO templates require Elastic Stack version 9.4.0 or later.
| SLO Template | Objective | Time Window | What It Tracks |
|------------------------------------------------|-----------------------------------------------------------------|-----------------|----------------------------------------------------|
| Process utilisation 99.5% rolling 30 days | 99.5% of 1-minute intervals maintain utilisation below 85% | Rolling 30 days | Process usage vs limit — headroom before ORA-00020 |
| Session utilisation 99.5% rolling 30 days | 99.5% of 1-minute intervals maintain utilisation below 85% | Rolling 30 days | Max session usage vs limit |
| Buffer cache hit ratio 99.5% rolling 30 days | 99.5% of 1-minute intervals maintain hit ratio above 95% | Rolling 30 days | `1 - (physical_reads / logical_reads)` |
| Hard parse ratio 99.5% rolling 30 days | 99.5% of 1-minute intervals maintain hard parse ratio below 10% | Rolling 30 days | hard_parses / parse_calls |
| Rollback-to-commit ratio 99.5% rolling 30 days | 99.5% of 1-minute intervals maintain rollback ratio below 10% | Rolling 30 days | user_rollbacks / (user_commits + user_rollbacks) |
| Zero enqueue deadlocks 99.5% rolling 30 days | 99.5% of 1-minute intervals experience zero new deadlocks | Rolling 30 days | Enqueue deadlock counter stability |
All SLOs use default metrics only.
---
## Troubleshooting
### Panel shows no data (metrics dashboards)
If a panel is empty, the required metric may not be enabled. Many panels use default metrics, but some (e.g. logon rate, physical write rate, parallel execution panels) rely on optional metrics. Refer to [Optional Metrics Configuration](#optional-metrics-configuration) and enable the metrics used by that panel.
### [Logs Oracle] Active Query Analysis or [Logs Oracle] Query Performance & Plans shows no data
Query events are not enabled in the receiver configuration, or the Oracle user is missing the required grants for `V_$SQL`, `DBA_PROCEDURES`, etc. Ensure you have:
1. Enabled `db.server.query_sample` and/or `db.server.top_query` in `receivers.oracledb.events`
2. Granted SELECT on `V_$SQL`, `V_$SQLAREA`, `V_$SQL_PLAN`, `V_$SQL_PLAN_STATISTICS_ALL`, `V_$PROCESS`, `DBA_PROCEDURES`, and `DBA_OBJECTS` to the collection user
3. Added a `logs` pipeline to the OTel Collector service with the `oracledb` receiver and Elasticsearch exporter
See [Query Event Configuration](#query-event-configuration).
### [Logs Oracle] Active Query Analysis or [Logs Oracle] Query Performance & Plans shows no data but events are enabled
Check that the OTel Collector service includes a `logs` pipeline with the `oracledb` receiver and the `elasticsearch/otel` exporter. Ensure `logs_dynamic_index` is enabled on the exporter if required. Verify the collector can connect to the database and that the Oracle user has the required grants.
### Metrics appear but values are always zero
The Oracle instance may not be exercising that code path. For example, parallel execution metrics remain zero if no parallel queries are running. Optional I/O metrics (`physical_writes`, `physical_reads_direct`, etc.) reflect actual disk activity.
### Utilisation percentages exceed 100%
Oracle can temporarily exceed soft limits under certain conditions. Values above 100% are expected in some edge cases.
## Screenshots
This integration includes one or more Kibana dashboards that visualizes the data collected by the integration. The screenshots below illustrate how the ingested data is displayed.
## Changelog
| Version | Details | Minimum Kibana version |
|-----------|-------------------------------------------------------------------------------------------------------------------------------------------|------------------------|
| **0.1.0** | **Enhancement** ([View pull request](https://github.com/elastic/integrations/pull/17874))Initial draft of the Oracle OTel content package | 9.3.0 |