---
title: RabbitMQ OpenTelemetry Assets
description: RabbitMQ is an open-source message broker implementing the Advanced Message Queuing Protocol (AMQP), acting as an intermediary for asynchronous messaging...
url: https://docs-v3-preview.elastic.dev/elastic/integration-docs/tree/main/reference/rabbitmq_otel
products:
- Elastic integrations
applies_to:
- Serverless Observability projects: Generally available
- Serverless Security projects: Generally available
- Elastic Stack: Generally available since 9.3
---
# RabbitMQ OpenTelemetry Assets
| | |
|-------------------------------------------------------------------------------------------------------------------------------|----------------------------------------------------------------|
| **Version** | 0.1.0 : Beta ([View all](#changelog)) |
| **Subscription level**[What's this?](https://www.elastic.co/subscriptions) | Basic |
| **Developed by**[What's this?](https://docs-v3-preview.elastic.dev/elastic/integration-docs/tree/main/reference/developed-by) | Elastic |
| **Minimum Kibana version(s)** | 9.3.0 |
To use beta integrations, go to the **Integrations** page in Kibana, scroll down, and toggle on the _Display beta integrations_ option.
RabbitMQ is an open-source message broker implementing the Advanced Message Queuing Protocol (AMQP), acting as an intermediary for asynchronous messaging between applications. The RabbitMQ OpenTelemetry assets provide dashboards, alert rules, and SLO templates that visualize and monitor RabbitMQ metrics collected using the OpenTelemetry RabbitMQ receiver, covering queue health, message throughput, consumer availability, and node resource utilization.
## Compatibility
The RabbitMQ OpenTelemetry assets have been tested with [OpenTelemetry RabbitMQ receiver v0.146.0](https://github.com/open-telemetry/opentelemetry-collector-contrib/blob/v0.146.0/receiver/rabbitmqreceiver/README.md). The node-level metrics used by the dashboards and alerts require collector-contrib v0.131.0 or later.
RabbitMQ tested against:
- RabbitMQ 3.8, 3.9, 3.10, 3.11, 3.12
## Requirements
You need Elasticsearch for storing and searching your data and Kibana for visualizing and managing it.
You can use our hosted Elasticsearch Service on Elastic Cloud, which is recommended, or self-manage the Elastic Stack on your own hardware.
## Setup
### Prerequisites
Enable the RabbitMQ Management plugin so the collector can access the Management API:
```bash
rabbitmq-plugins enable rabbitmq_management
```
The Management API listens on port 15672 by default. Create a dedicated monitoring user with appropriate permissions rather than using the default `guest` account in production. A user with monitoring-level permissions is sufficient.
### Configuration
Install and configure the upstream OpenTelemetry Collector or Elastic Distribution of OpenTelemetry (EDOT) Collector to export metrics to Elasticsearch. Replace the following placeholders in the configuration:
- ``: Elasticsearch API key for authentication
- ``: Elasticsearch endpoint (for example, `https://elasticsearch.example.com:9200`)
- ``: RabbitMQ Management API endpoint (for example, `http://localhost:15672` or `http://rabbitmq.example.com:15672`)
- ``: Username for the RabbitMQ Management API
- ``: Password for the RabbitMQ Management API. For secrets, use `${env:RABBITMQ_PASSWORD}` in the YAML and set the variable in your environment.
```yaml
receivers:
rabbitmq:
endpoint:
username:
password:
collection_interval: 10s
metrics:
# Queue-level metrics — required for dashboards, alerts, and SLOs
rabbitmq.message.current:
enabled: true
rabbitmq.message.published:
enabled: true
rabbitmq.message.acknowledged:
enabled: true
rabbitmq.message.delivered:
enabled: true
rabbitmq.message.dropped:
enabled: true
rabbitmq.consumer.count:
enabled: true
# Node-level metrics disabled by default — required for dashboards and alerts
rabbitmq.node.mem_used:
enabled: true
rabbitmq.node.mem_limit:
enabled: true
rabbitmq.node.mem_alarm:
enabled: true
rabbitmq.node.disk_free:
enabled: true
rabbitmq.node.disk_free_limit:
enabled: true
rabbitmq.node.disk_free_alarm:
enabled: true
rabbitmq.node.fd_used:
enabled: true
rabbitmq.node.fd_total:
enabled: true
rabbitmq.node.sockets_used:
enabled: true
rabbitmq.node.sockets_total:
enabled: true
rabbitmq.node.proc_used:
enabled: true
rabbitmq.node.proc_total:
enabled: true
exporters:
elasticsearch/otel:
apm_server_url:
apm_api_key:
sending_queue:
enabled: true
mapping:
mode: otel
service:
pipelines:
metrics:
receivers: [rabbitmq]
exporters: [elasticsearch/otel]
```
The dashboards, alert rules, and SLO templates require queue-level metrics (`rabbitmq.message.current`, `rabbitmq.message.published`, `rabbitmq.message.acknowledged`, `rabbitmq.message.delivered`, `rabbitmq.message.dropped`, `rabbitmq.consumer.count`) to be enabled. The Overview and Nodes dashboards and the memory/disk alarm alert rules additionally require node-level metrics (e.g. `rabbitmq.node.mem_alarm`, `rabbitmq.node.disk_free_alarm`). If your receiver version has these disabled by default, enable them in the receiver configuration per the upstream documentation.
If your RabbitMQ cluster has multiple nodes, configure the receiver endpoint to reach the Management API for each node you want to monitor, or use a load balancer that aggregates node data.
## Reference
### Metrics
Refer to the [metadata.yaml](https://github.com/open-telemetry/opentelemetry-collector-contrib/blob/main/receiver/rabbitmqreceiver/metadata.yaml) of the OpenTelemetry RabbitMQ receiver for details on available metrics.
## Dashboards
| Dashboard | Description |
|------------------------------|------------------------------------------------------------------------------------------------------------------------------------------------------------|
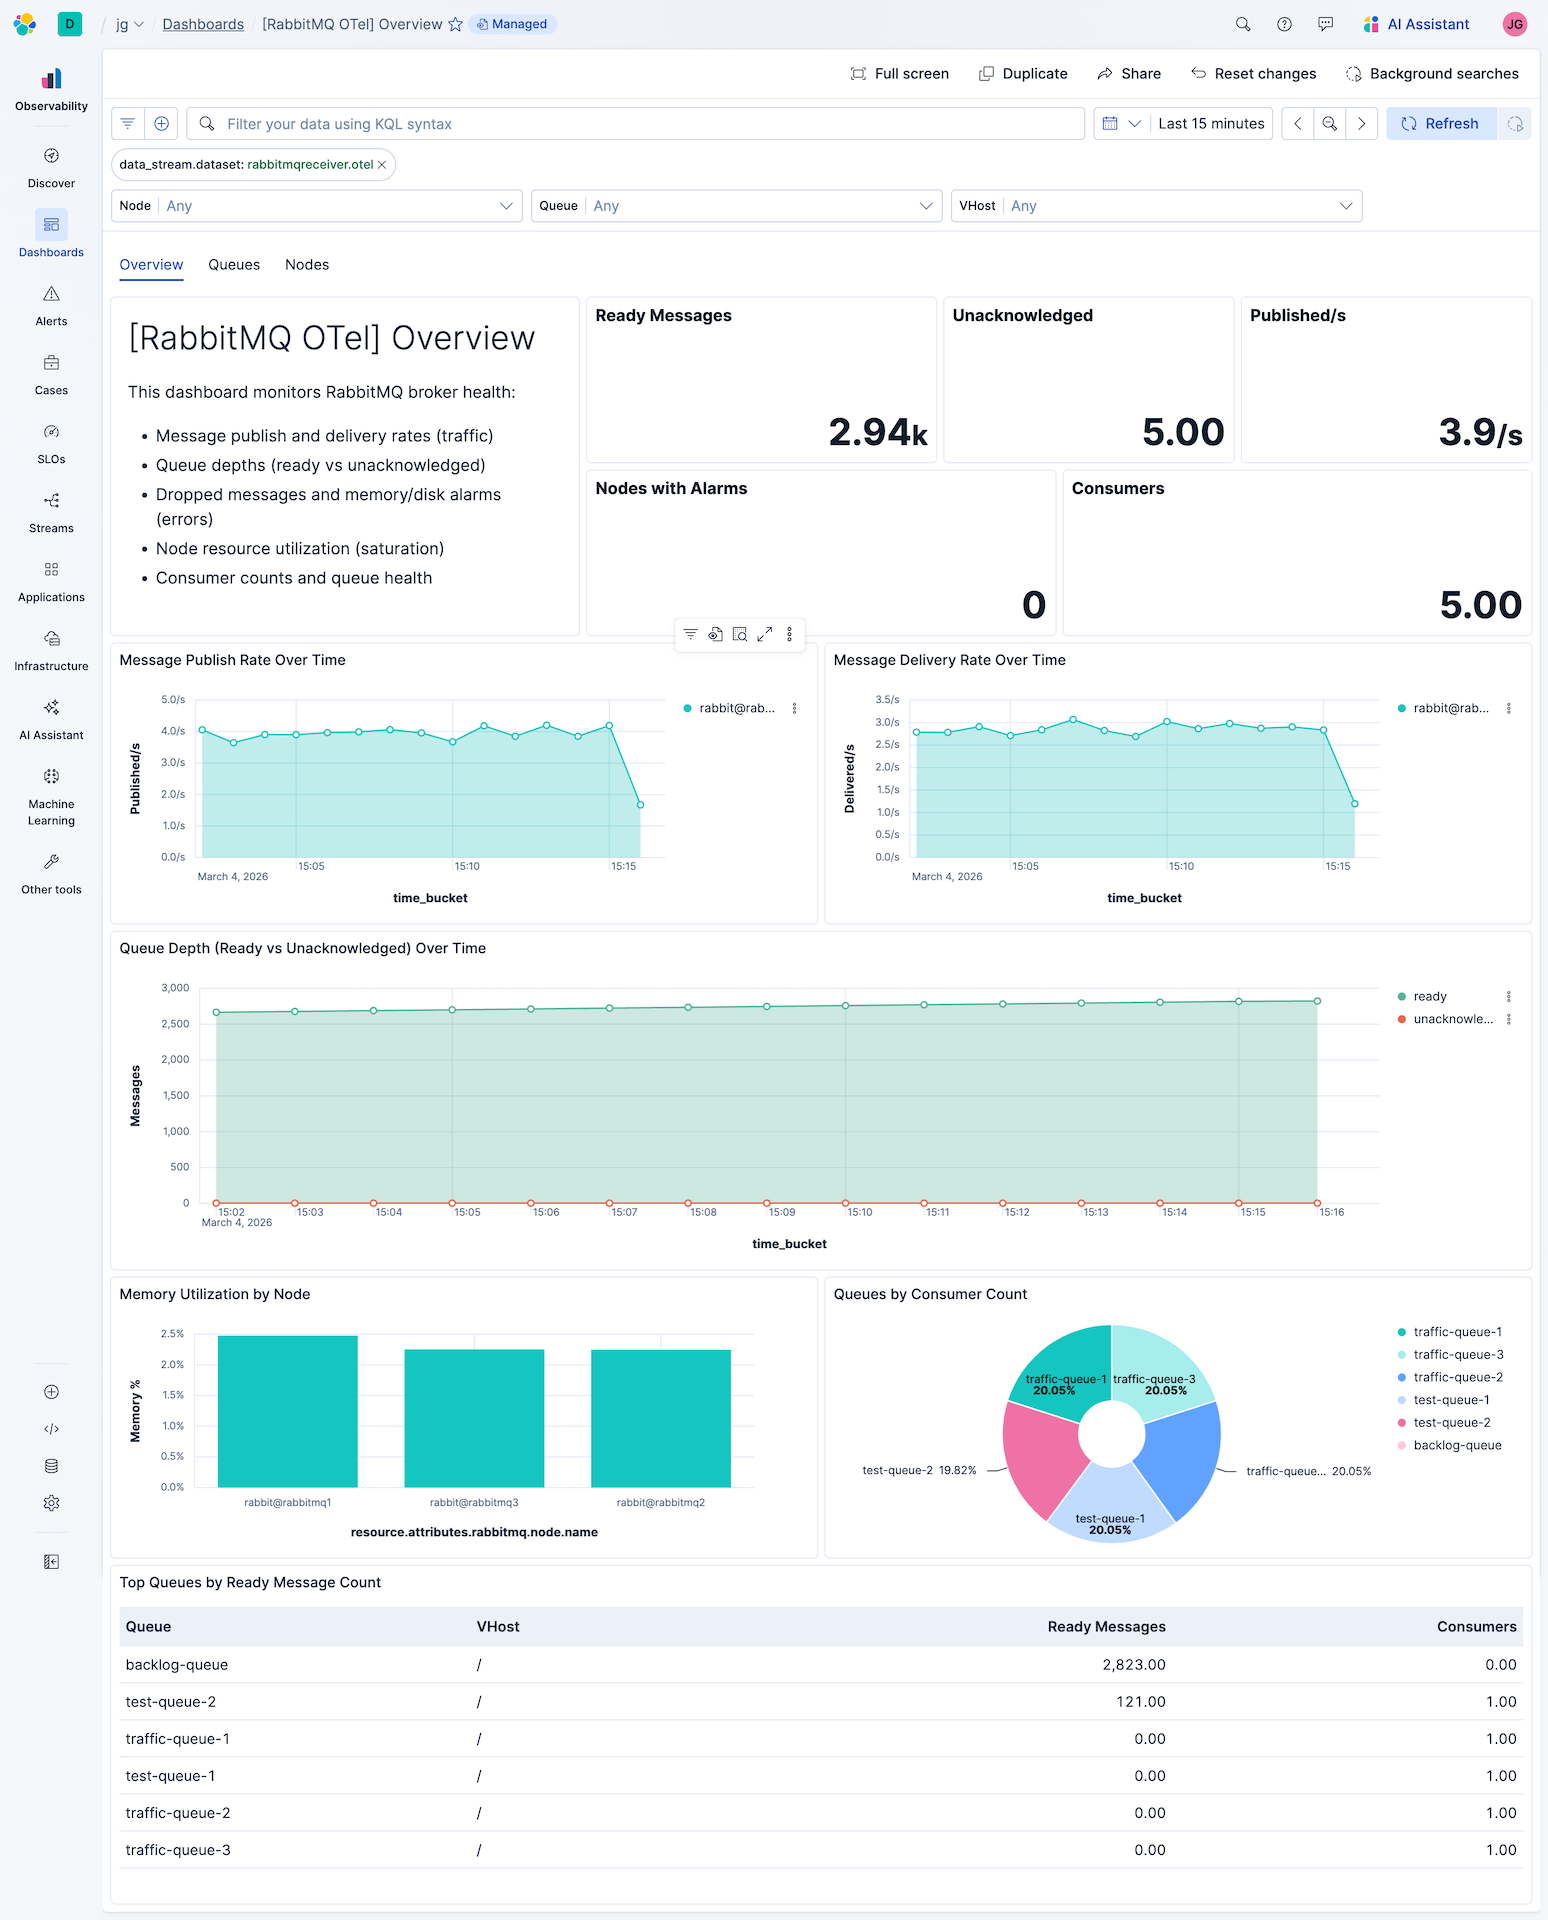
| **[RabbitMQ OTel] Overview** | Overview of broker health: message traffic, queue depths, dropped messages, alarms, and resource utilization across nodes and queues. |
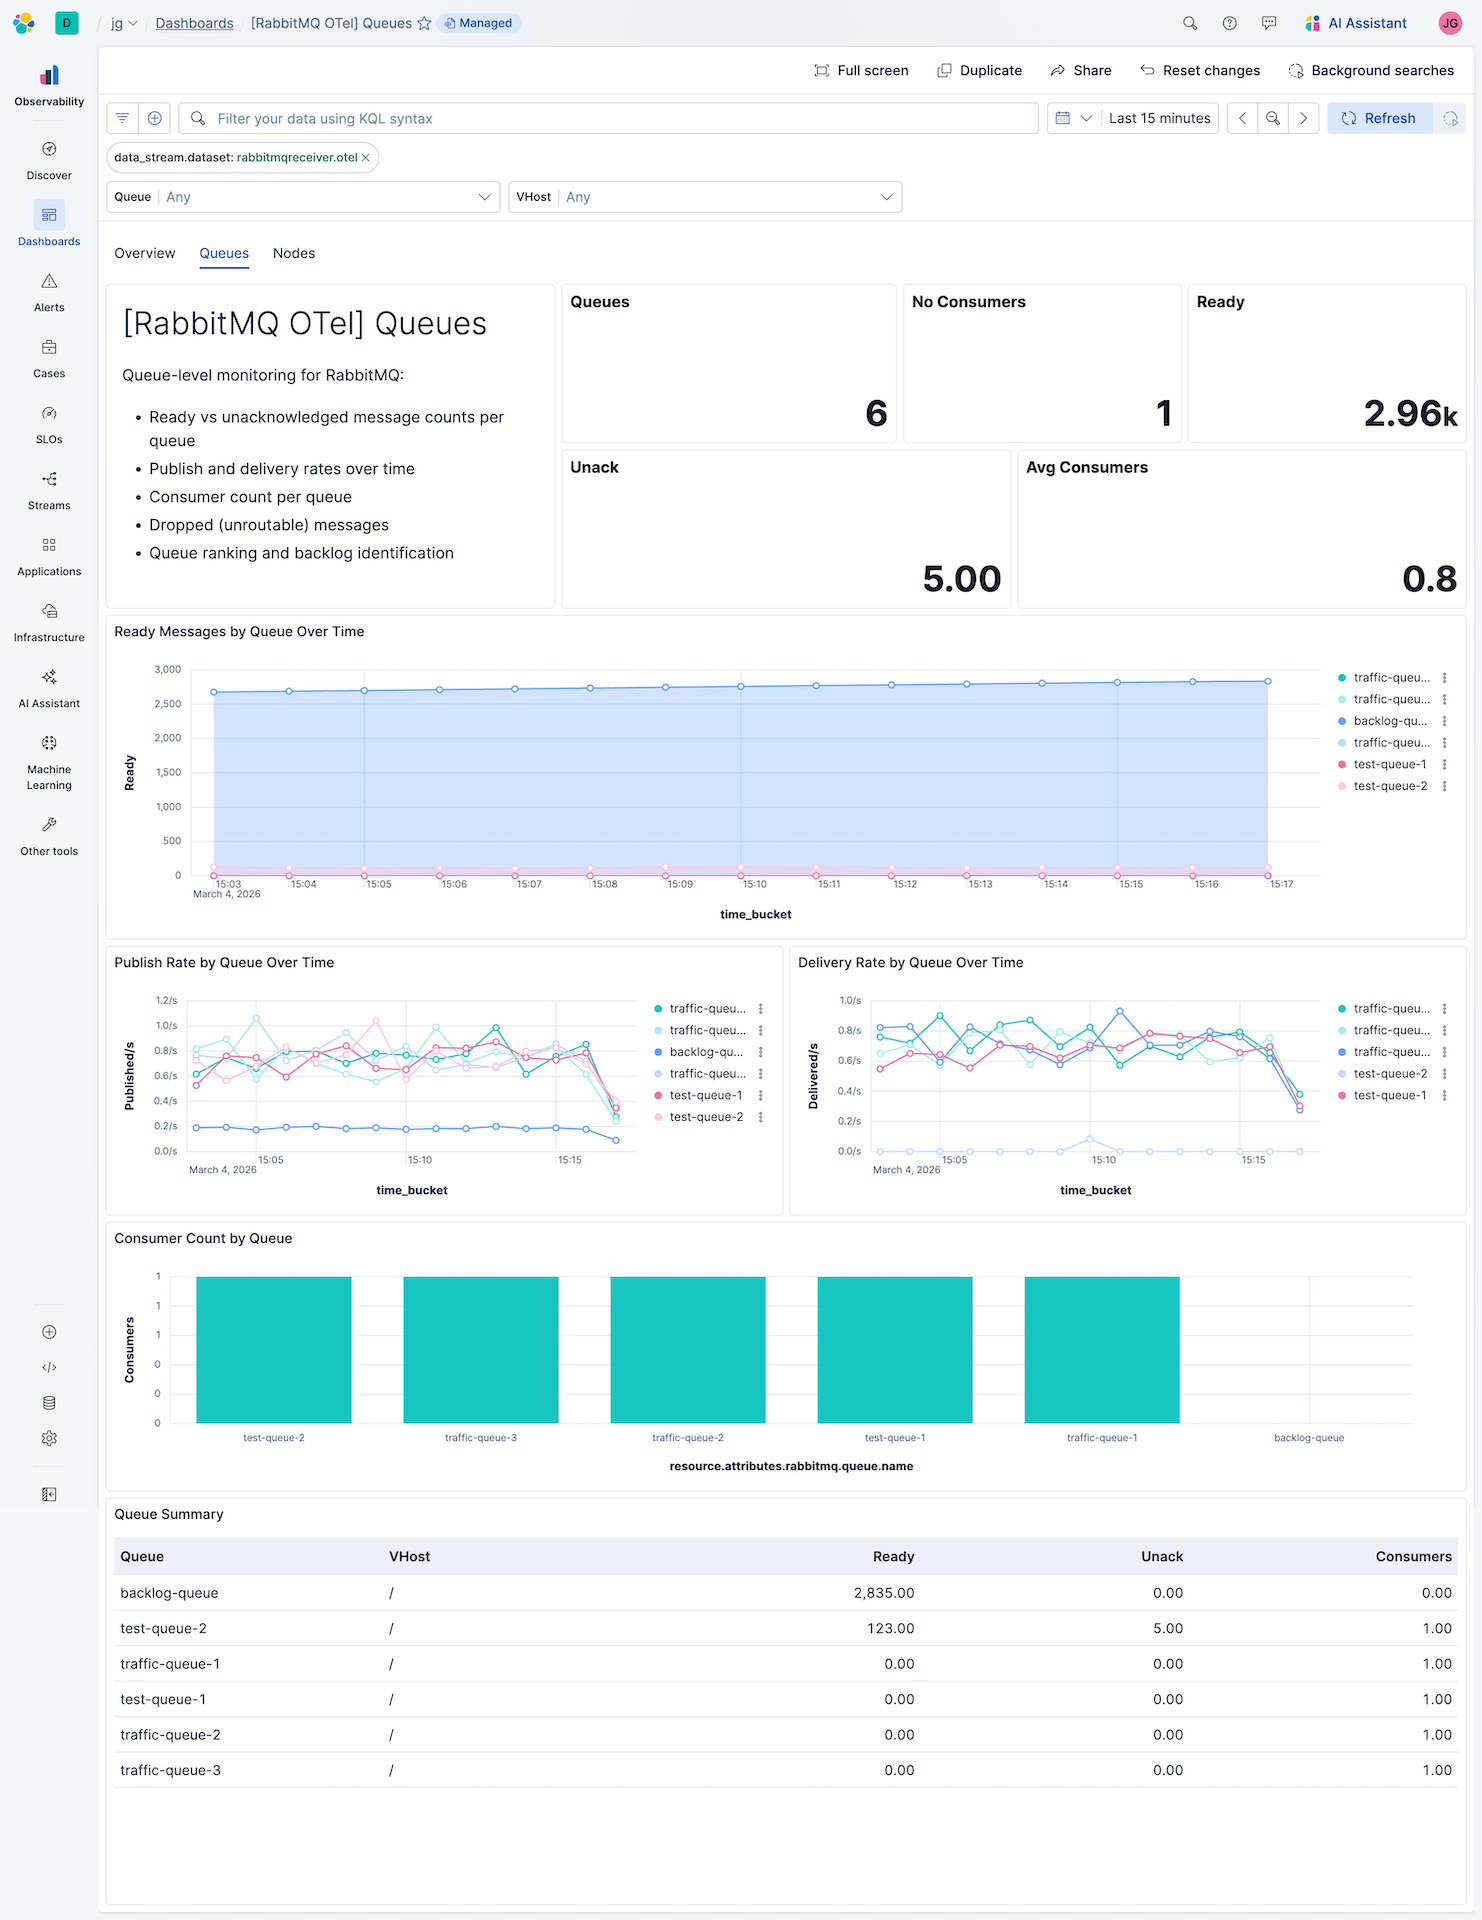
| **[RabbitMQ OTel] Queues** | Queue-level view: message depths (ready/unack), consumer counts, publish and delivery rates, and dropped messages per queue. |
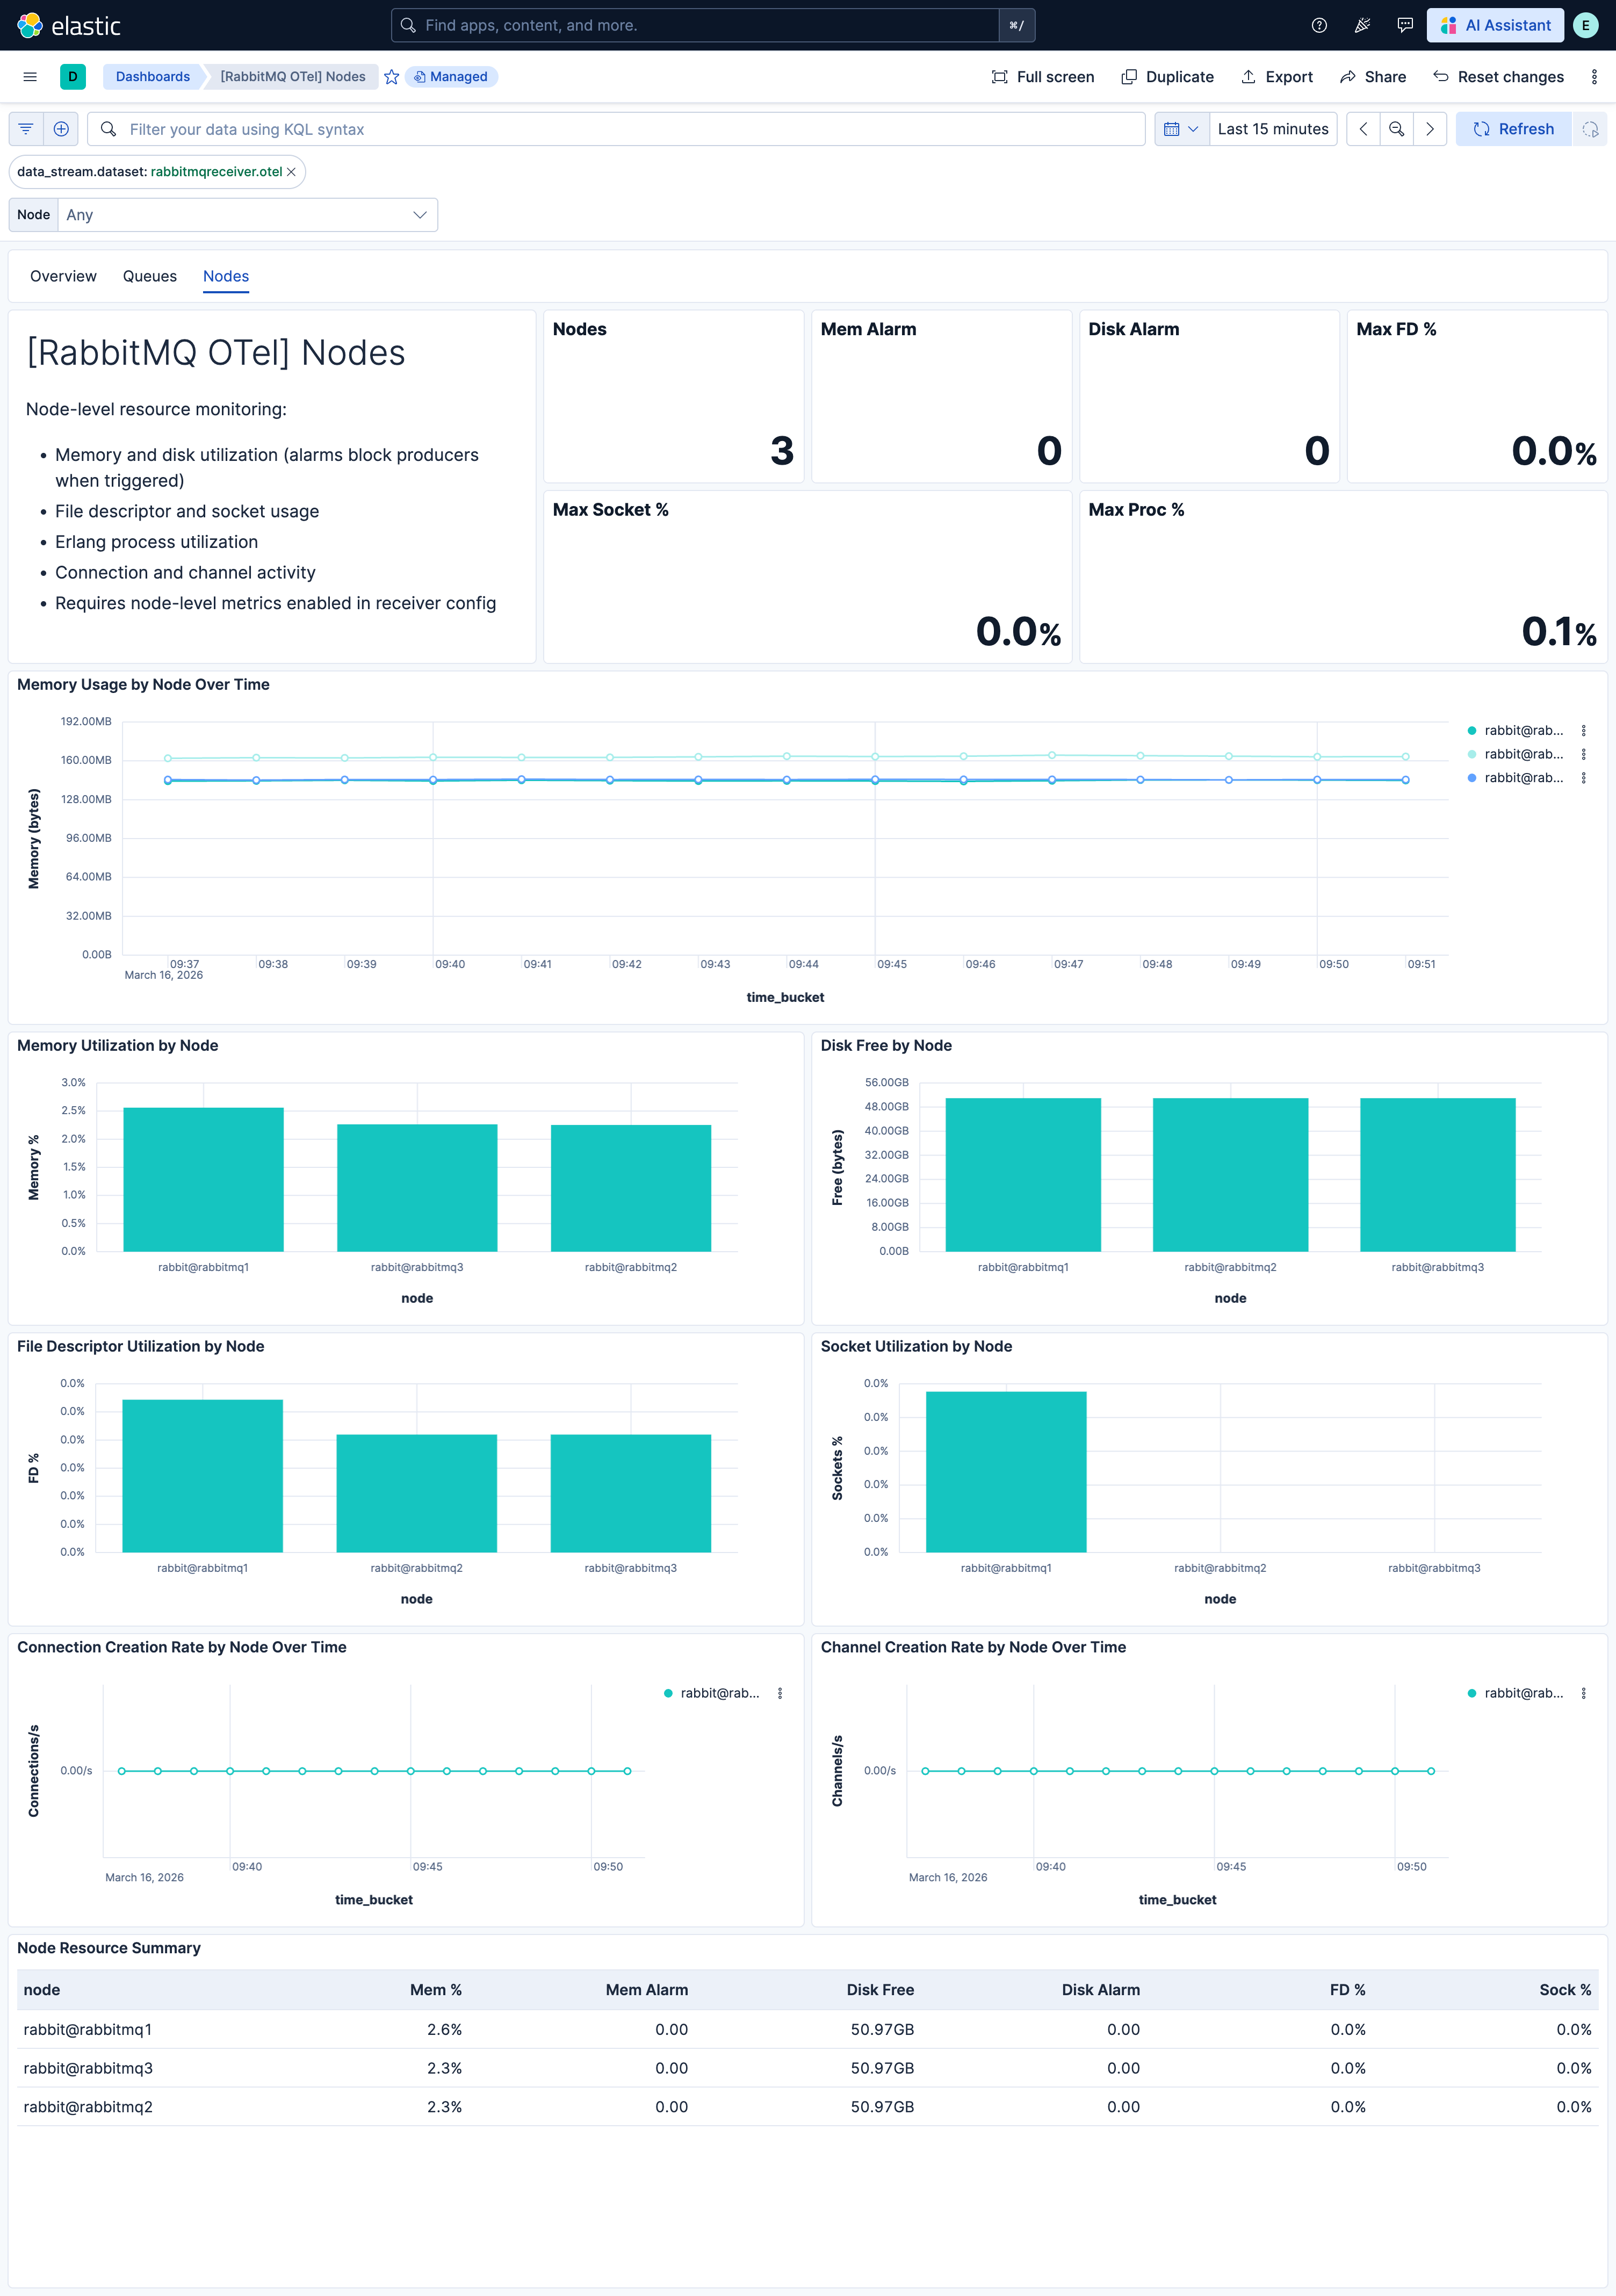
| **[RabbitMQ OTel] Nodes** | Node-level resource monitoring: memory, disk, file descriptors, sockets, Erlang processes, connections, and channels. Requires node-level metrics enabled. |
## Alert rules
| Alert | Trigger | Severity |
|------------------------------------------------------------------|-----------------------------------------------------------|----------|
| **[RabbitMQ OTel] Memory alarm triggered** | Node reports memory alarm (producers blocked). | Critical |
| **[RabbitMQ OTel] Disk alarm triggered** | Node reports disk alarm (publishing halted). | Critical |
| **[RabbitMQ OTel] Queue with zero consumers and ready messages** | Queue has messages waiting but no consumers connected. | High |
| **[RabbitMQ OTel] High unacknowledged message count** | Unacknowledged message count exceeds threshold per queue. | High |
| **[RabbitMQ OTel] High ready queue depth** | Ready message count exceeds threshold per queue. | Medium |
## SLO templates
SLO templates require Elastic Stack version 9.4.0 or later.
| SLO | Target | Window | Description |
|-----------------------------------------------------------------------|--------|----------------|-----------------------------------------------------------------------------------------|
| **[RabbitMQ OTel] Message acknowledgment rate 99.5% rolling 30 days** | 99.5% | 30-day rolling | Proportion of delivered messages acknowledged by consumers within each 5-minute window. |
| **[RabbitMQ OTel] Consumer availability 99.5% rolling 30 days** | 99.5% | 30-day rolling | Proportion of queue observations where at least one consumer is connected. |
## Screenshots
This integration includes one or more Kibana dashboards that visualizes the data collected by the integration. The screenshots below illustrate how the ingested data is displayed.
## Changelog
| Version | Details | Minimum Kibana version |
|-----------|------------------------------------------------------------------------------------------------------------------------------------------------------|------------------------|
| **0.1.0** | **Enhancement** ([View pull request](https://github.com/elastic/integrations/pull/17661))First release of the RabbitMQ OpenTelemetry content package | 9.3.0 |