---
title: Redis OpenTelemetry Assets
description: Redis is an open-source, in-memory data structure store used as a database, cache, message broker, and streaming engine. It delivers sub-millisecond latency...
url: https://docs-v3-preview.elastic.dev/elastic/integration-docs/tree/main/reference/redis_otel
products:
- Elastic integrations
applies_to:
- Serverless Observability projects: Generally available
- Serverless Security projects: Generally available
- Elastic Stack: Generally available since 9.3
---
# Redis OpenTelemetry Assets
| | |
|-------------------------------------------------------------------------------------------------------------------------------|----------------------------------------------------------------|
| **Version** | 0.1.0 : Beta ([View all](#changelog)) |
| **Subscription level**[What's this?](https://www.elastic.co/subscriptions) | Basic |
| **Developed by**[What's this?](https://docs-v3-preview.elastic.dev/elastic/integration-docs/tree/main/reference/developed-by) | Elastic |
| **Minimum Kibana version(s)** | 9.3.0 |
To use beta integrations, go to the **Integrations** page in Kibana, scroll down, and toggle on the _Display beta integrations_ option.
Redis is an open-source, in-memory data structure store used as a database, cache, message broker, and streaming engine. It delivers sub-millisecond latency for most operations and supports a rich set of data structures.
This content pack provides dashboards, alert rules, and SLO templates for Redis instances monitored using the OpenTelemetry Redis receiver. The assets cover memory usage, connection management, keyspace health, replication status, persistence metrics, and command latency.
## Compatibility
The Redis OpenTelemetry assets have been tested with OpenTelemetry Redis receiver v0.145.0.
Redis tested against:
- Redis 6.x, 7.x
## Requirements
You need Elasticsearch for storing and searching your data and Kibana for visualizing and managing it. You can use our hosted Elasticsearch Service on Elastic Cloud, which is recommended, or self-manage the Elastic Stack on your own hardware.
## Setup
### Prerequisites
The Redis receiver connects to Redis using the `INFO`, `SLOWLOG`, and `CLIENT LIST` commands. Ensure the collector can reach the Redis instance over the network. If Redis is protected by a password, configure it in the receiver (see placeholder table below). No additional Redis-side configuration is required for basic metrics collection.
### Configuration
Add the Redis receiver to your OpenTelemetry Collector or Elastic Distribution of OpenTelemetry (EDOT) Collector configuration. Wire it to the `elasticsearch/otel` exporter with `mapping.mode: otel` so metrics are stored in the correct format for the dashboards, alerts, and SLOs.
| Placeholder | Description | Example |
|--------------------|------------------------------------------|------------------------------------------------------------------|
| `` | Redis server address and port | `localhost:6379` |
| `` | Elasticsearch ingest endpoint URL | `https://my-deployment.es.us-central1.gcp.cloud.es.io:443` |
| `` | Elasticsearch API key for authentication | Use `${env:ES_API_KEY}` and set the variable in your environment |
```yaml
receivers:
redis:
endpoint:
collection_interval: 10s
# password: ${env:REDIS_PASSWORD}
metrics:
redis.cmd.latency:
enabled: true
redis.maxmemory:
enabled: true
exporters:
elasticsearch/otel:
endpoints: []
api_key:
mapping:
mode: otel
service:
pipelines:
metrics:
receivers: [redis]
exporters: [elasticsearch/otel]
```
If you do not use the P99 command latency SLO or the Memory approaching maxmemory alert, you can omit the `metrics` block and rely on the default metric set.
## Reference
### Metrics
Refer to the [metadata.yaml](https://github.com/open-telemetry/opentelemetry-collector-contrib/blob/main/receiver/redisreceiver/metadata.yaml) of the OpenTelemetry Redis receiver for details on available metrics.
## Dashboards
| Dashboard | Description |
|---------------------------------------|-------------------------------------------------------------------------------------------------------------------------------------------------------------------------|
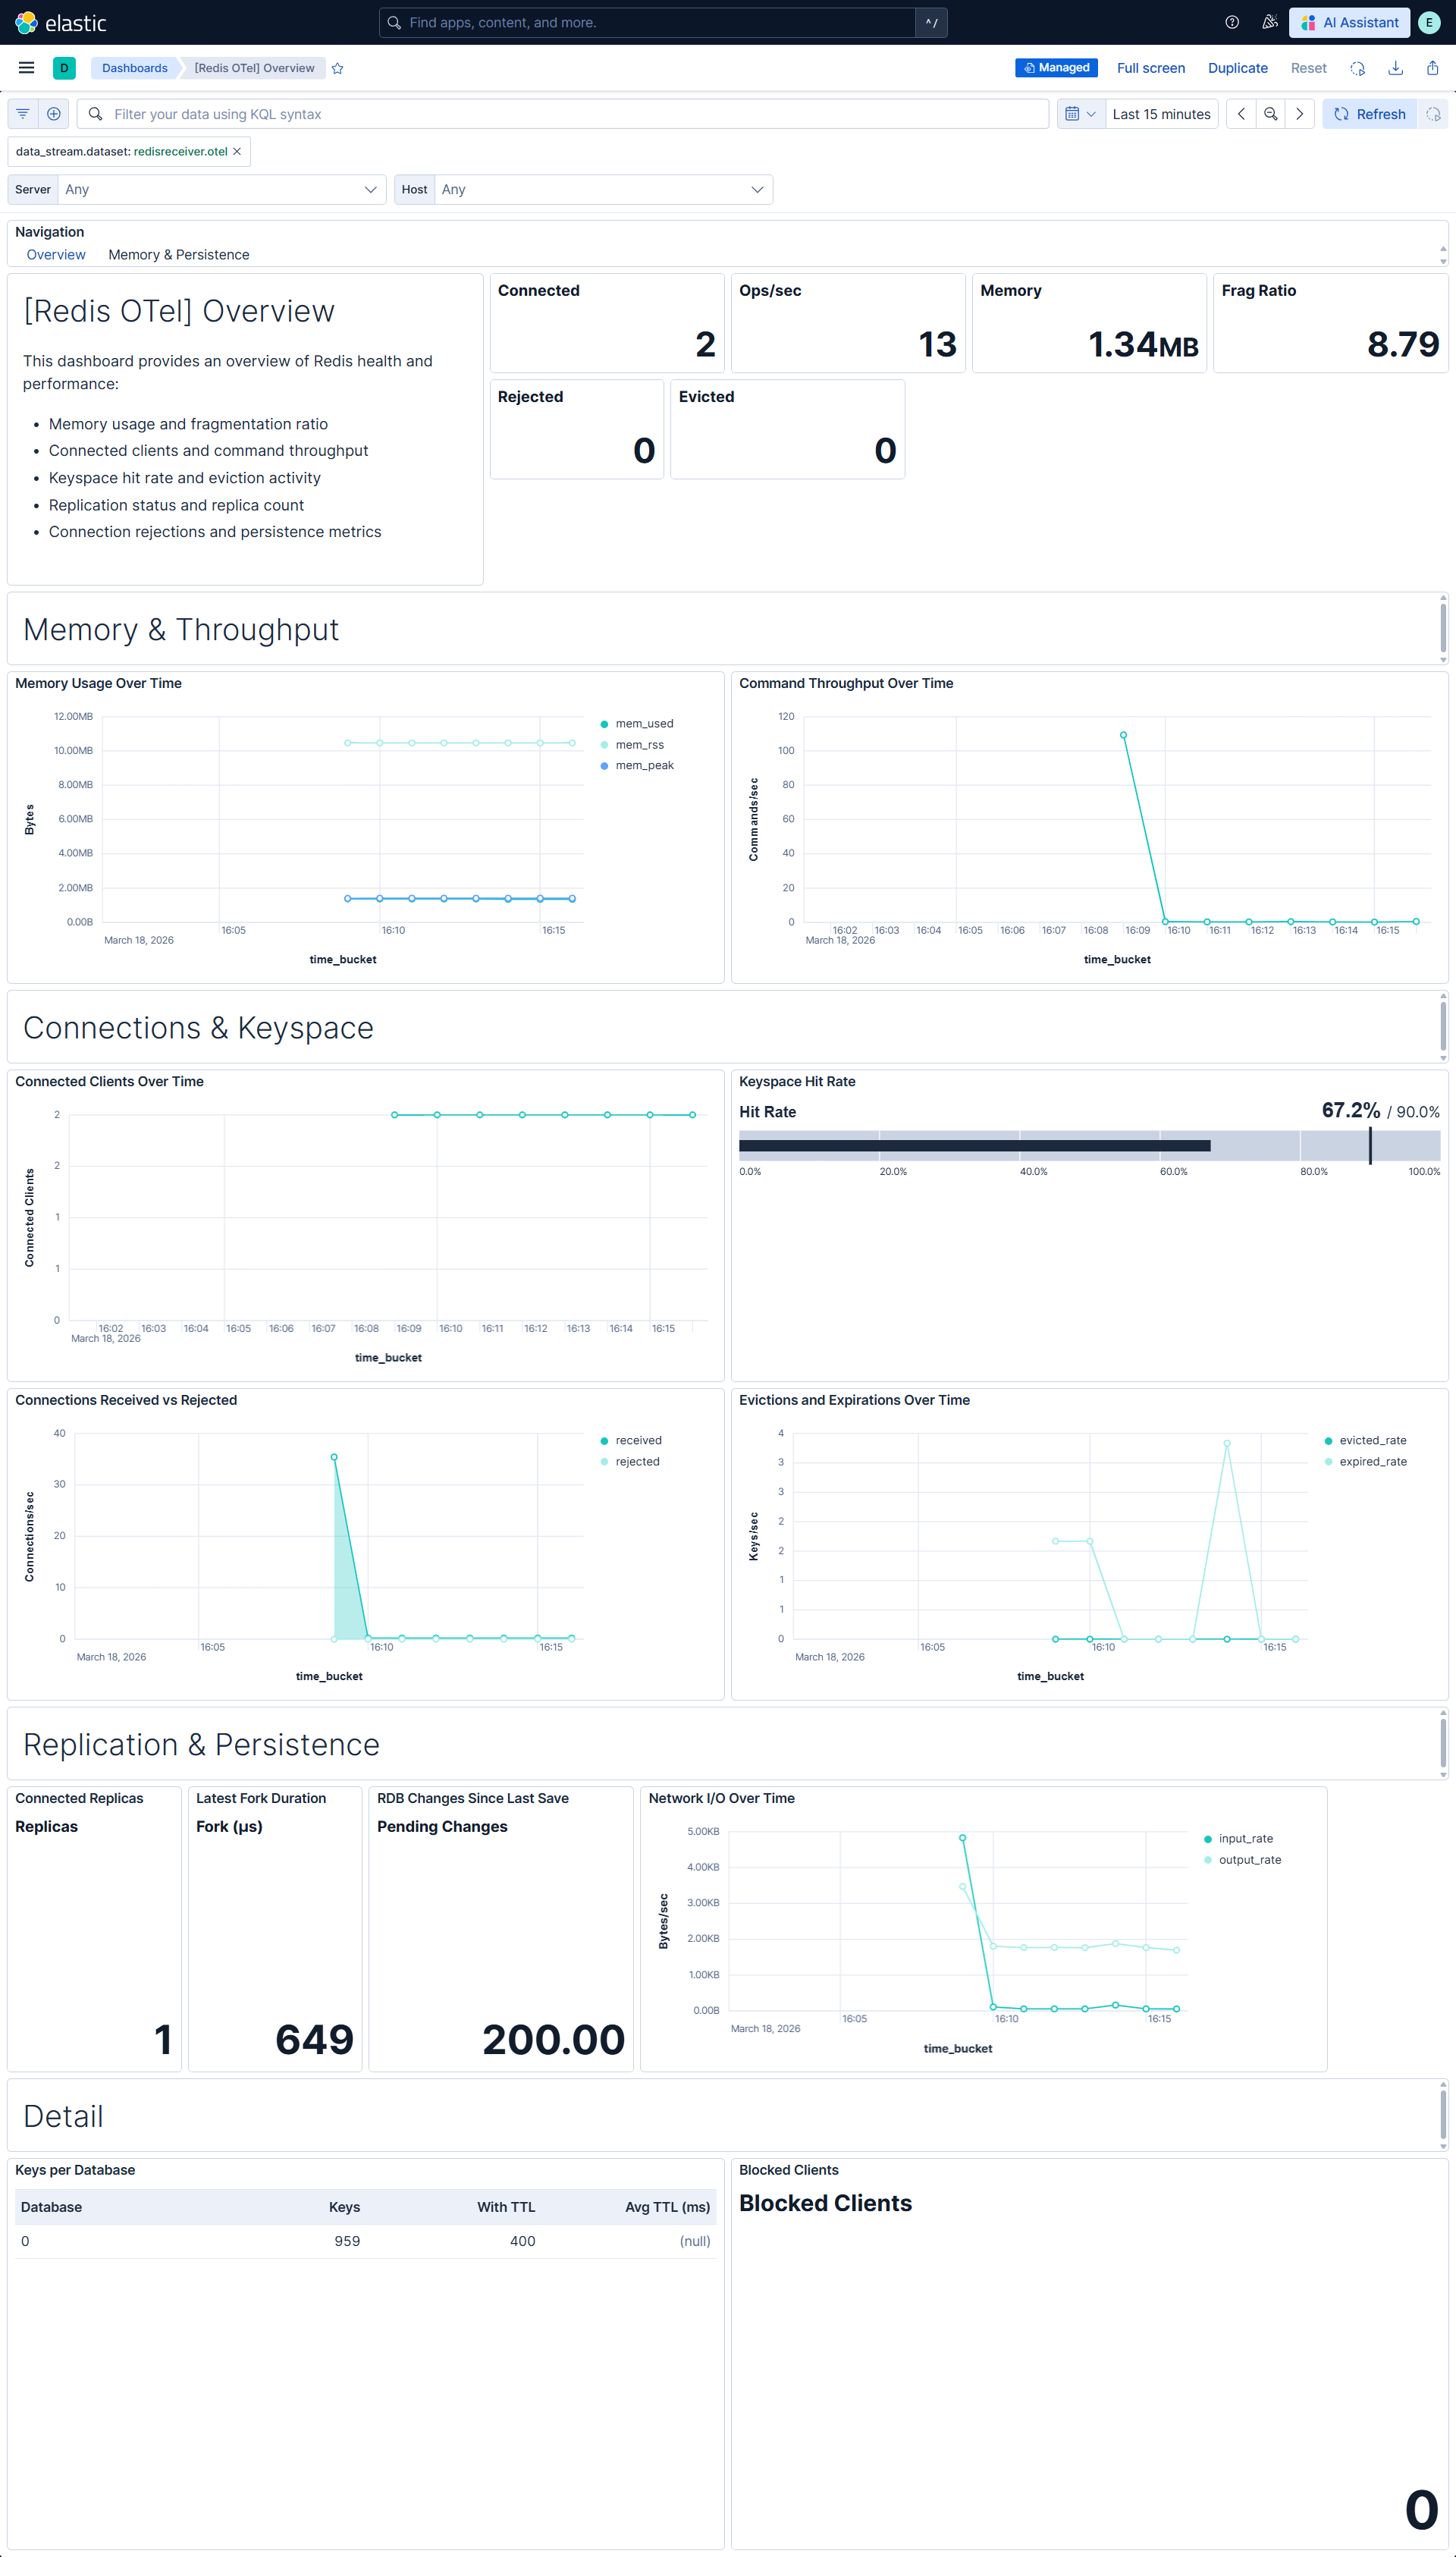
| **[Redis OTel] Overview** | Overview of Redis instance health and performance: memory usage, connection counts, command throughput, keyspace hit rate, replication status, and persistence metrics. |
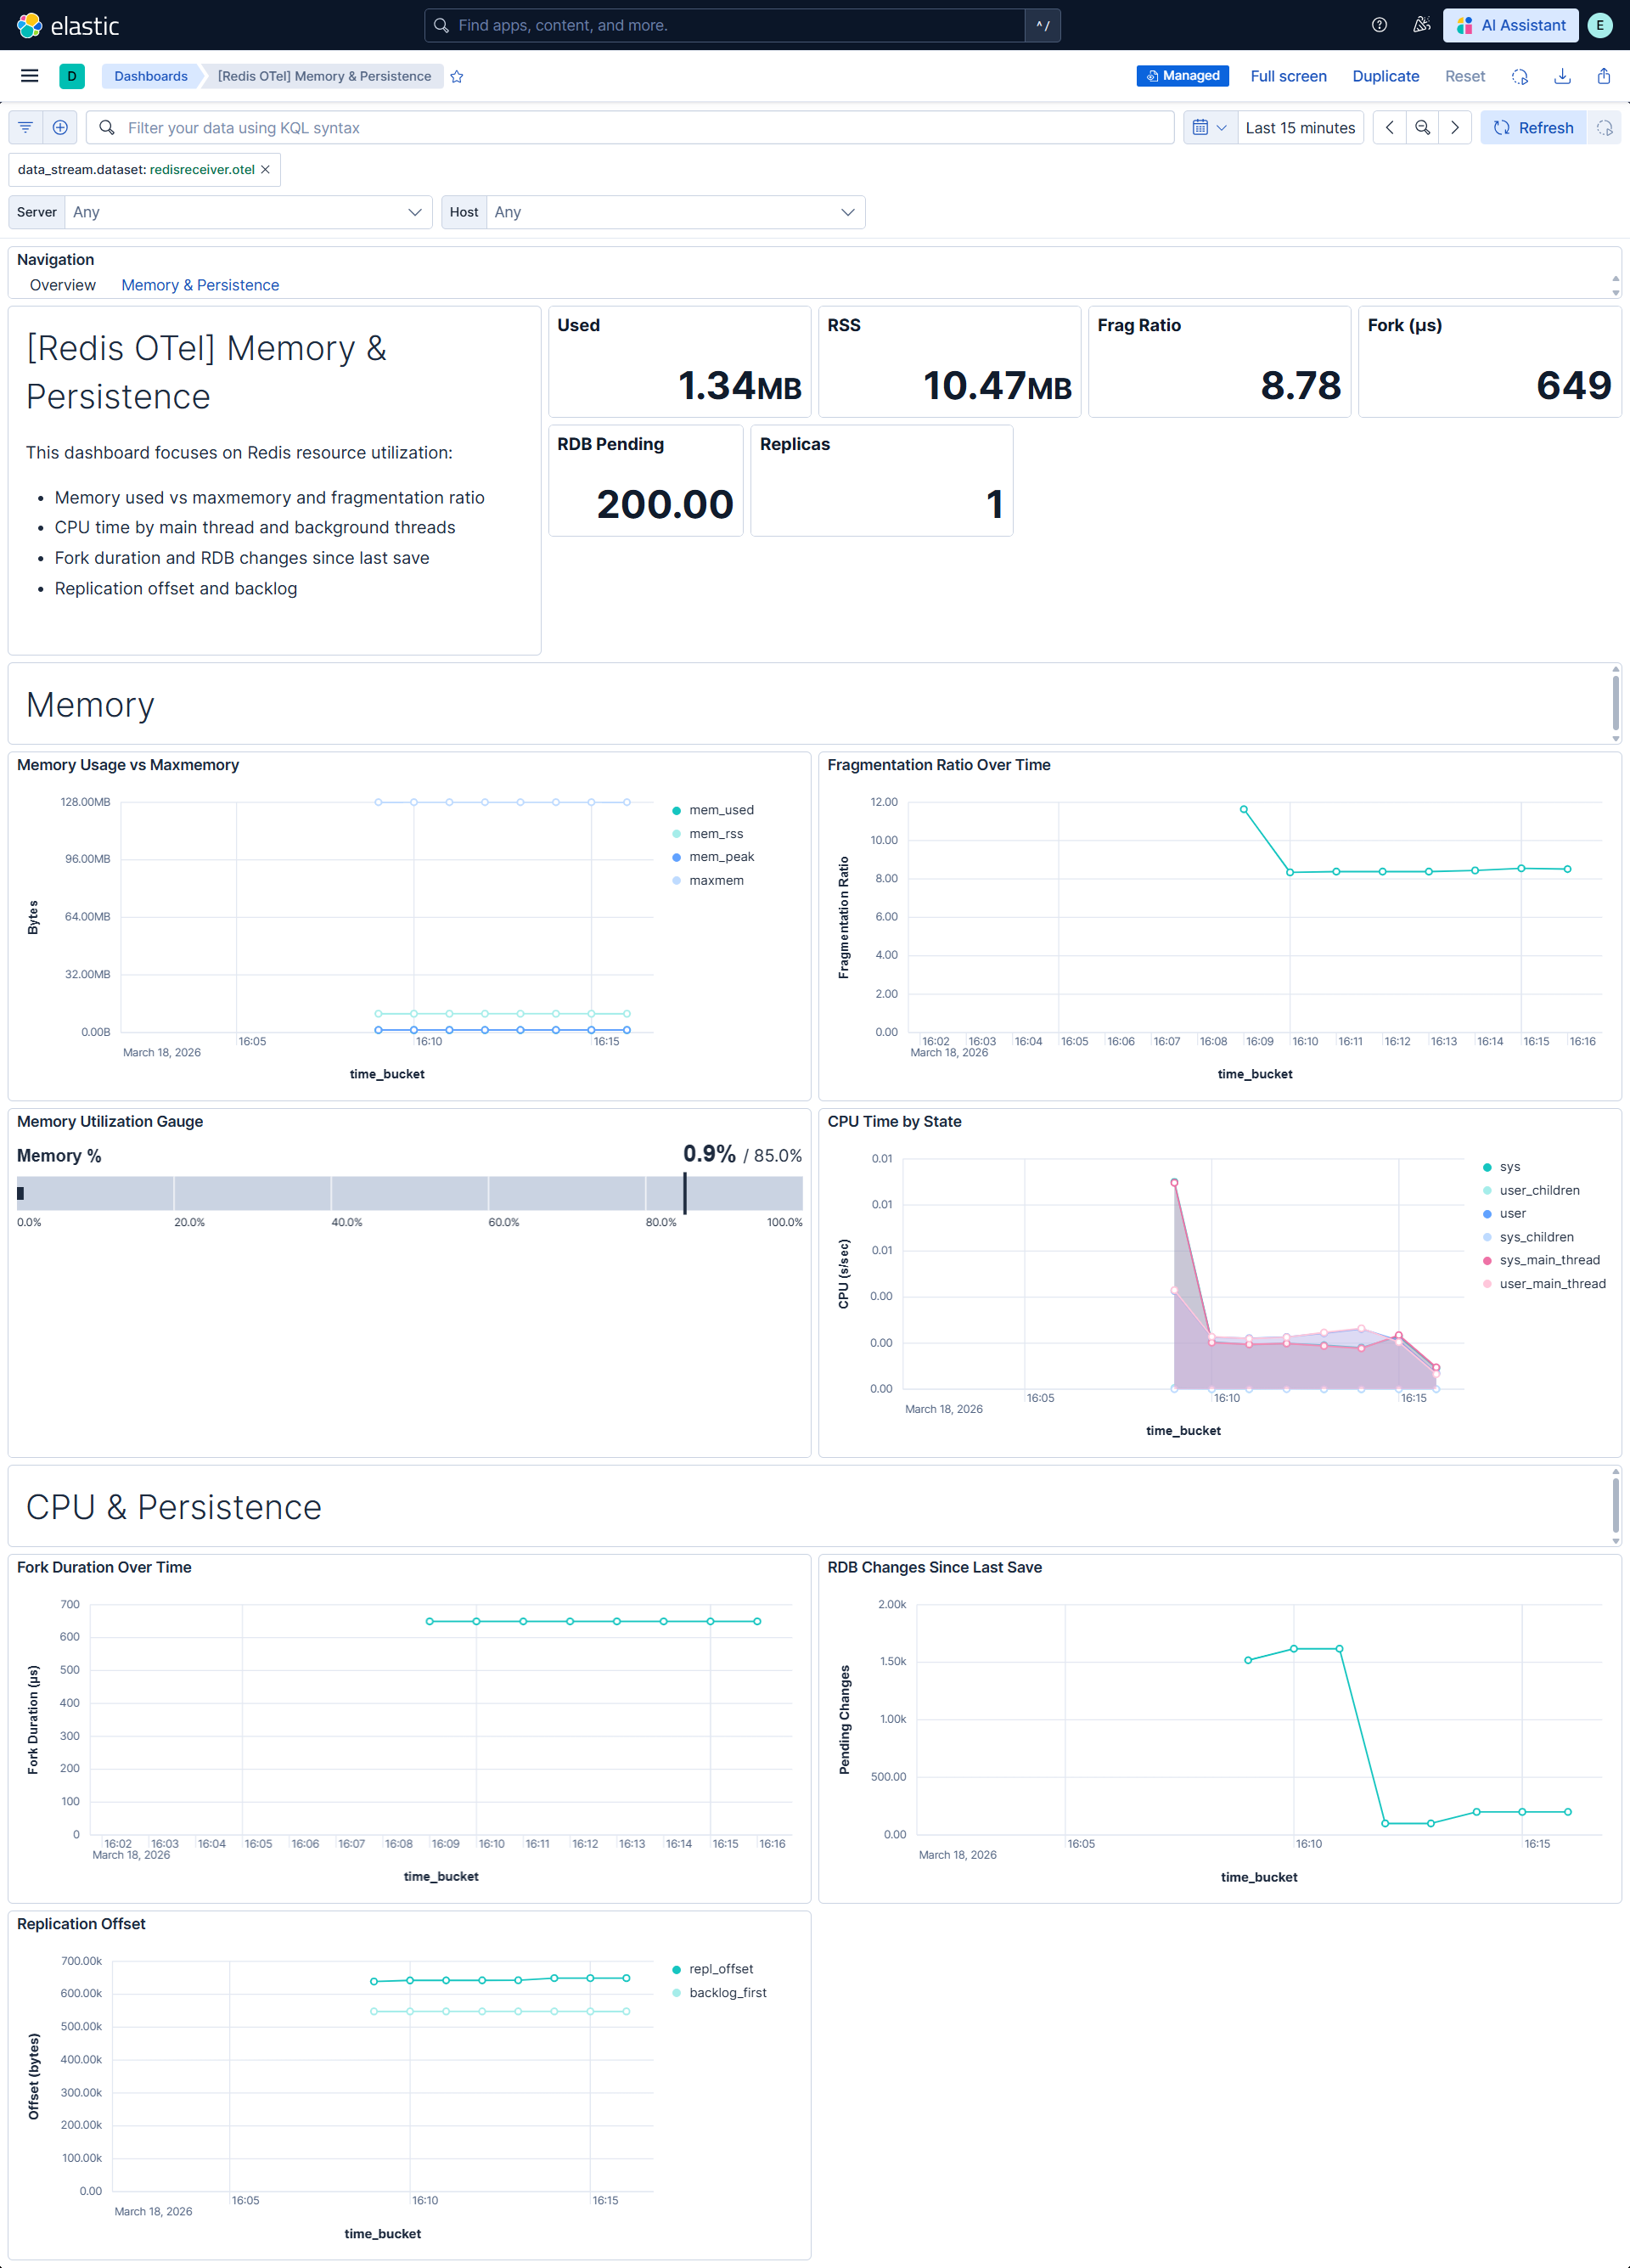
| **[Redis OTel] Memory & Persistence** | Detailed view of Redis memory usage, fragmentation, CPU consumption, and persistence (RDB, fork duration, replication offset). |
## Alert rules
| Alert | Trigger | Severity |
|----------------------------------------------------------|-------------------------------------------------------|----------|
| **[Redis OTel] Rejected connections** | One or more connections rejected (maxclients reached) | Critical |
| **[Redis OTel] Memory fragmentation indicates swapping** | Fragmentation ratio below 1.0 (RSS < used memory) | Critical |
| **[Redis OTel] Memory approaching maxmemory** | Memory usage exceeds 90% of maxmemory | High |
| **[Redis OTel] High eviction rate** | Evictions exceed 100 in 15 minutes | High |
| **[Redis OTel] Primary has no connected replicas** | Primary instance has zero connected replicas | High |
## SLO templates
SLO templates require Elastic Stack version 9.4.0 or later.
| SLO | Target | Window | Description |
|----------------------------------------------------------------|--------|----------------|-----------------------------------------------------------------|
| **[Redis OTel] P99 command latency 99.5% rolling 30 days** | 99.5% | 30-day rolling | Tracks p99 command latency below 10 ms over 1-minute intervals. |
| **[Redis OTel] Fork duration 99.5% rolling 30 days** | 99.5% | 30-day rolling | Tracks fork duration below 100 ms over 1-minute intervals. |
| **[Redis OTel] Connection availability 99.5% rolling 30 days** | 99.5% | 30-day rolling | Tracks connection success rate over 1-minute intervals. |
## Screenshots
This integration includes one or more Kibana dashboards that visualizes the data collected by the integration. The screenshots below illustrate how the ingested data is displayed.
## Changelog
| Version | Details | Minimum Kibana version |
|-----------|-----------------------------------------------------------------------------------------------------------------------|------------------------|
| **0.1.0** | **Enhancement** ([View pull request](https://github.com/elastic/integrations/pull/17681))Initial draft of the package | 9.3.0 |