---
title: Redis Enterprise OpenTelemetry Assets
description: Redis Enterprise is a commercial, enterprise-grade Redis platform that provides clustered, highly available in-memory databases with sub-millisecond latency,...
url: https://docs-v3-preview.elastic.dev/elastic/integration-docs/tree/main/reference/redisenterprise_otel
products:
- Elastic integrations
applies_to:
- Serverless Observability projects: Generally available
- Serverless Security projects: Generally available
- Elastic Stack: Generally available since 9.2
---
# Redis Enterprise OpenTelemetry Assets
| | |
|-------------------------------------------------------------------------------------------------------------------------------|----------------------------------------------------------------|
| **Version** | 0.1.0 : Beta ([View all](#changelog)) |
| **Subscription level**[What's this?](https://www.elastic.co/subscriptions) | Basic |
| **Developed by**[What's this?](https://docs-v3-preview.elastic.dev/elastic/integration-docs/tree/main/reference/developed-by) | Elastic |
| **Minimum Kibana version(s)** | 9.2.1 |
To use beta integrations, go to the **Integrations** page in Kibana, scroll down, and toggle on the _Display beta integrations_ option.
Redis Enterprise is a commercial, enterprise-grade Redis platform that provides clustered, highly available in-memory databases with sub-millisecond latency, automatic failover, and multi-tenancy across distributed nodes.
These assets provide dashboards, alert rules, and SLO templates for monitoring Redis Enterprise clusters using metrics collected by the OpenTelemetry Collector Prometheus receiver from the Redis Enterprise v2 metrics endpoint, covering database performance, node infrastructure health, proxy and listener activity, shard-level diagnostics, and operational alerting.
## Compatibility
The Redis Enterprise OpenTelemetry assets have been tested with the OpenTelemetry Collector Contrib Prometheus receiver v0.145.0 scraping the Redis Enterprise v2 metrics endpoint (port 8070).
## Requirements
You need Elasticsearch for storing and searching your data and Kibana for visualizing and managing it.
You can use our hosted Elasticsearch Service on Elastic Cloud, which is recommended, or self-manage
the Elastic Stack on your own hardware.
## Setup
### Prerequisites
The Redis Enterprise cluster must expose its v2 metrics endpoint. This is enabled by default on port 8070 on each cluster node. Verify that the endpoint is accessible from the host running the OpenTelemetry Collector:
```bash
curl -sk https://:8070/v2
```
You should receive a Prometheus-formatted metrics response. If the endpoint is not accessible, check your network configuration and ensure TLS certificates are valid. The Prometheus receiver authenticates using the cluster credentials when TLS is enabled.
### Configuration
You can use the [OpenTelemetry Collector](https://opentelemetry.io/docs/collector/) or the [Elastic Distribution of OpenTelemetry Collector (EDOT Collector)](https://www.elastic.co/docs/current/en/integrations/open-telemetry-integration) to collect Redis Enterprise metrics.
Placeholders used in the configuration below:
- `` — Hostname or IP address of a Redis Enterprise cluster node (e.g., `redis-cluster-1.example.com`).
- `` — Your Elasticsearch endpoint URL (e.g., `https://my-deployment.es.us-central1.gcp.cloud.es.io:443`).
- `${env:ES_API_KEY}` — Elasticsearch API key, set via the `ES_API_KEY` environment variable.
```yaml
receivers:
prometheus/redisenterprise:
config:
scrape_configs:
- job_name: redisenterprise
scrape_interval: 30s
scheme: https
tls_config:
insecure_skip_verify: true
static_configs:
- targets:
- ":8070"
metrics_path: /v2
processors:
resource:
attributes:
- key: data_stream.dataset
value: redisenterprise
action: upsert
exporters:
elasticsearch/otel:
endpoints:
- ""
api_key: ${env:ES_API_KEY}
mapping:
mode: otel
logs_dynamic_index:
enabled: true
metrics_dynamic_index:
enabled: true
service:
pipelines:
metrics:
receivers:
- prometheus/redisenterprise
processors:
- resource
exporters:
- elasticsearch/otel
```
If your Redis Enterprise cluster uses mutual TLS authentication, add `cert_file` and `key_file` to the `tls_config` section. To monitor multiple nodes, add additional entries to the `static_configs.targets` list. Service discovery can be used for dynamic environments.
## Reference
### Metrics
The Redis Enterprise v2 metrics endpoint exposes Prometheus-formatted metrics covering all levels of the cluster hierarchy: cluster, node, database (BDB), listener/endpoint, DMC proxy, and shard (Redis process). These are collected using the [Prometheus receiver](https://github.com/open-telemetry/opentelemetry-collector-contrib/blob/main/receiver/prometheusreceiver/README.md) from the OpenTelemetry Collector Contrib repository. Refer to the [Redis Enterprise metrics documentation](https://docs.redis.com/latest/rs/references/metrics/) for details on available metrics and their definitions.
## Dashboards
| Dashboard | Description |
|--------------------------------------------------|----------------------------------------------------------------------------------------------------------------------------------------------------------------------|
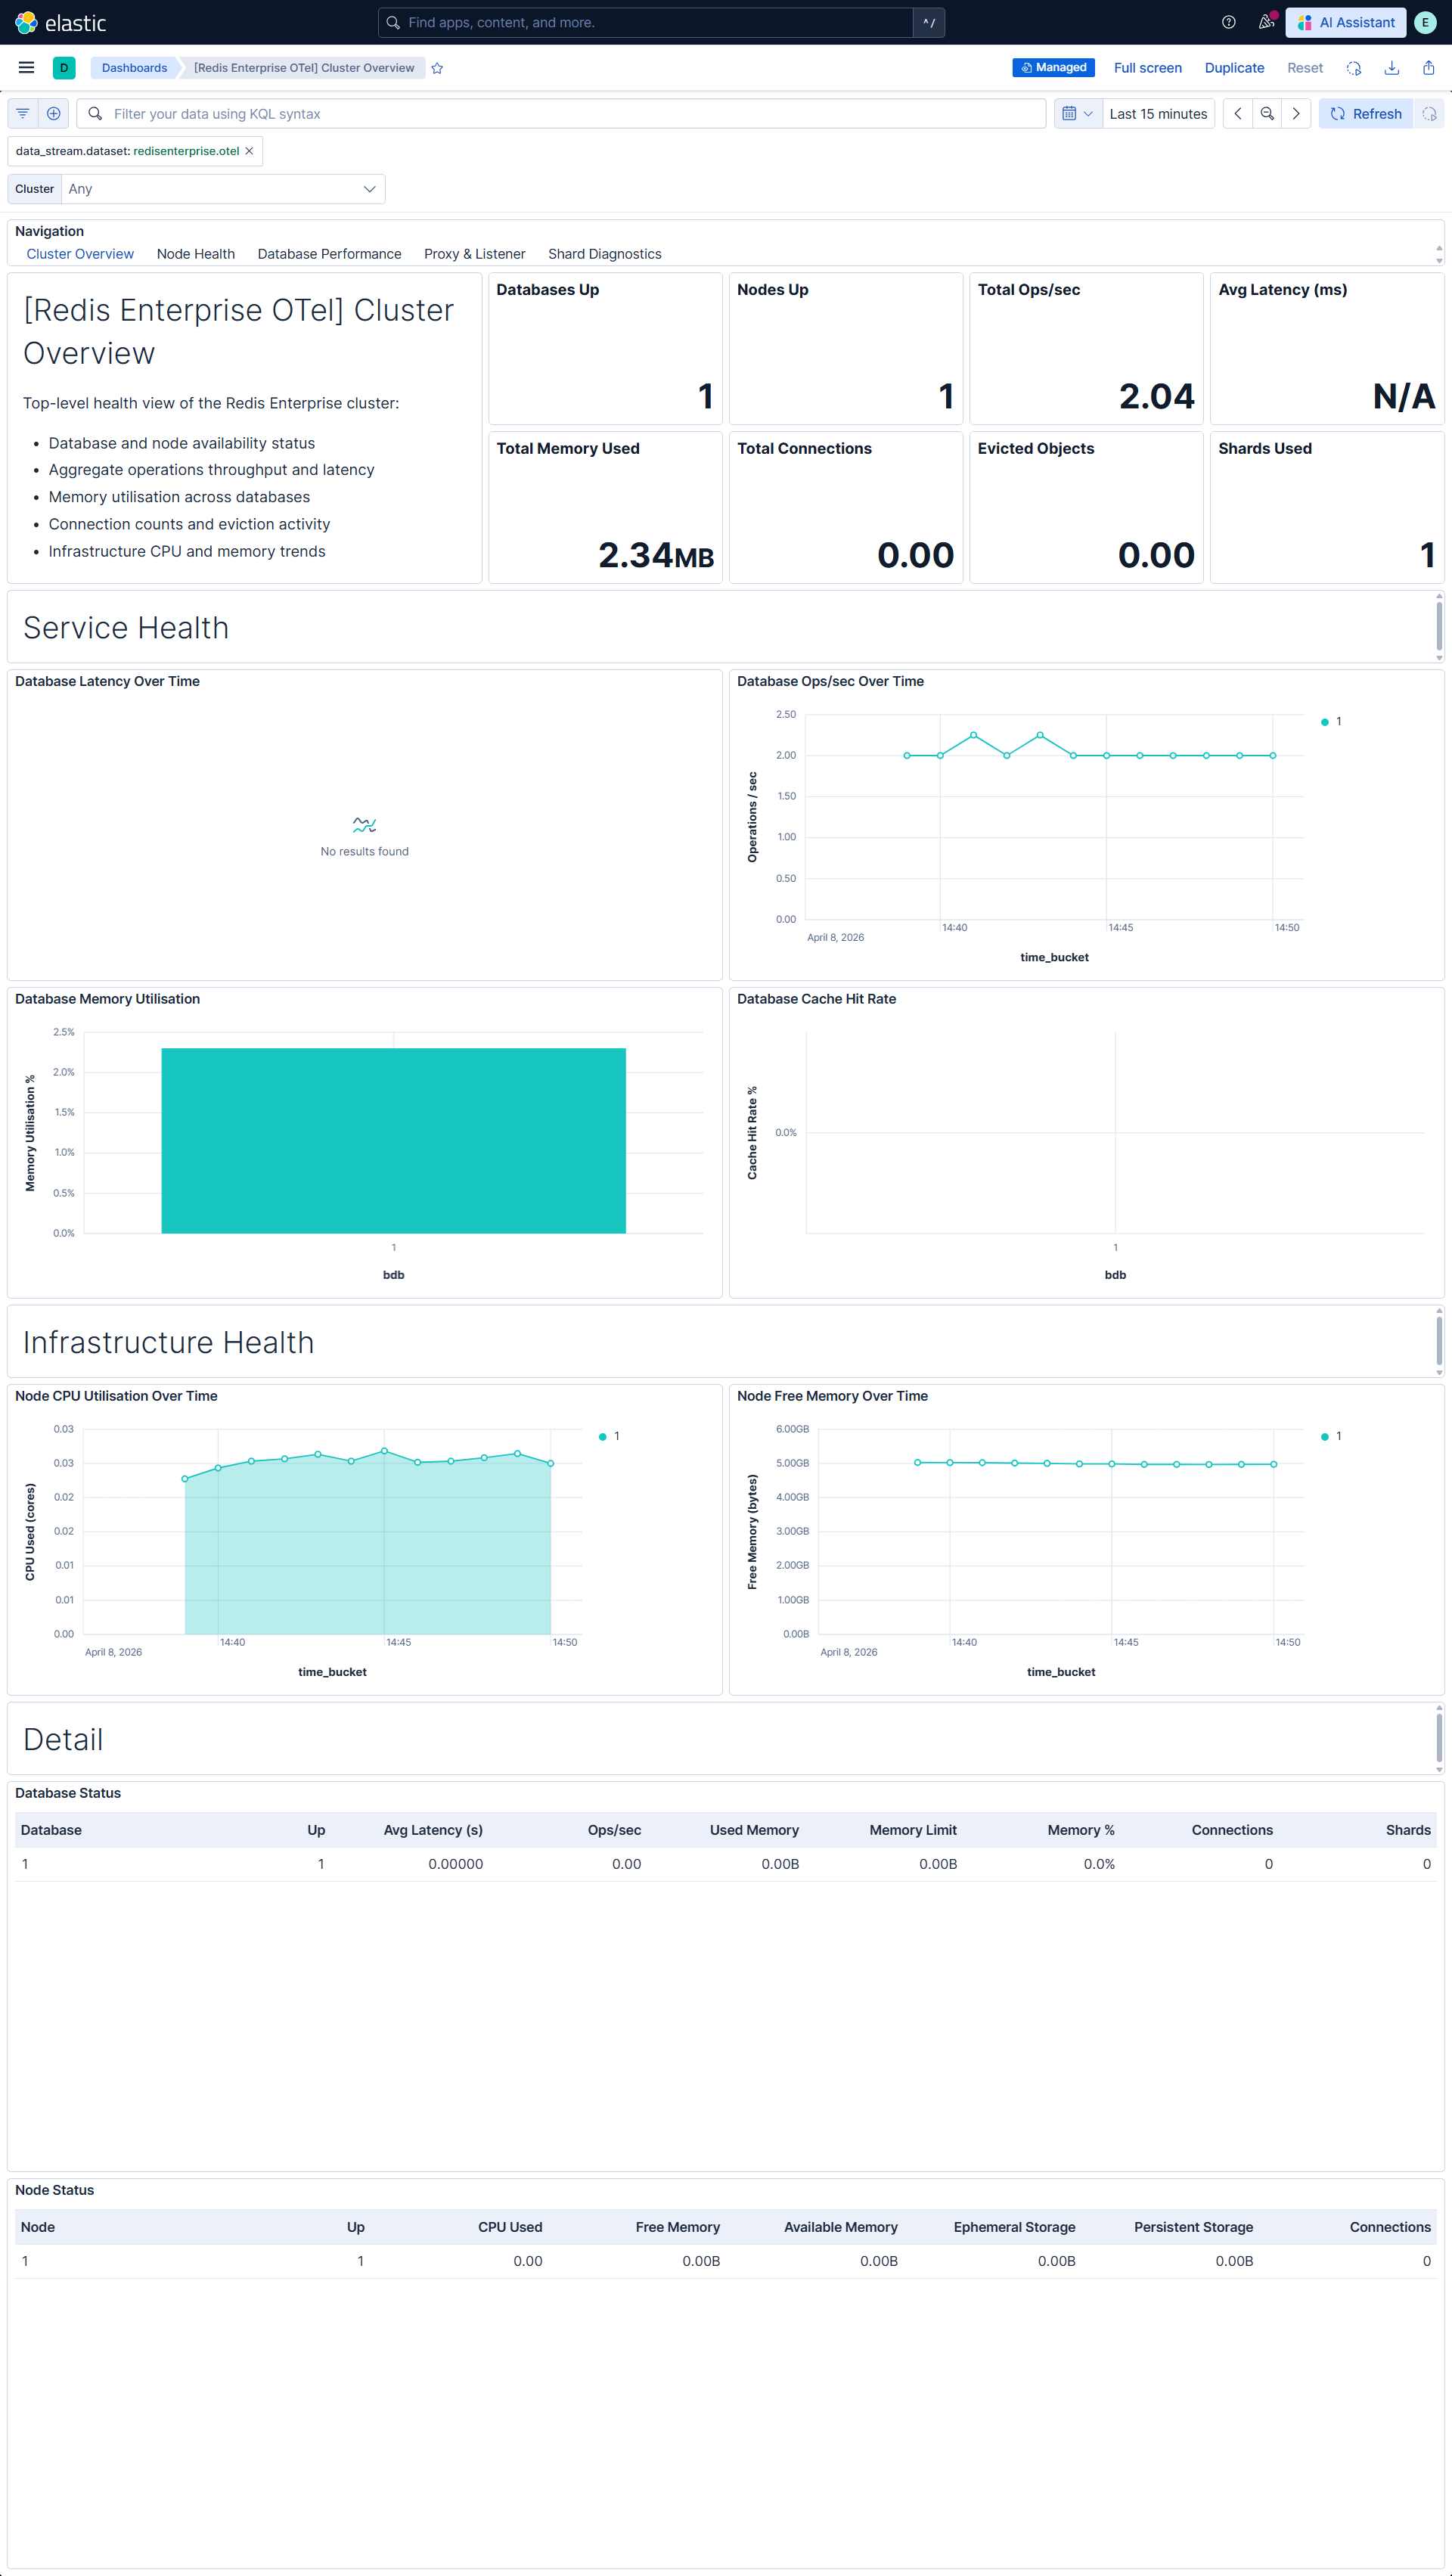
| **[Redis Enterprise OTel] Cluster Overview** | High-level health and performance overview covering database status, node infrastructure, and key operational KPIs. |
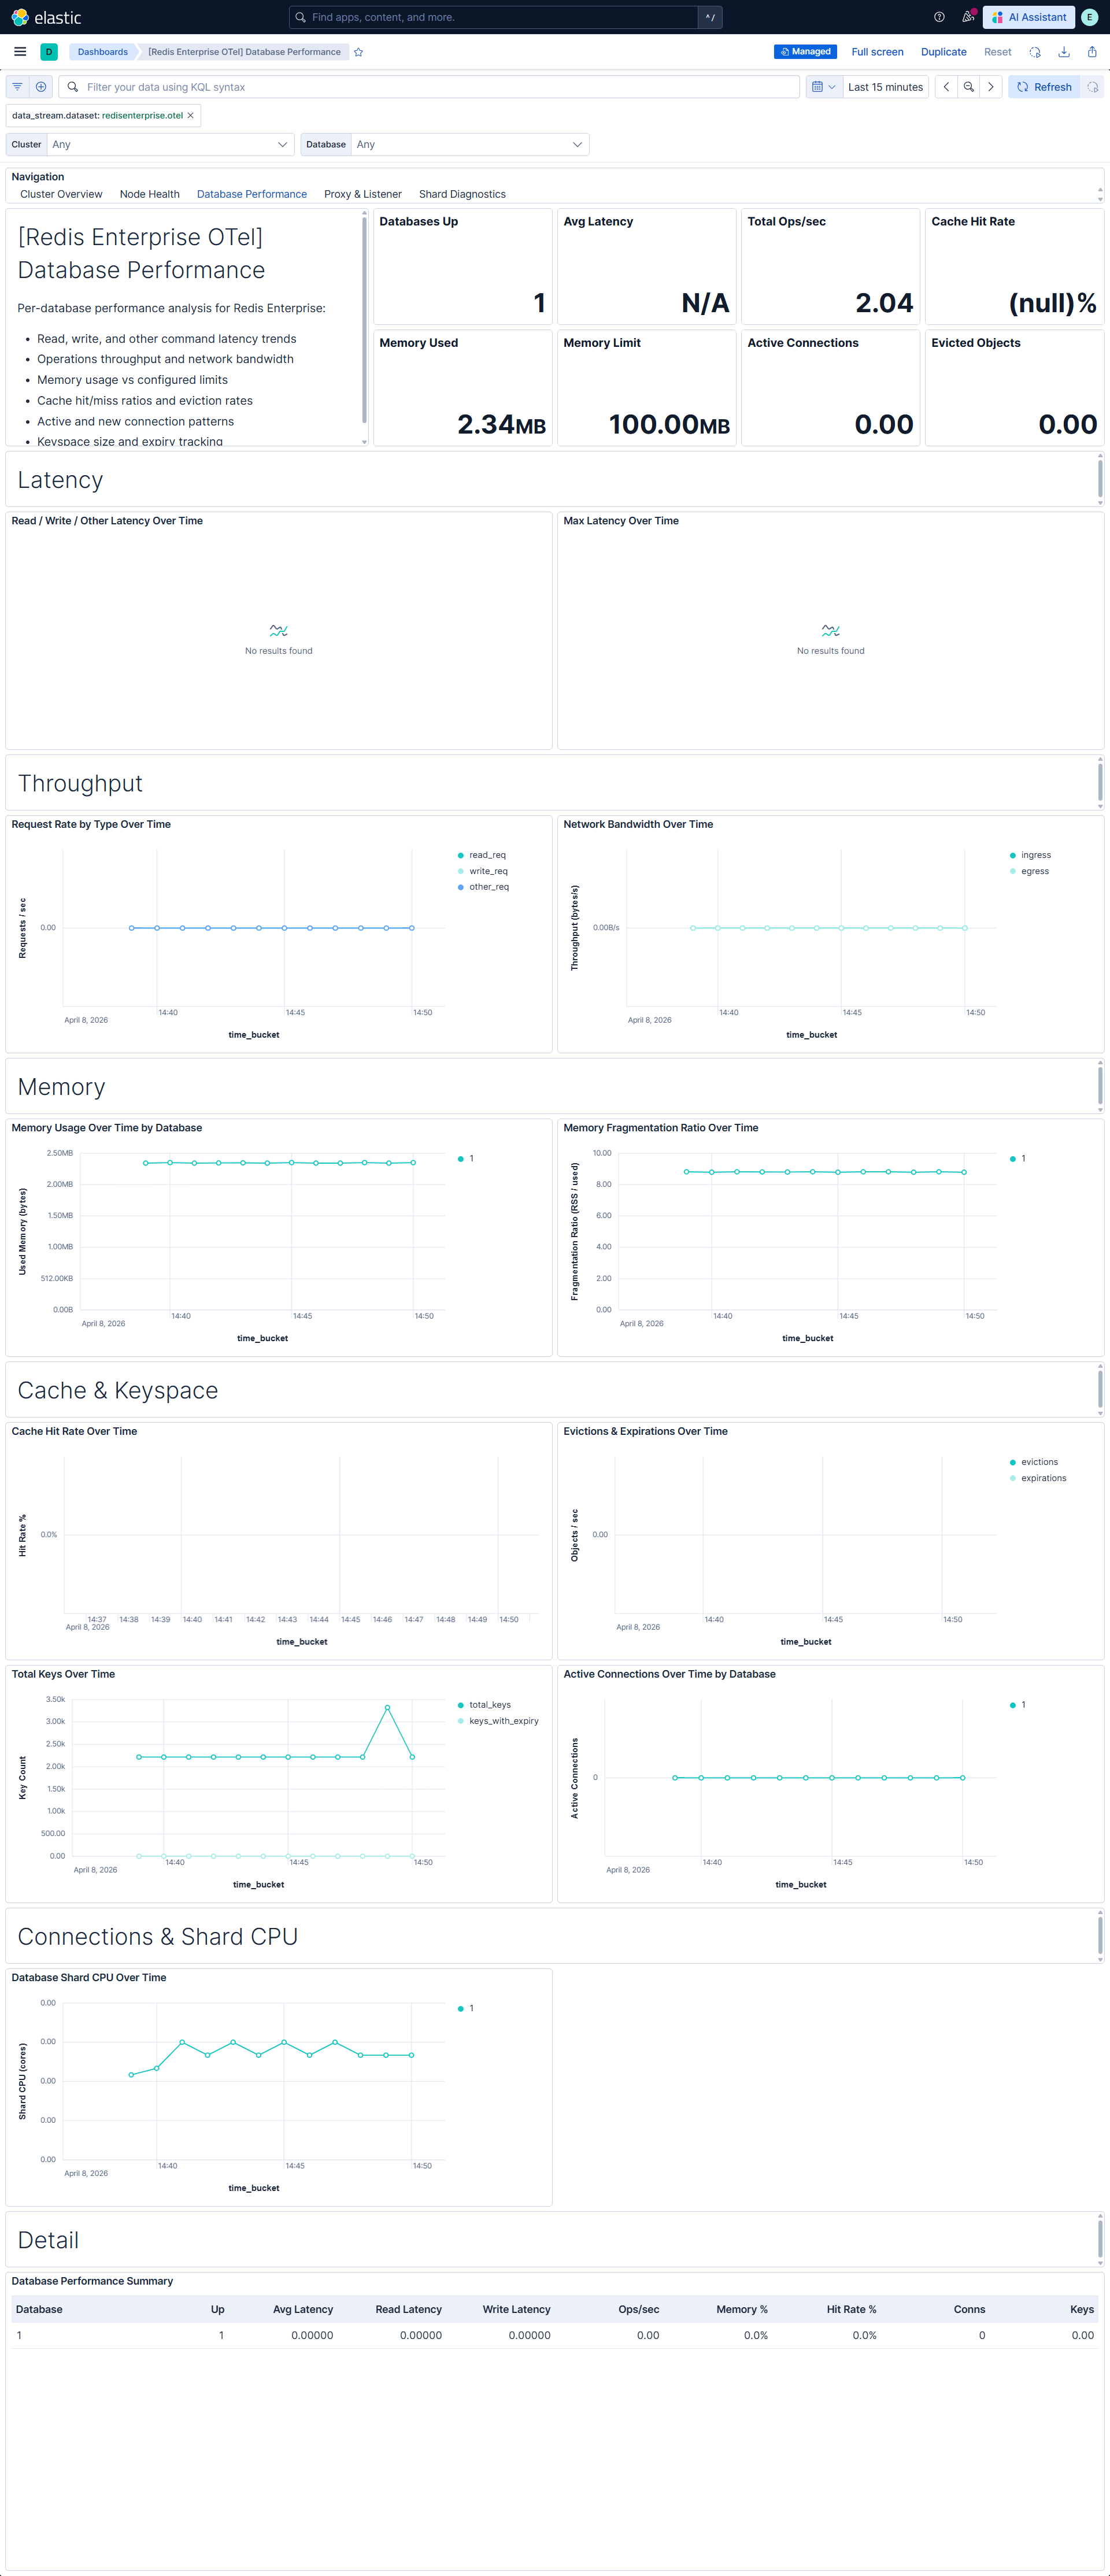
| **[Redis Enterprise OTel] Database Performance** | Per-database performance analysis with latency breakdown, throughput, memory utilization, cache effectiveness, and connection patterns. |
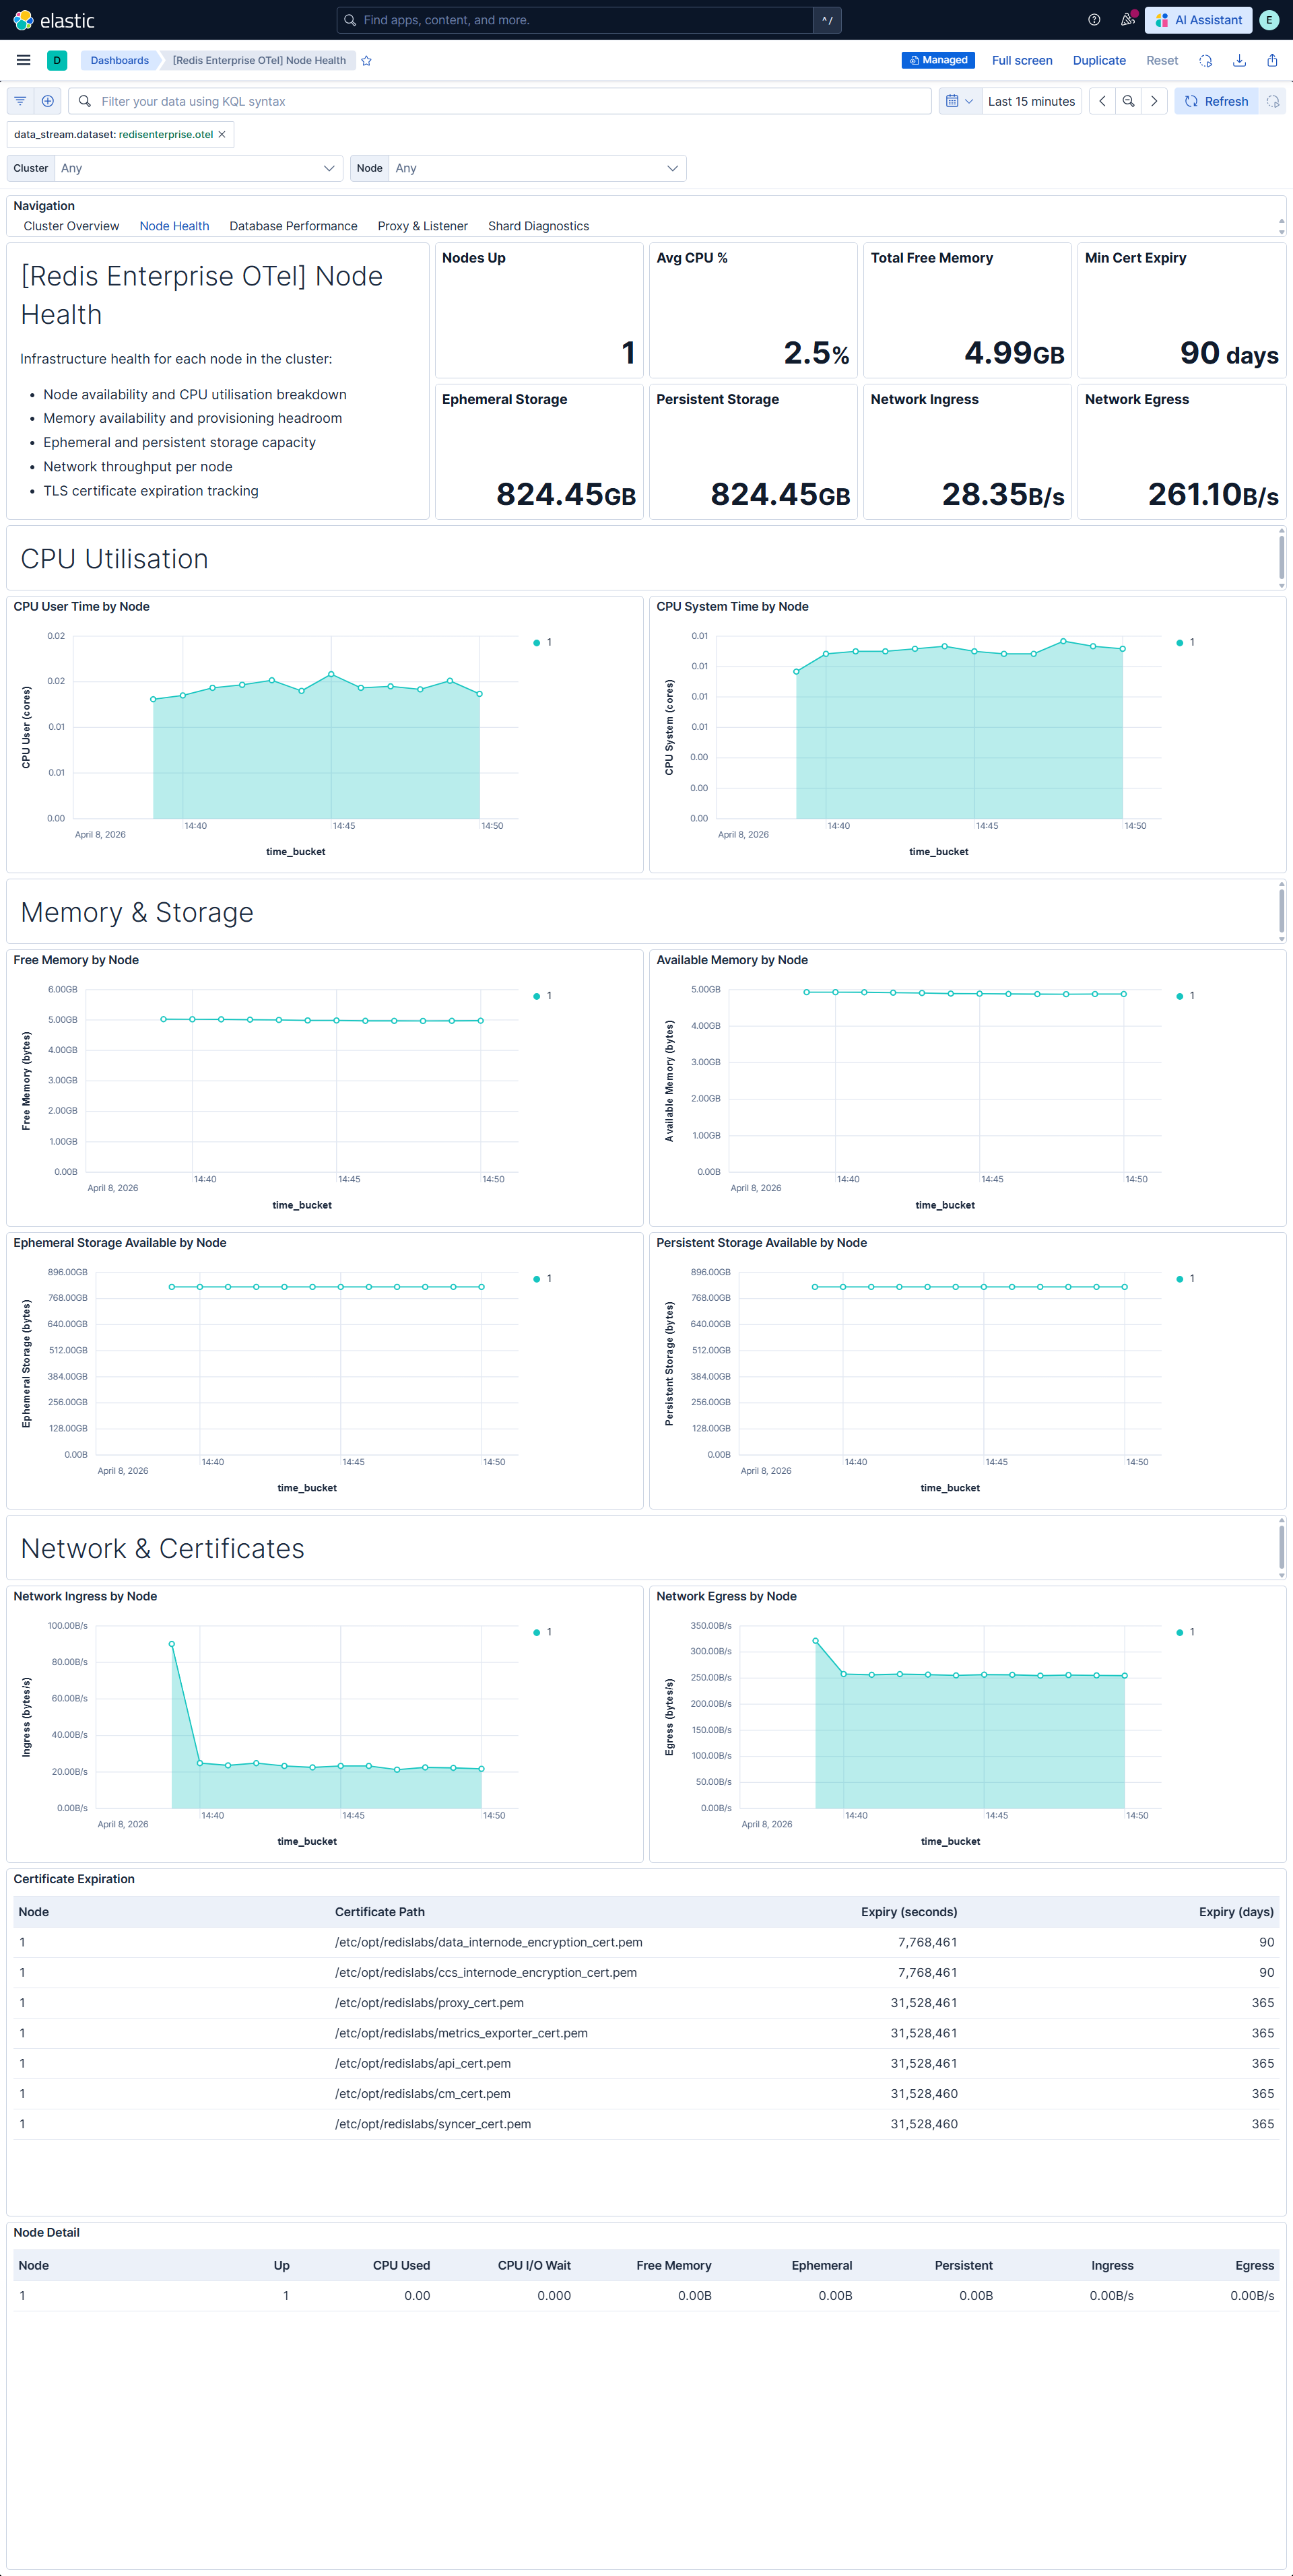
| **[Redis Enterprise OTel] Node Health** | Node-level monitoring covering CPU, memory, storage, network, and certificate expiration across all cluster nodes. |
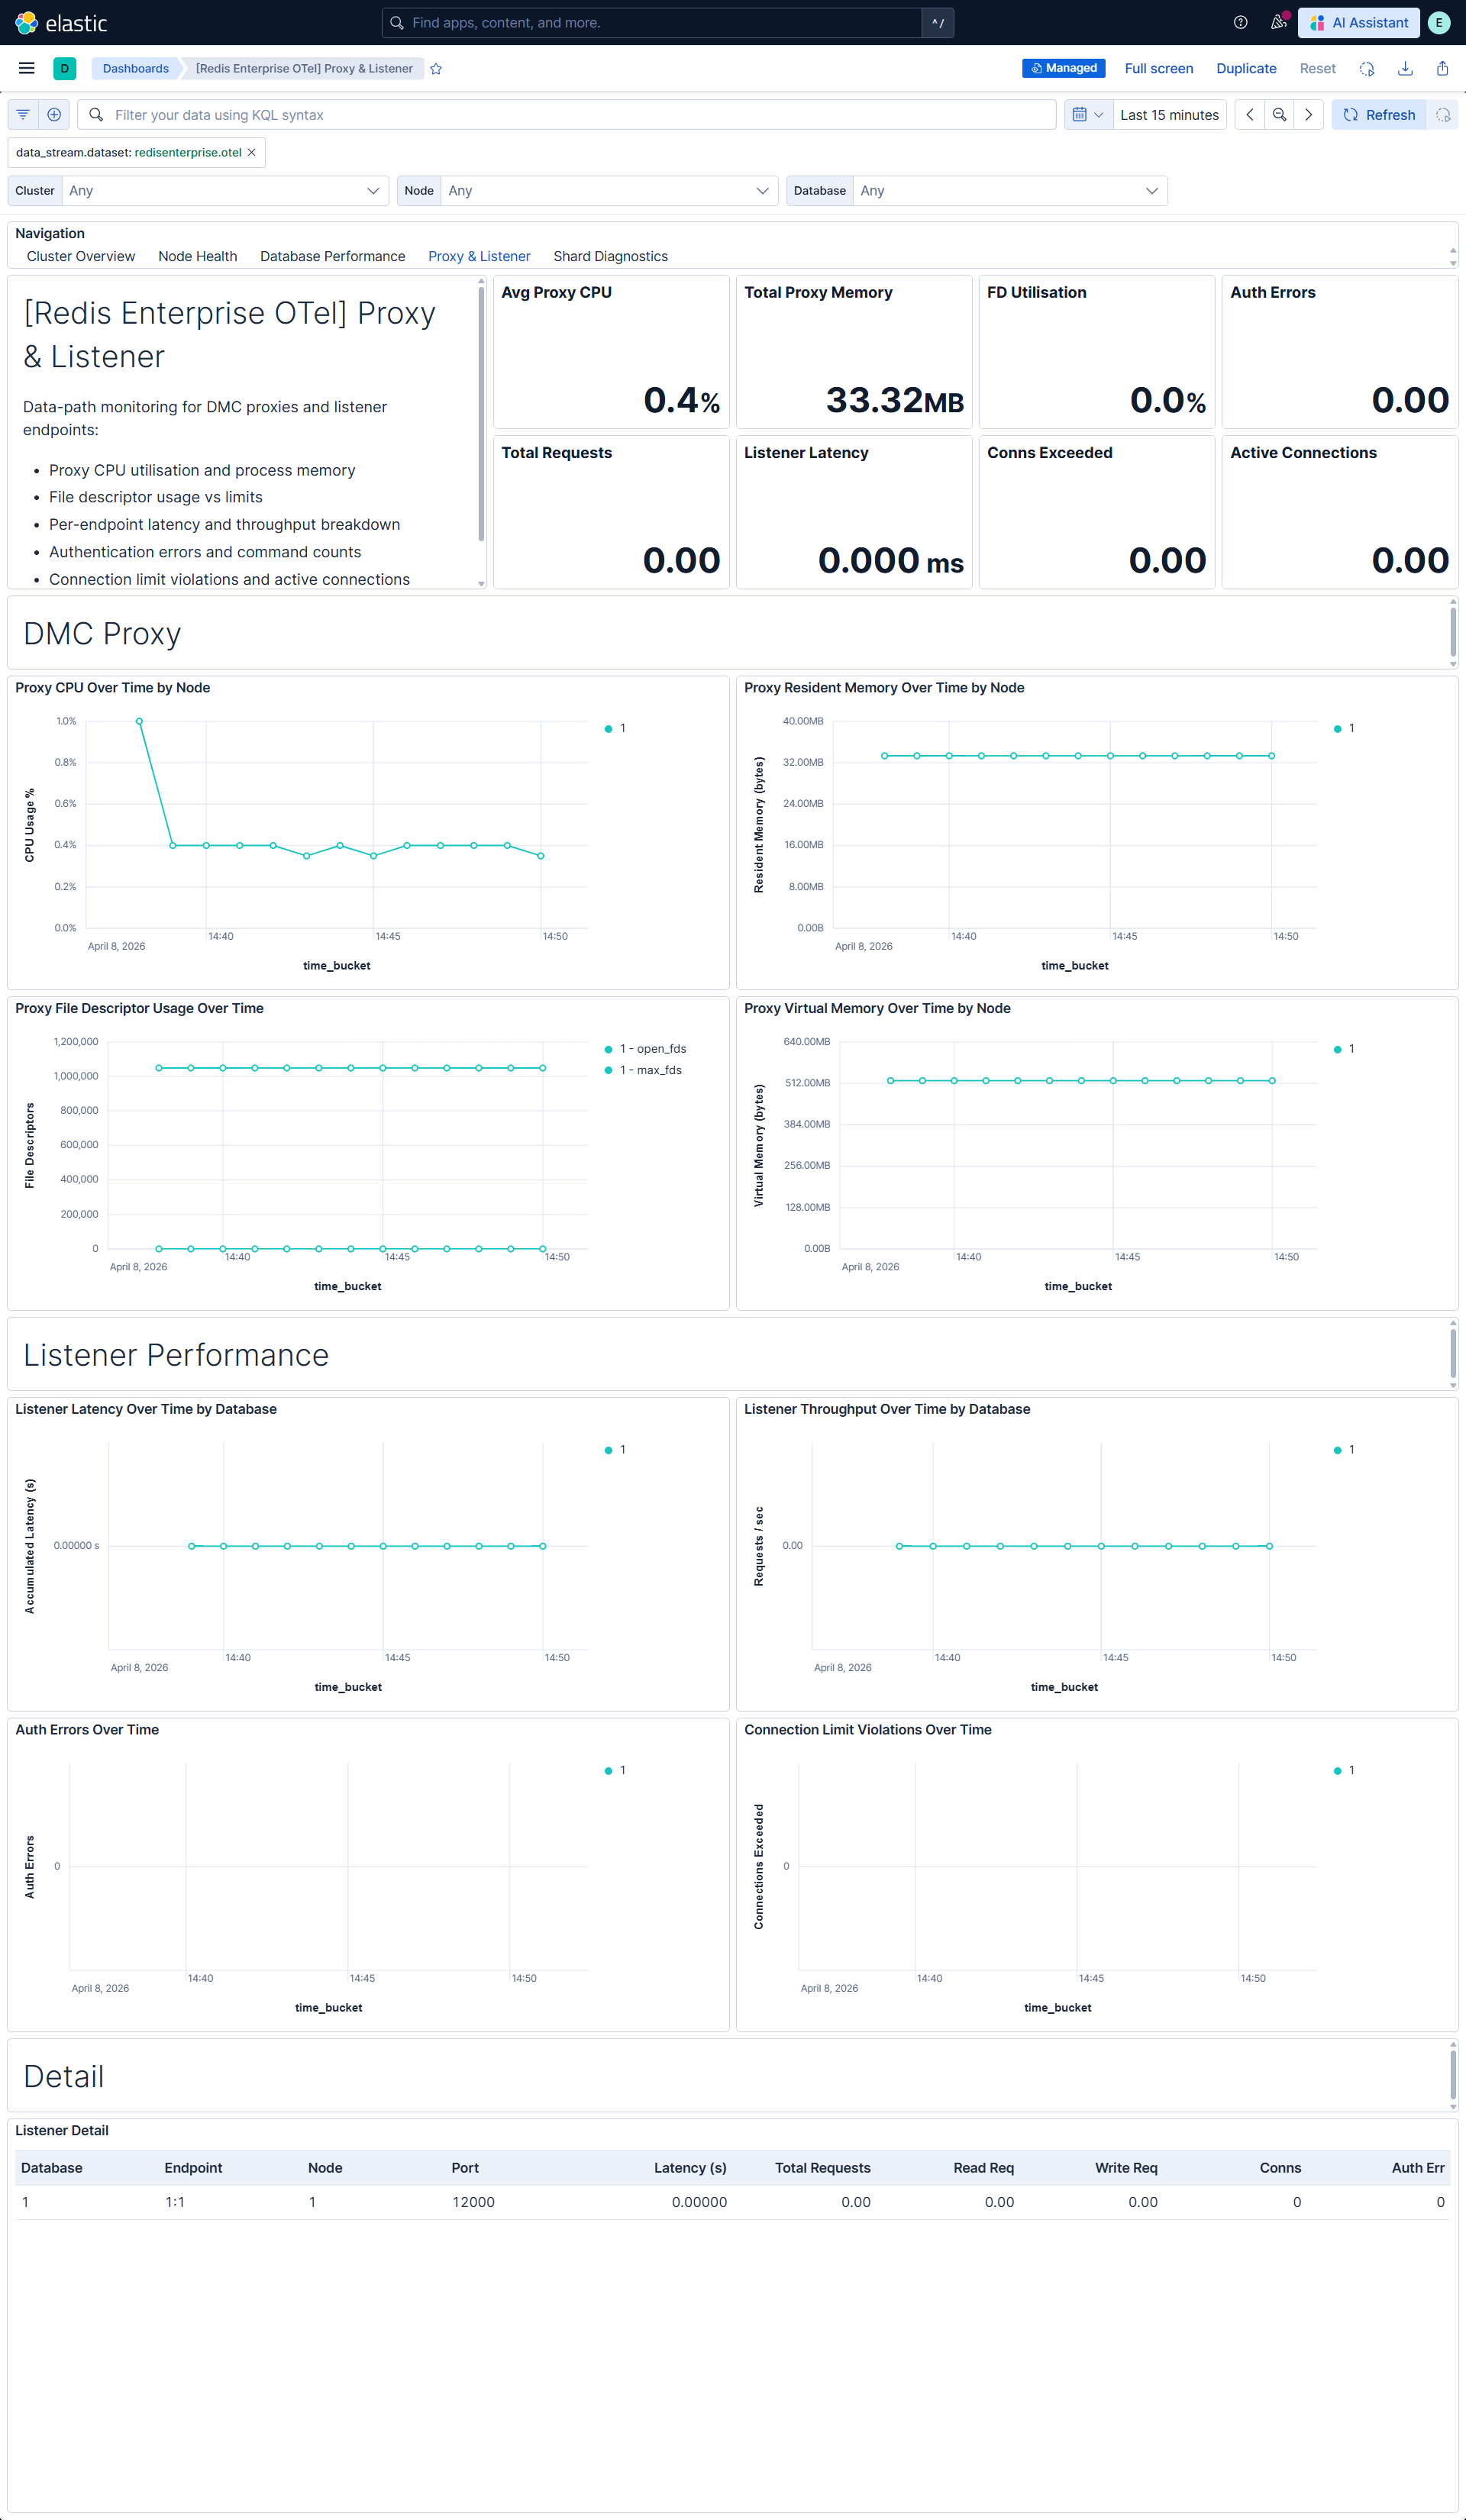
| **[Redis Enterprise OTel] Proxy & Listener** | DMC proxy resource usage and listener-level performance metrics including proxy CPU, memory, file descriptors, latency, throughput, and authentication activity. |
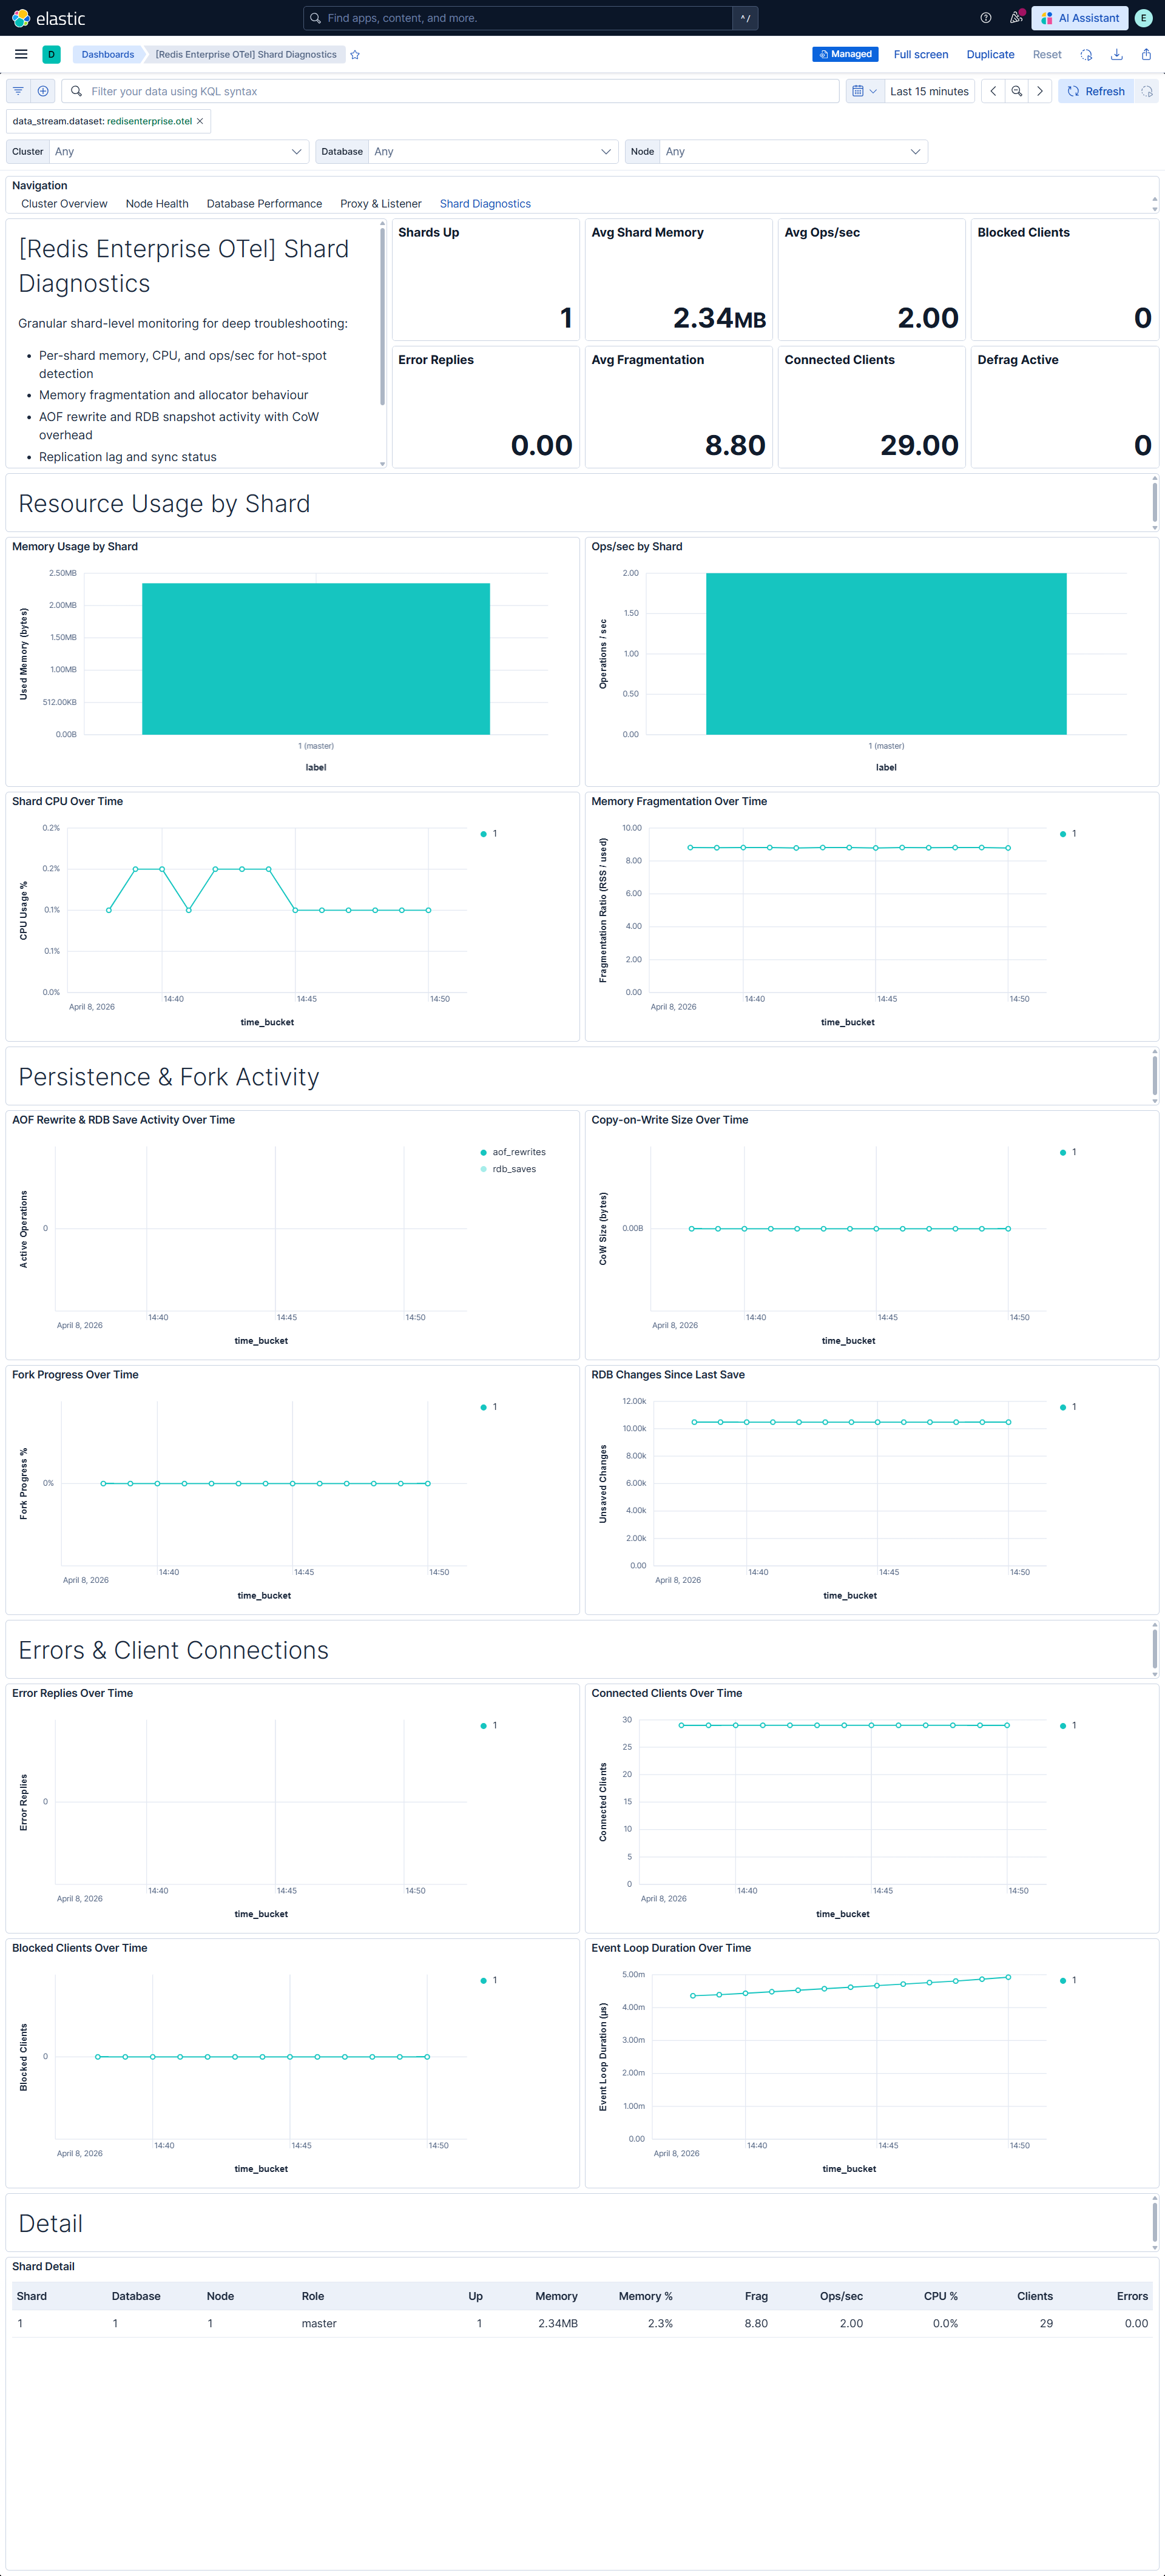
| **[Redis Enterprise OTel] Shard Diagnostics** | Shard-level deep diagnostics for per-shard resource usage, memory fragmentation, persistence operations, replication health, error analysis, and client connections. |
## Alert rules
| Alert | Trigger | Severity |
|------------------------------------------------------------------|------------------------------------------------------------------------------------|----------|
| **[Redis Enterprise OTel] Database down** | Database reports as unavailable (bdb_up < 1) | Critical |
| **[Redis Enterprise OTel] Node down** | Node reports as unavailable (node_up < 1) | Critical |
| **[Redis Enterprise OTel] Shard down** | Shard reports as unavailable (redis_up < 1) | Critical |
| **[Redis Enterprise OTel] Database memory utilization critical** | Database memory usage exceeds 90% of configured limit | Critical |
| **[Redis Enterprise OTel] Database high latency** | Average database latency exceeds 5 ms | High |
| **[Redis Enterprise OTel] Node CPU saturation** | Node CPU utilization exceeds 85% | High |
| **[Redis Enterprise OTel] TLS certificate expiring soon** | Any TLS certificate expires within 30 days | High |
| **[Redis Enterprise OTel] Shard persistence failures** | Consecutive RDB or AOF persistence failures detected | High |
| **[Redis Enterprise OTel] Node free memory low** | Node free memory drops below 1 GB | Medium |
| **[Redis Enterprise OTel] Node storage running low** | Available persistent or ephemeral storage drops below 5 GB | Medium |
| **[Redis Enterprise OTel] Proxy file descriptor saturation** | Proxy file descriptor utilization exceeds 80% | Medium |
| **[Redis Enterprise OTel] Shard connection saturation** | Shard client connection utilization exceeds 80% | Medium |
| **[Redis Enterprise OTel] Shard high memory fragmentation** | Shard memory fragmentation ratio exceeds 1.5 for shards with more than 10 MB usage | Medium |
| **[Redis Enterprise OTel] Database unexpected key evictions** | Key evictions detected on a database (may be expected for caching workloads) | Warning |
| **[Redis Enterprise OTel] Authentication failures detected** | Authentication failures detected at listener endpoints | Warning |
## SLO templates
| SLO | Target | Window | Description |
|------------------------------------------------------------------------------------|--------|----------------|----------------------------------------------------------------------------------------------------------------|
| **[Redis Enterprise OTel] Database availability 99.5% rolling 30 days** | 99.5% | 30-day rolling | Tracks database availability via bdb_up, ensuring databases remain healthy across 1-minute timeslice windows. |
| **[Redis Enterprise OTel] Average database request latency 99.5% rolling 30 days** | 99.5% | 30-day rolling | Tracks average request latency, ensuring 1-minute windows maintain average latency below 5 ms. |
| **[Redis Enterprise OTel] Database memory utilization 99.5% rolling 30 days** | 99.5% | 30-day rolling | Monitors memory utilization ratio, ensuring 1-minute windows maintain usage below 90% of the configured limit. |
## Screenshots
This integration includes one or more Kibana dashboards that visualizes the data collected by the integration. The screenshots below illustrate how the ingested data is displayed.
## Changelog
| Version | Details | Minimum Kibana version |
|-----------|-----------------------------------------------------------------------------------------------------------------------|------------------------|
| **0.1.0** | **Enhancement** ([View pull request](https://github.com/elastic/integrations/pull/18002))Initial draft of the package | 9.2.1 |