---
title: Supabase OpenTelemetry Assets
description: Supabase is an open-source Firebase alternative built on top of PostgreSQL, offering authentication, real-time subscriptions, RESTful APIs, and connection...
url: https://docs-v3-preview.elastic.dev/elastic/integration-docs/tree/main/reference/supabase_otel
products:
- Elastic integrations
applies_to:
- Serverless Observability projects: Preview
- Serverless Security projects: Preview
- Elastic Stack: Preview since 9.4
---
# Supabase OpenTelemetry Assets
| | |
|-------------------------------------------------------------------------------------------------------------------------------|-------------------------------------------------------------------|
| **Version** | 0.1.0 : Preview ([View all](#changelog)) |
| **Subscription level**[What's this?](https://www.elastic.co/subscriptions) | Basic |
| **Developed by**[What's this?](https://docs-v3-preview.elastic.dev/elastic/integration-docs/tree/main/reference/developed-by) | Elastic |
| **Minimum Kibana version(s)** | 9.4.0 |
To use pre-release integrations, go to the **Integrations** page in Kibana, scroll down, and toggle on the _Display beta integrations_ option.
Supabase is an open-source Firebase alternative built on top of PostgreSQL, offering authentication, real-time subscriptions, RESTful APIs, and connection pooling as managed services.
This content package provides dashboards for Supabase projects monitored via the OpenTelemetry Prometheus receiver. The assets cover three observability tiers: node infrastructure, PostgreSQL database internals, and application services (GoTrue, PostgREST, Realtime).
## Requirements
You need Elasticsearch for storing and searching your data and Kibana for visualizing and managing it. You can use our hosted Elasticsearch Service on Elastic Cloud, which is recommended, or self-manage the Elastic Stack on your own hardware.
## Setup
### Prerequisites
1. A Supabase project with the Observability endpoint enabled. The endpoint exposes Prometheus-format metrics for infrastructure, PostgreSQL, and application services.
2. Install the **Supabase** integration package and configure it with your Supabase project credentials. This content package provides dashboards that visualize data collected by that integration.
### Configuration
Configure the Supabase Integration Package to scrape your Supabase Prometheus endpoint and export to Elasticsearch.
| Placeholder | Description | Example |
|-------------------------------|--------------------------------------------------|--------------------------------------------------------------------|
| `` | Supabase project Observability metrics endpoint | `https://.supabase.co/customer/v1/privileged/metrics` |
| `` | Supabase service role API key for authentication | `eyJhbGciOiJIUzI1NiIs...` |
## Dashboards
| Dashboard | Description |
|--------------------------------------------|---------------------------------------------------------------------------------------------------|
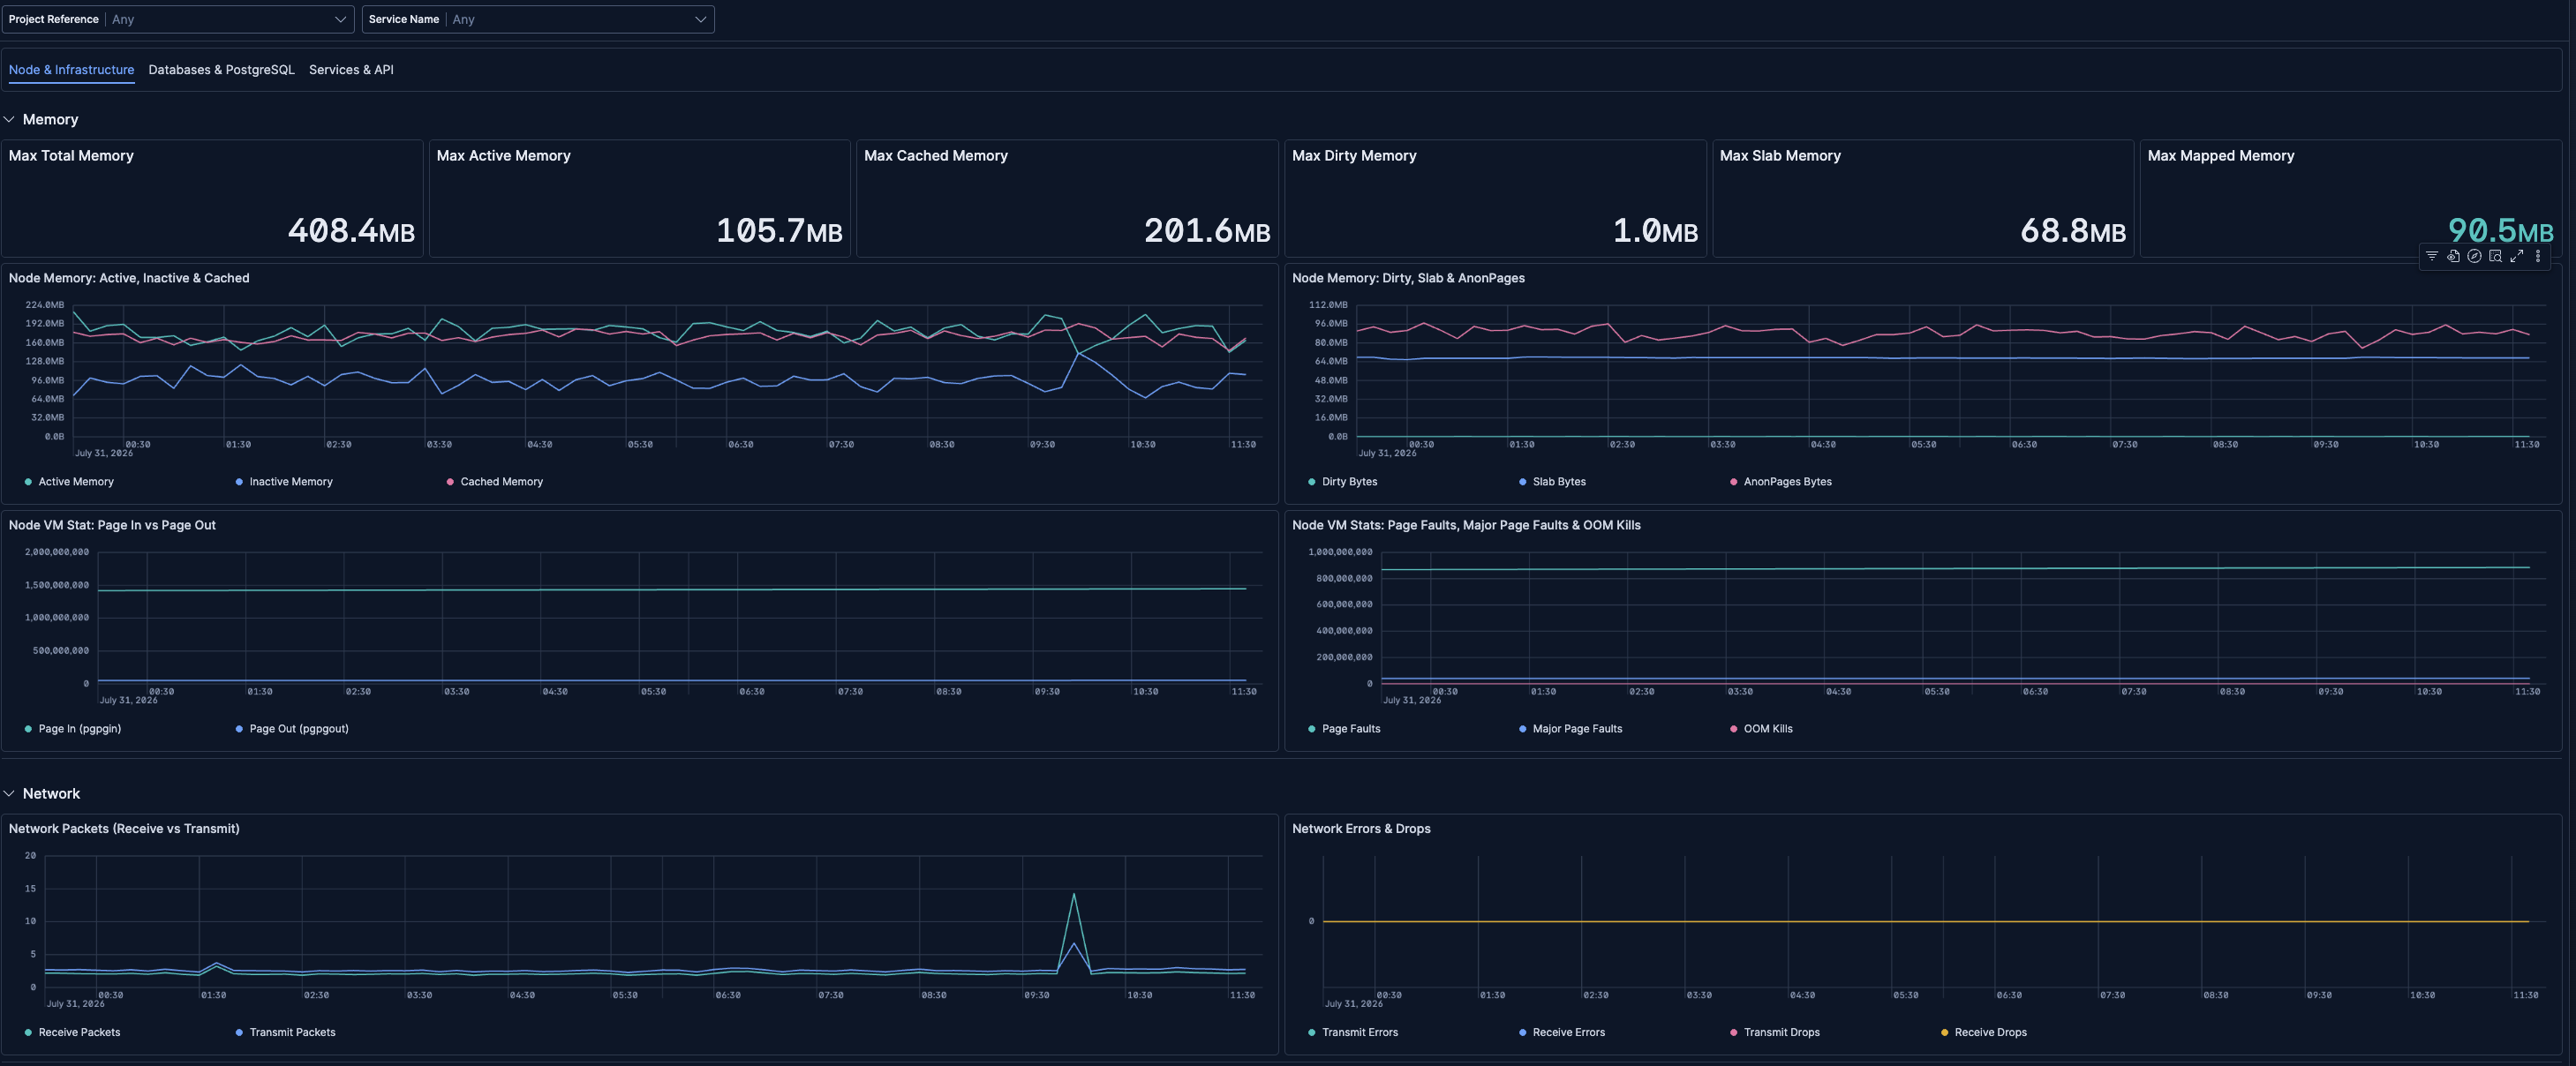
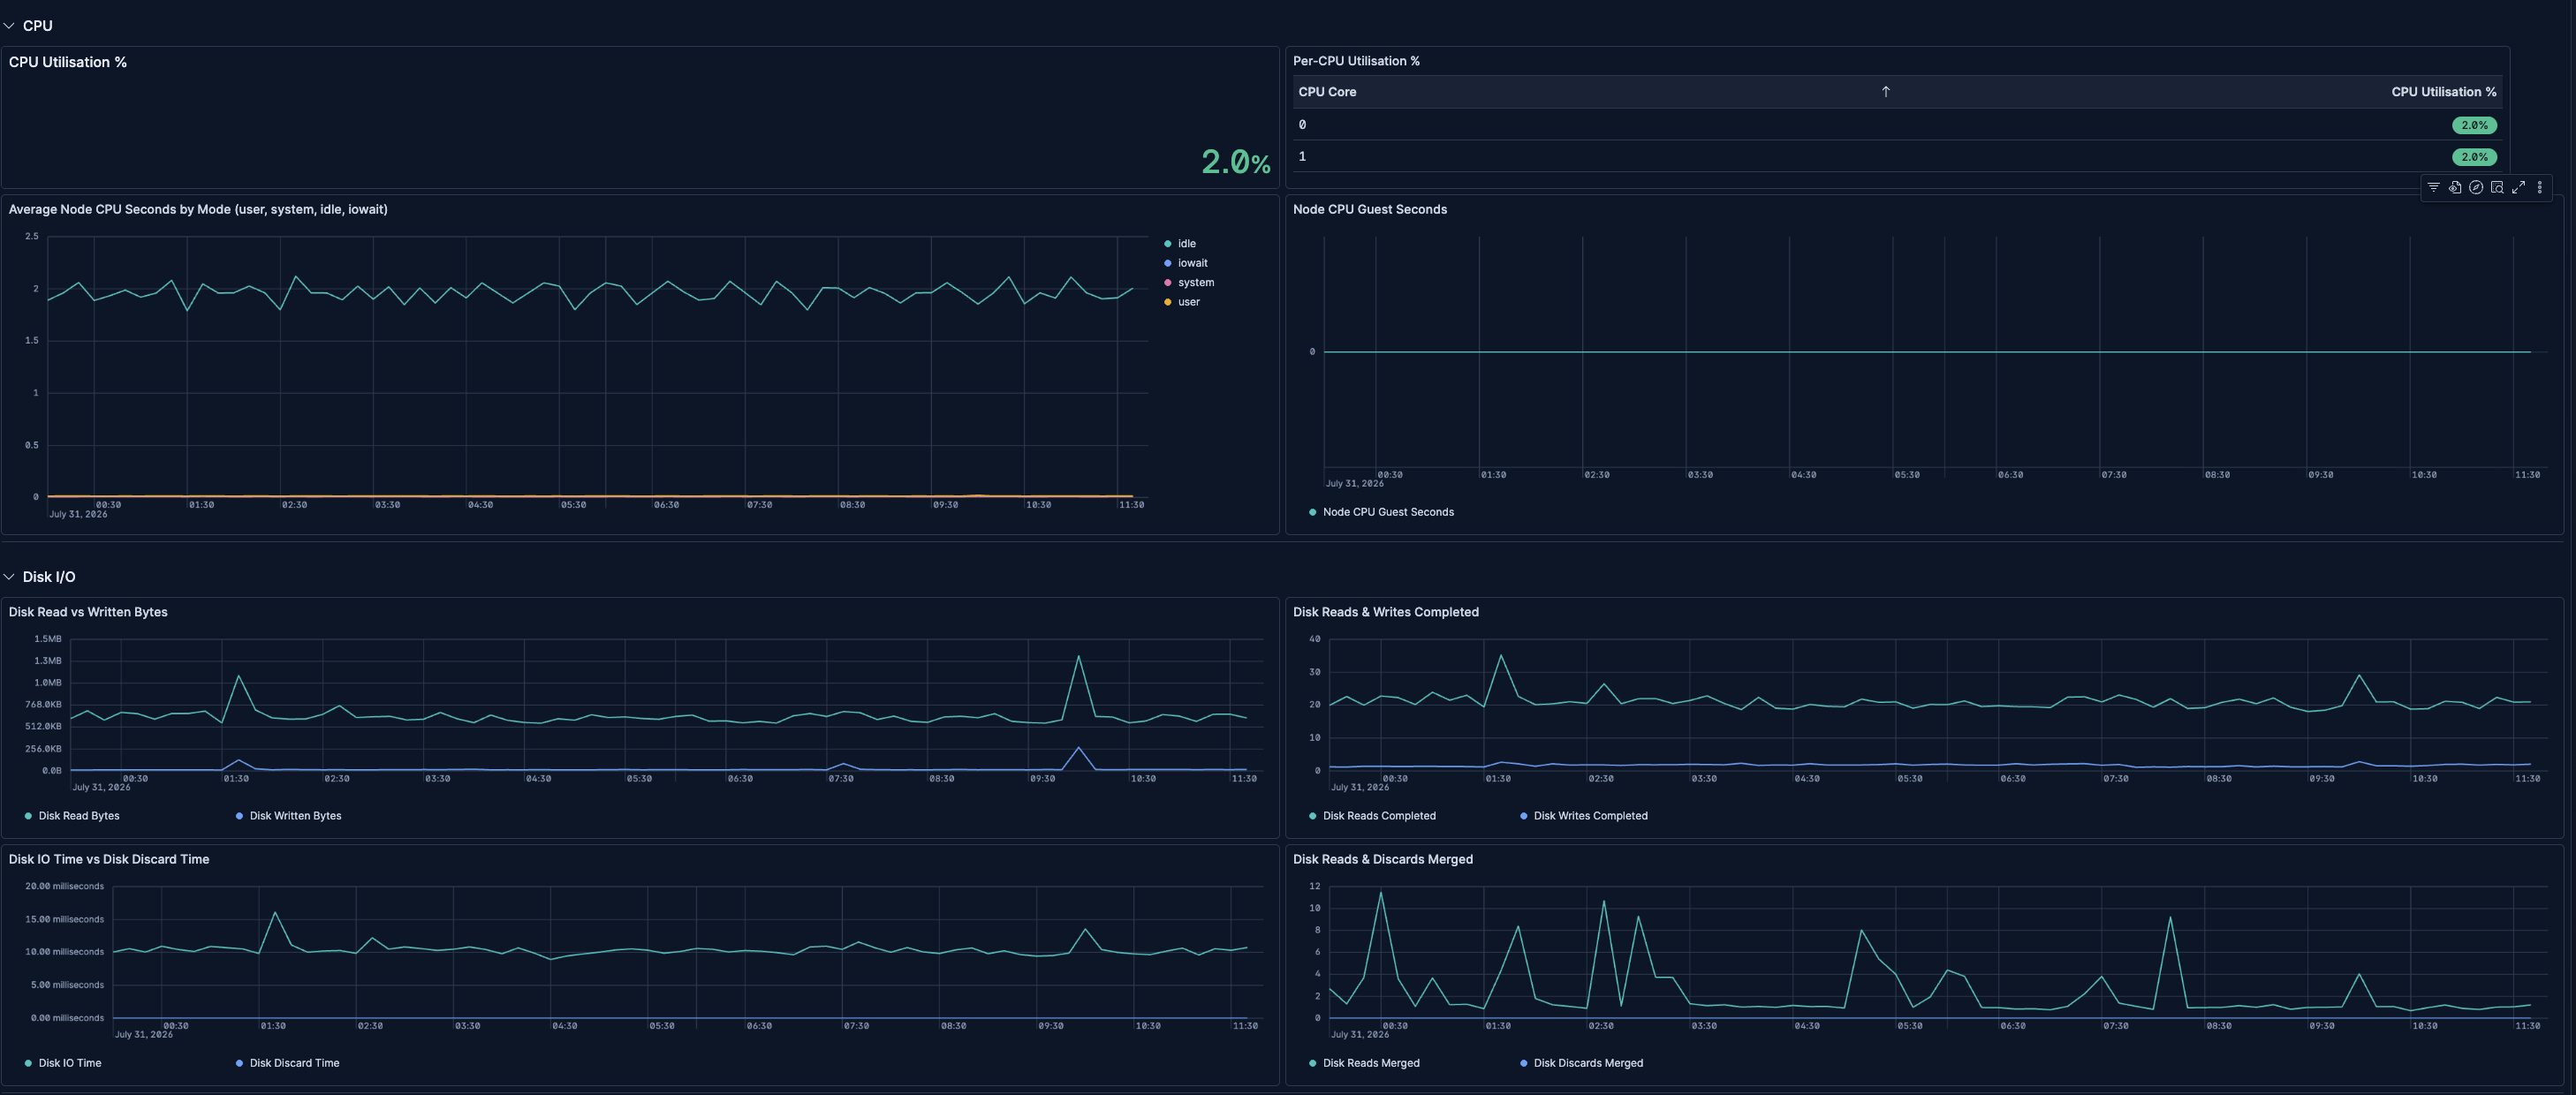
| **[Supabase OTel] Node & Infrastructure** | Node-level infrastructure metrics including CPU, memory, disk I/O, filesystem, and network. |
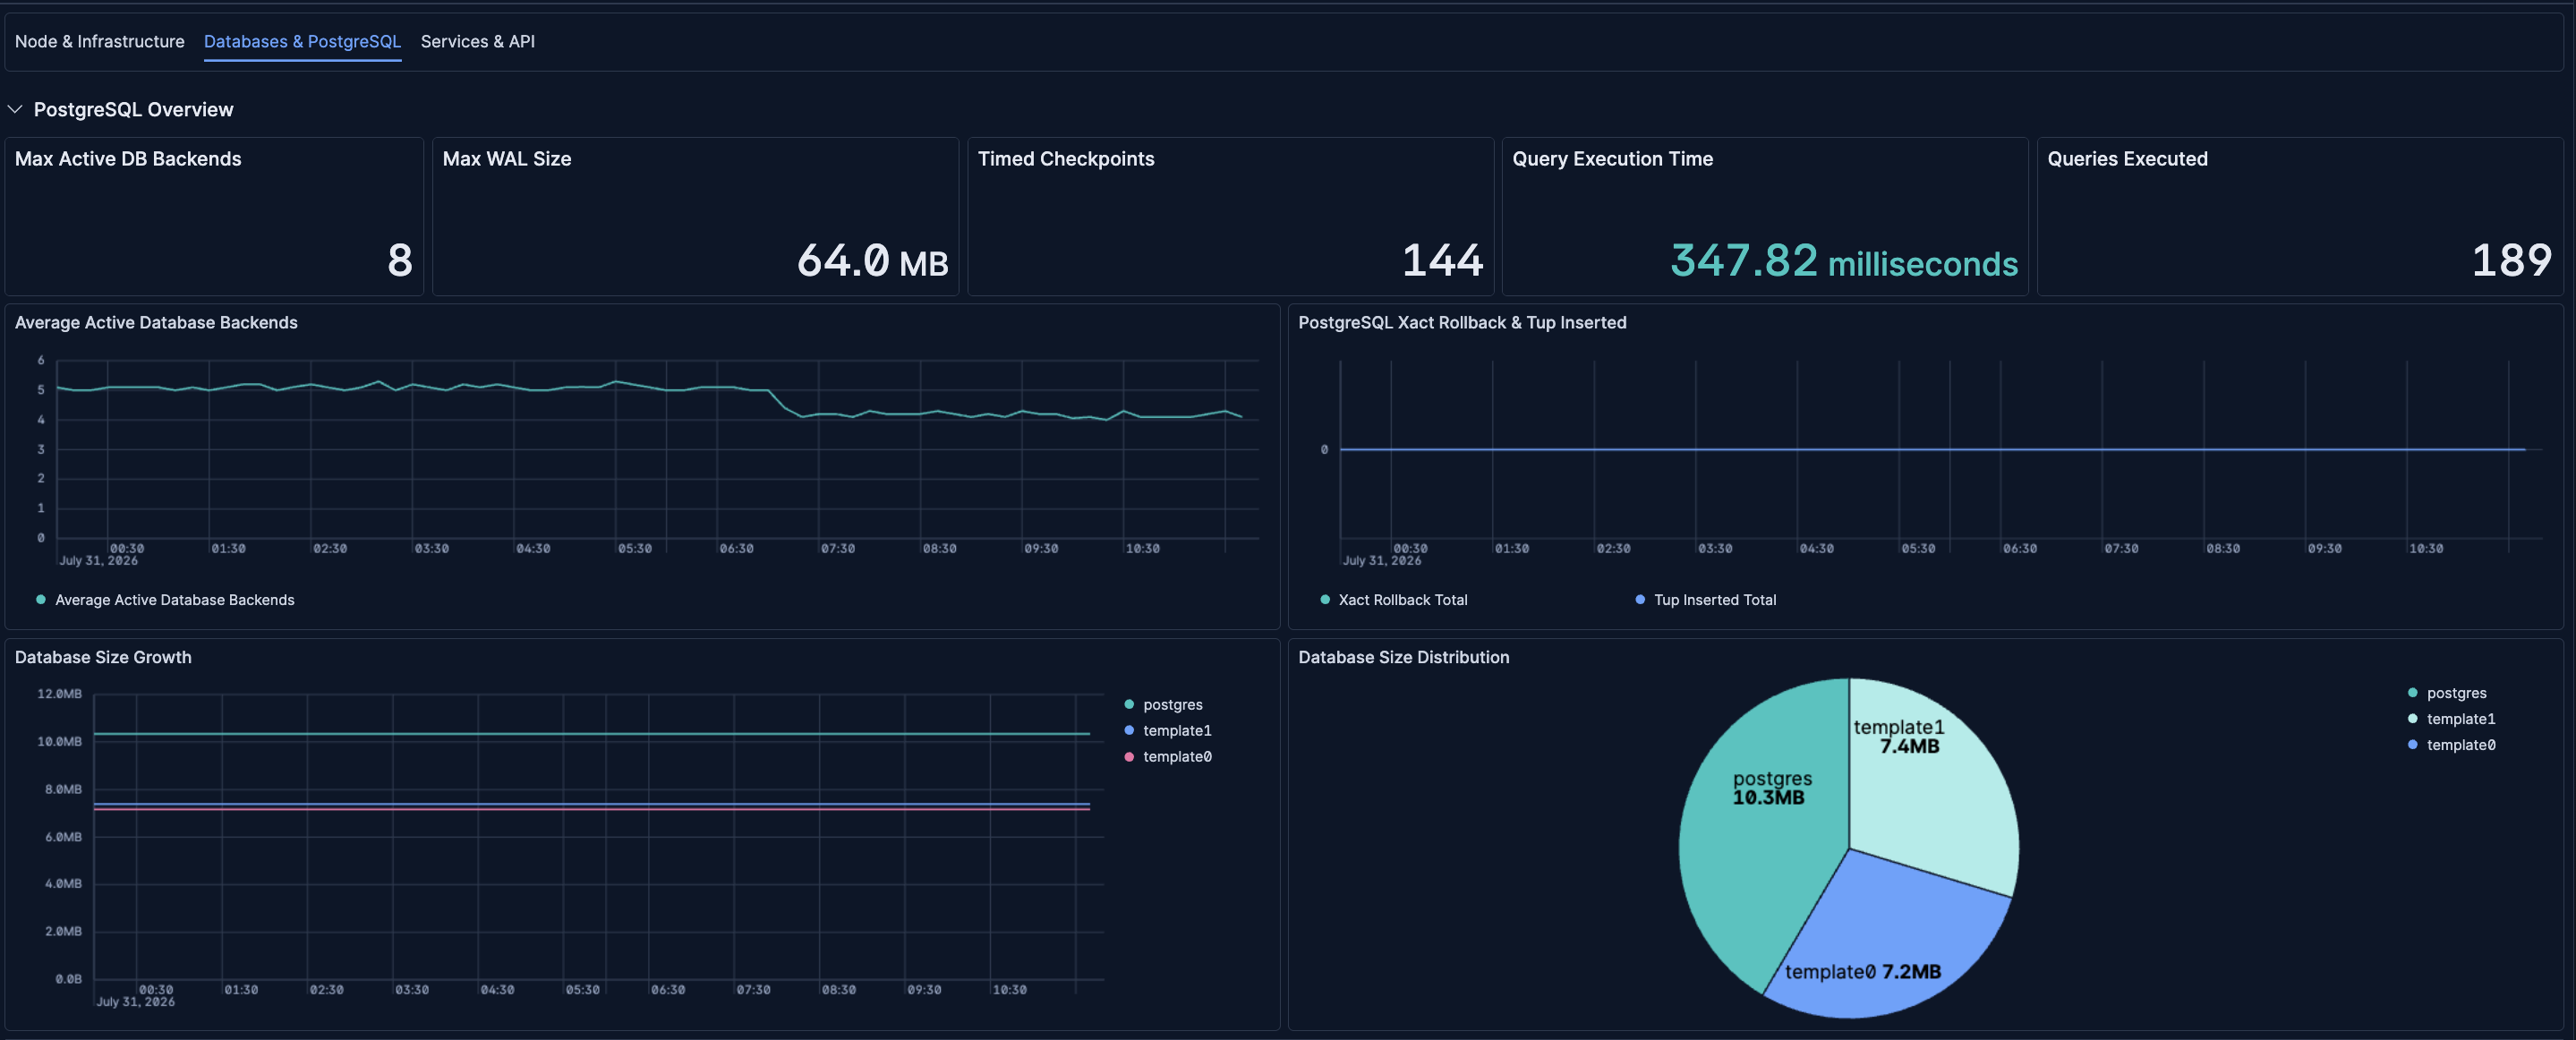
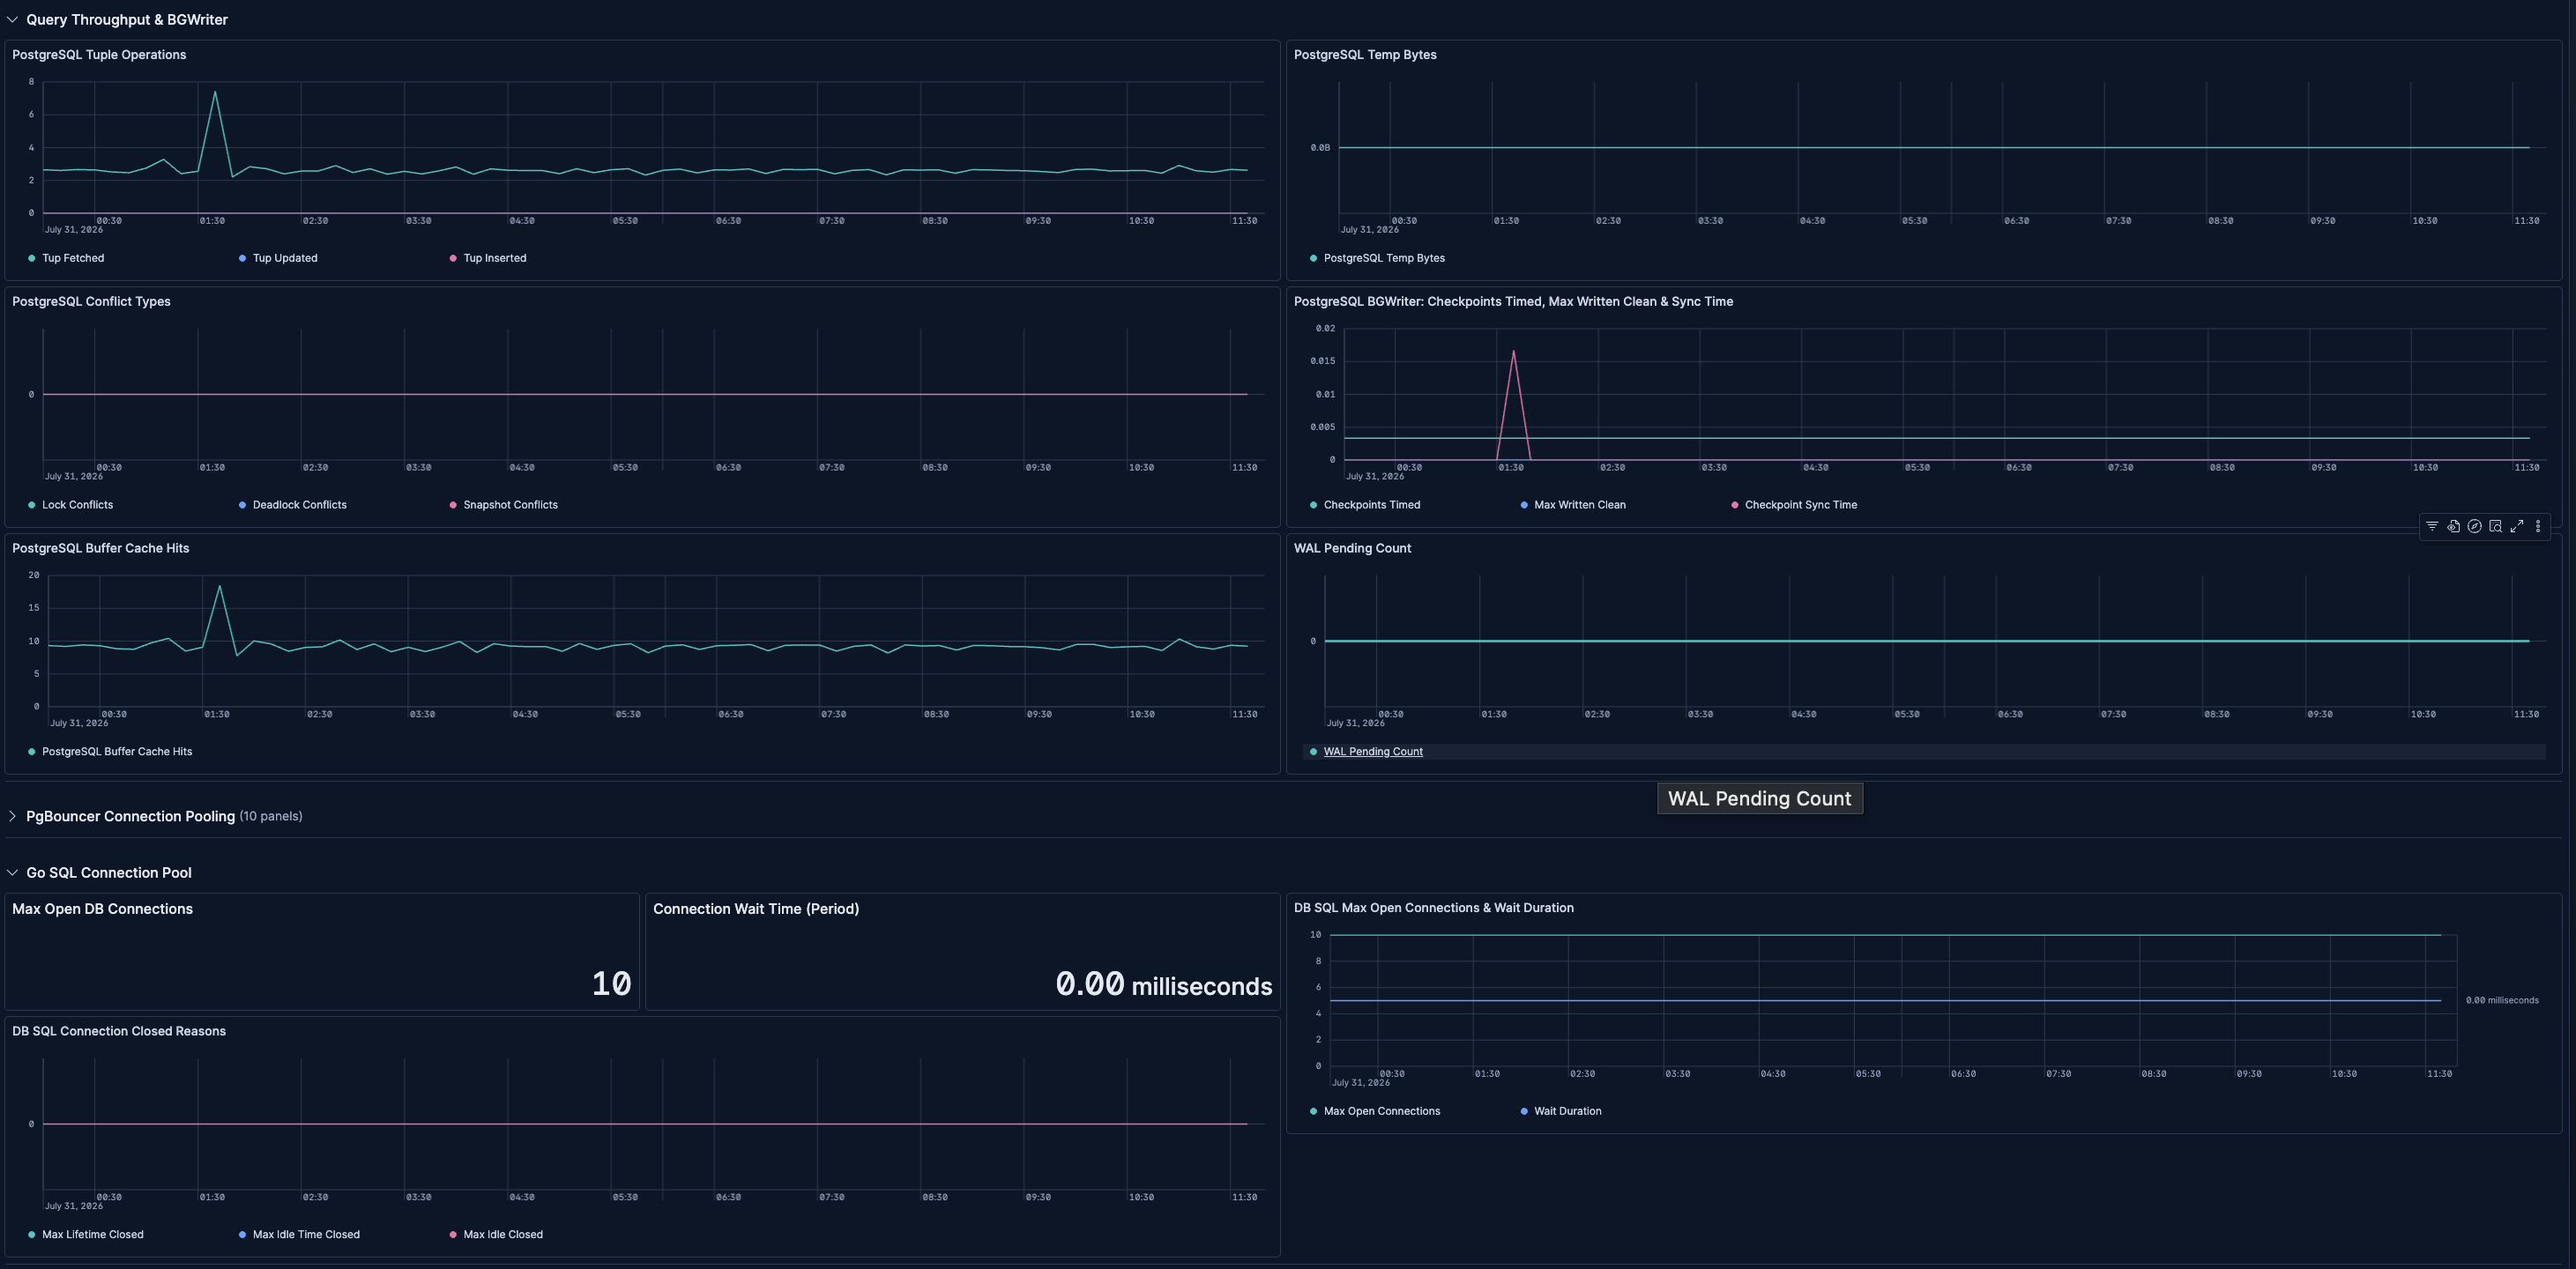
| **[Supabase OTel] Databases & PostgreSQL** | PostgreSQL internals, PgBouncer connection pooling, Go SQL connection pool, replication, and WAL. |
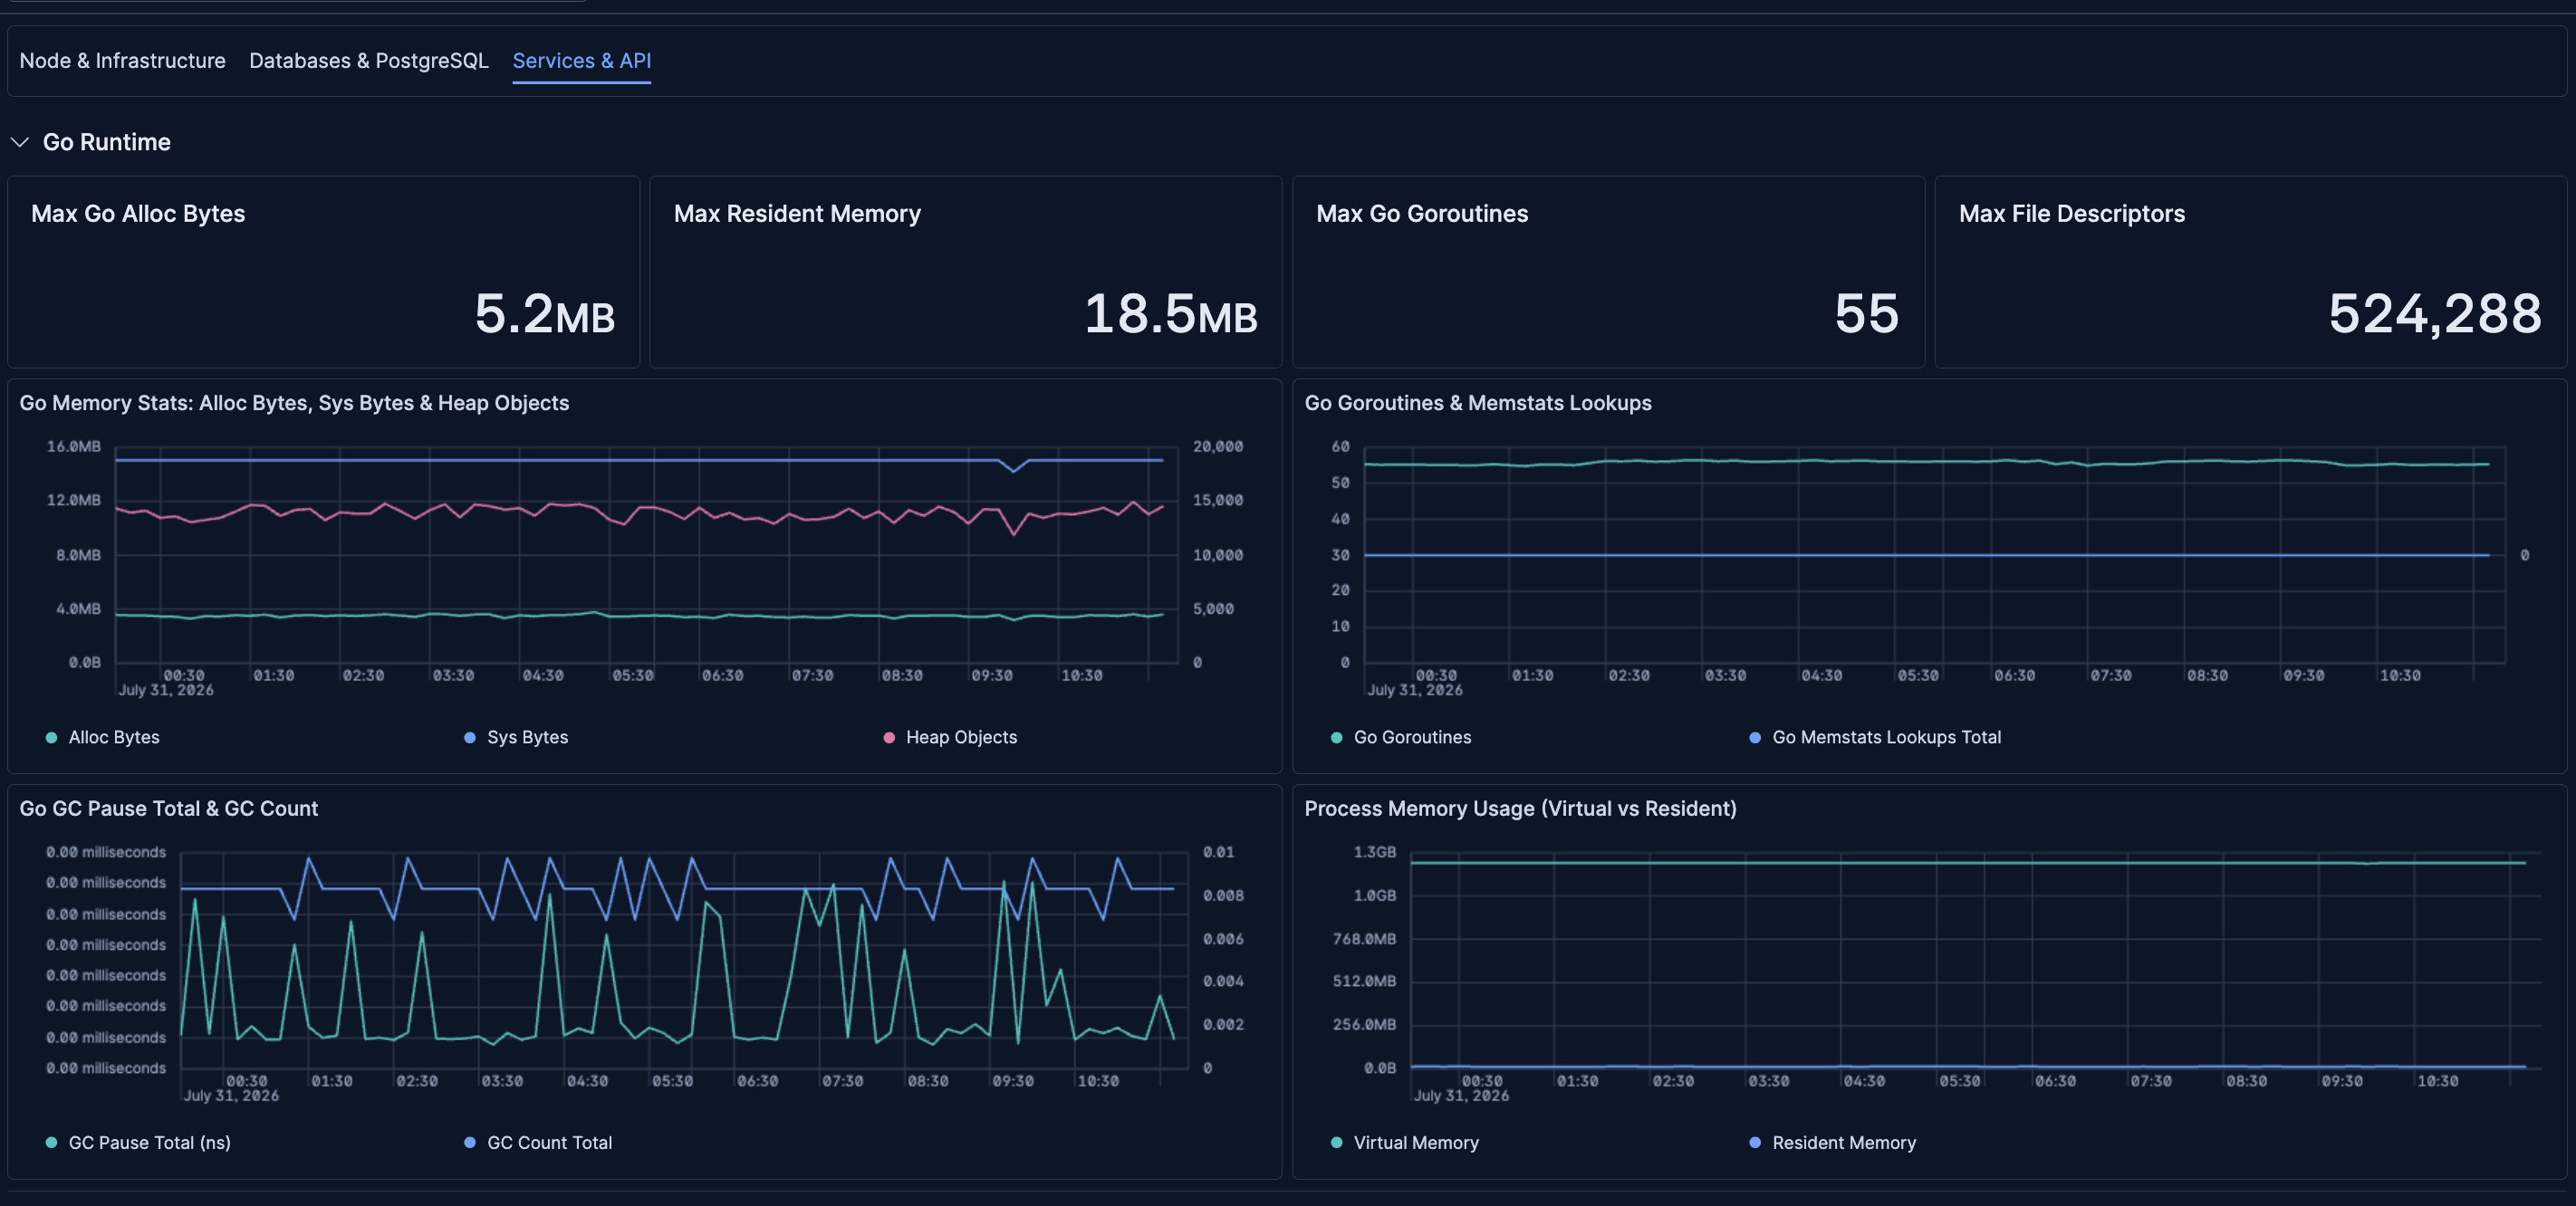
| **[Supabase OTel] Services & API** | Application service metrics for Auth (GoTrue), PostgREST, Realtime, and Go runtime. |
## Screenshots
This integration includes one or more Kibana dashboards that visualizes the data collected by the integration. The screenshots below illustrate how the ingested data is displayed.
## Changelog
| Version | Details | Minimum Kibana version |
|-----------|-----------------------------------------------------------------------------------------------------------------------------------------------------------------------|------------------------|
| **0.1.0** | **Enhancement** ([View pull request](https://github.com/elastic/integrations/pull/20265))Initial release of the Supabase content package with three Kibana dashboards | 9.4.0 |