---
title: Traefik OpenTelemetry Assets
description: Traefik is an open-source cloud-native application proxy and edge router that acts as the single entry point for incoming traffic, routing requests to...
url: https://docs-v3-preview.elastic.dev/elastic/integration-docs/tree/main/reference/traefik_otel
products:
- Elastic integrations
applies_to:
- Serverless Observability projects: Generally available
- Serverless Security projects: Generally available
- Elastic Stack: Generally available since 9.2
---
# Traefik OpenTelemetry Assets
| | |
|-------------------------------------------------------------------------------------------------------------------------------|----------------------------------------------------------------|
| **Version** | 0.1.0 : Beta ([View all](#changelog)) |
| **Subscription level**[What's this?](https://www.elastic.co/subscriptions) | Basic |
| **Developed by**[What's this?](https://docs-v3-preview.elastic.dev/elastic/integration-docs/tree/main/reference/developed-by) | Elastic |
| **Minimum Kibana version(s)** | 9.2.1 |
To use beta integrations, go to the **Integrations** page in Kibana, scroll down, and toggle on the _Display beta integrations_ option.
Traefik is an open-source cloud-native application proxy and edge router that acts as the single entry point for incoming traffic, routing requests to backend services based on configurable rules.
This content pack provides dashboards, alert rules, and SLO templates powered by the Prometheus receiver, covering proxy health, traffic flow, error rates, backend performance, TLS and configuration health, and process resource usage.
## Compatibility
The Traefik OpenTelemetry assets have been tested with OpenTelemetry Prometheus receiver v0.146.1.
Traefik tested against:
- Traefik v2.x, v3.x
## Requirements
You need Elasticsearch for storing and searching your data and Kibana for visualizing and managing it.
You can use our hosted Elasticsearch Service on Elastic Cloud, which is recommended, or self-manage
the Elastic Stack on your own hardware.
## Setup
### Prerequisites
Enable Traefik's Prometheus metrics endpoint. Traefik exposes metrics on a dedicated entrypoint (typically `traefik` on port 8080). Configure the metrics in your static configuration:
```yaml
# Enable Prometheus metrics
metrics:
prometheus:
addEntryPointsLabels: true
addRoutersLabels: true
addServicesLabels: true
entryPoint: traefik
```
If using the Docker provider, ensure the `traefik` entrypoint is exposed. Verify metrics are available:
```bash
curl http:///metrics
```
### Configuration
Configure the OpenTelemetry Collector (or Elastic Distribution of OpenTelemetry Collector) to scrape Traefik's Prometheus endpoint and export to Elasticsearch. Ensure the Prometheus receiver, `resourcedetection`, `cumulativetodelta`, and `resource` processors are available.
Placeholder reference:
| Placeholder | Description | Example |
|--------------------------|----------------------------------------------|------------------------------------------------------------|
| `` | Host and port of Traefik's metrics endpoint | `traefik:8080` |
| `` | Elasticsearch endpoint for the OTel exporter | `https://my-deployment.es.us-central1.gcp.cloud.es.io:443` |
| `${env:ES_API_KEY}` | Elasticsearch API key (store in environment) | — |
```yaml
receivers:
prometheus:
config:
scrape_configs:
- job_name: traefik
scrape_interval: 15s
metrics_path: /metrics
static_configs:
- targets: ['']
labels:
host: traefik
processors:
resourcedetection/system:
detectors: ['hostname']
# Required for Traefik request-duration histograms: the Prometheus receiver emits cumulative-temporality histograms,
# but the Elasticsearch exporter in `otel` mapping mode expects delta-temporality histograms.
# Without this, you’ll see logs like "dropping cumulative temporality histogram traefik_*_request_duration_seconds".
cumulativetodelta:
include:
match_type: regexp
metrics: ['traefik_.*', 'go_.*', 'process_.*']
# Ensures metrics land in the dataset this package’s dashboards/alerts expect.
# Sets `data_stream.dataset=traefik` (upsert); the Elasticsearch exporter appends `.otel`, so it becomes `traefik.otel`.
resource/dataset:
attributes:
- key: data_stream.dataset
value: traefik
action: upsert
exporters:
elasticsearch/otel:
endpoints: ['']
api_key: ${env:ES_API_KEY}
mapping:
mode: otel
service:
pipelines:
metrics:
receivers: [prometheus]
processors: [resourcedetection/system, cumulativetodelta, resource/dataset]
exporters: [elasticsearch/otel]
```
## Reference
### Metrics
Refer to the [metadata.yaml](https://github.com/open-telemetry/opentelemetry-collector-contrib/blob/main/receiver/prometheusreceiver/metadata.yaml)
of the OpenTelemetry Prometheus receiver for details on the receiver. For the authoritative Traefik metric specification (metric names, types, and labels) exposed at `/metrics`, refer to Traefik's [Prometheus metrics documentation](https://doc.traefik.io/traefik/observability/metrics/prometheus/). Traefik metrics include entrypoint, router, service, and global metrics (request counts, duration histograms, open connections, TLS certificate expiry, configuration reload counts, and Go runtime metrics).
## Dashboards
| Dashboard | Description |
|---------------------------------|----------------------------------------------------------------------------------------------------------------|
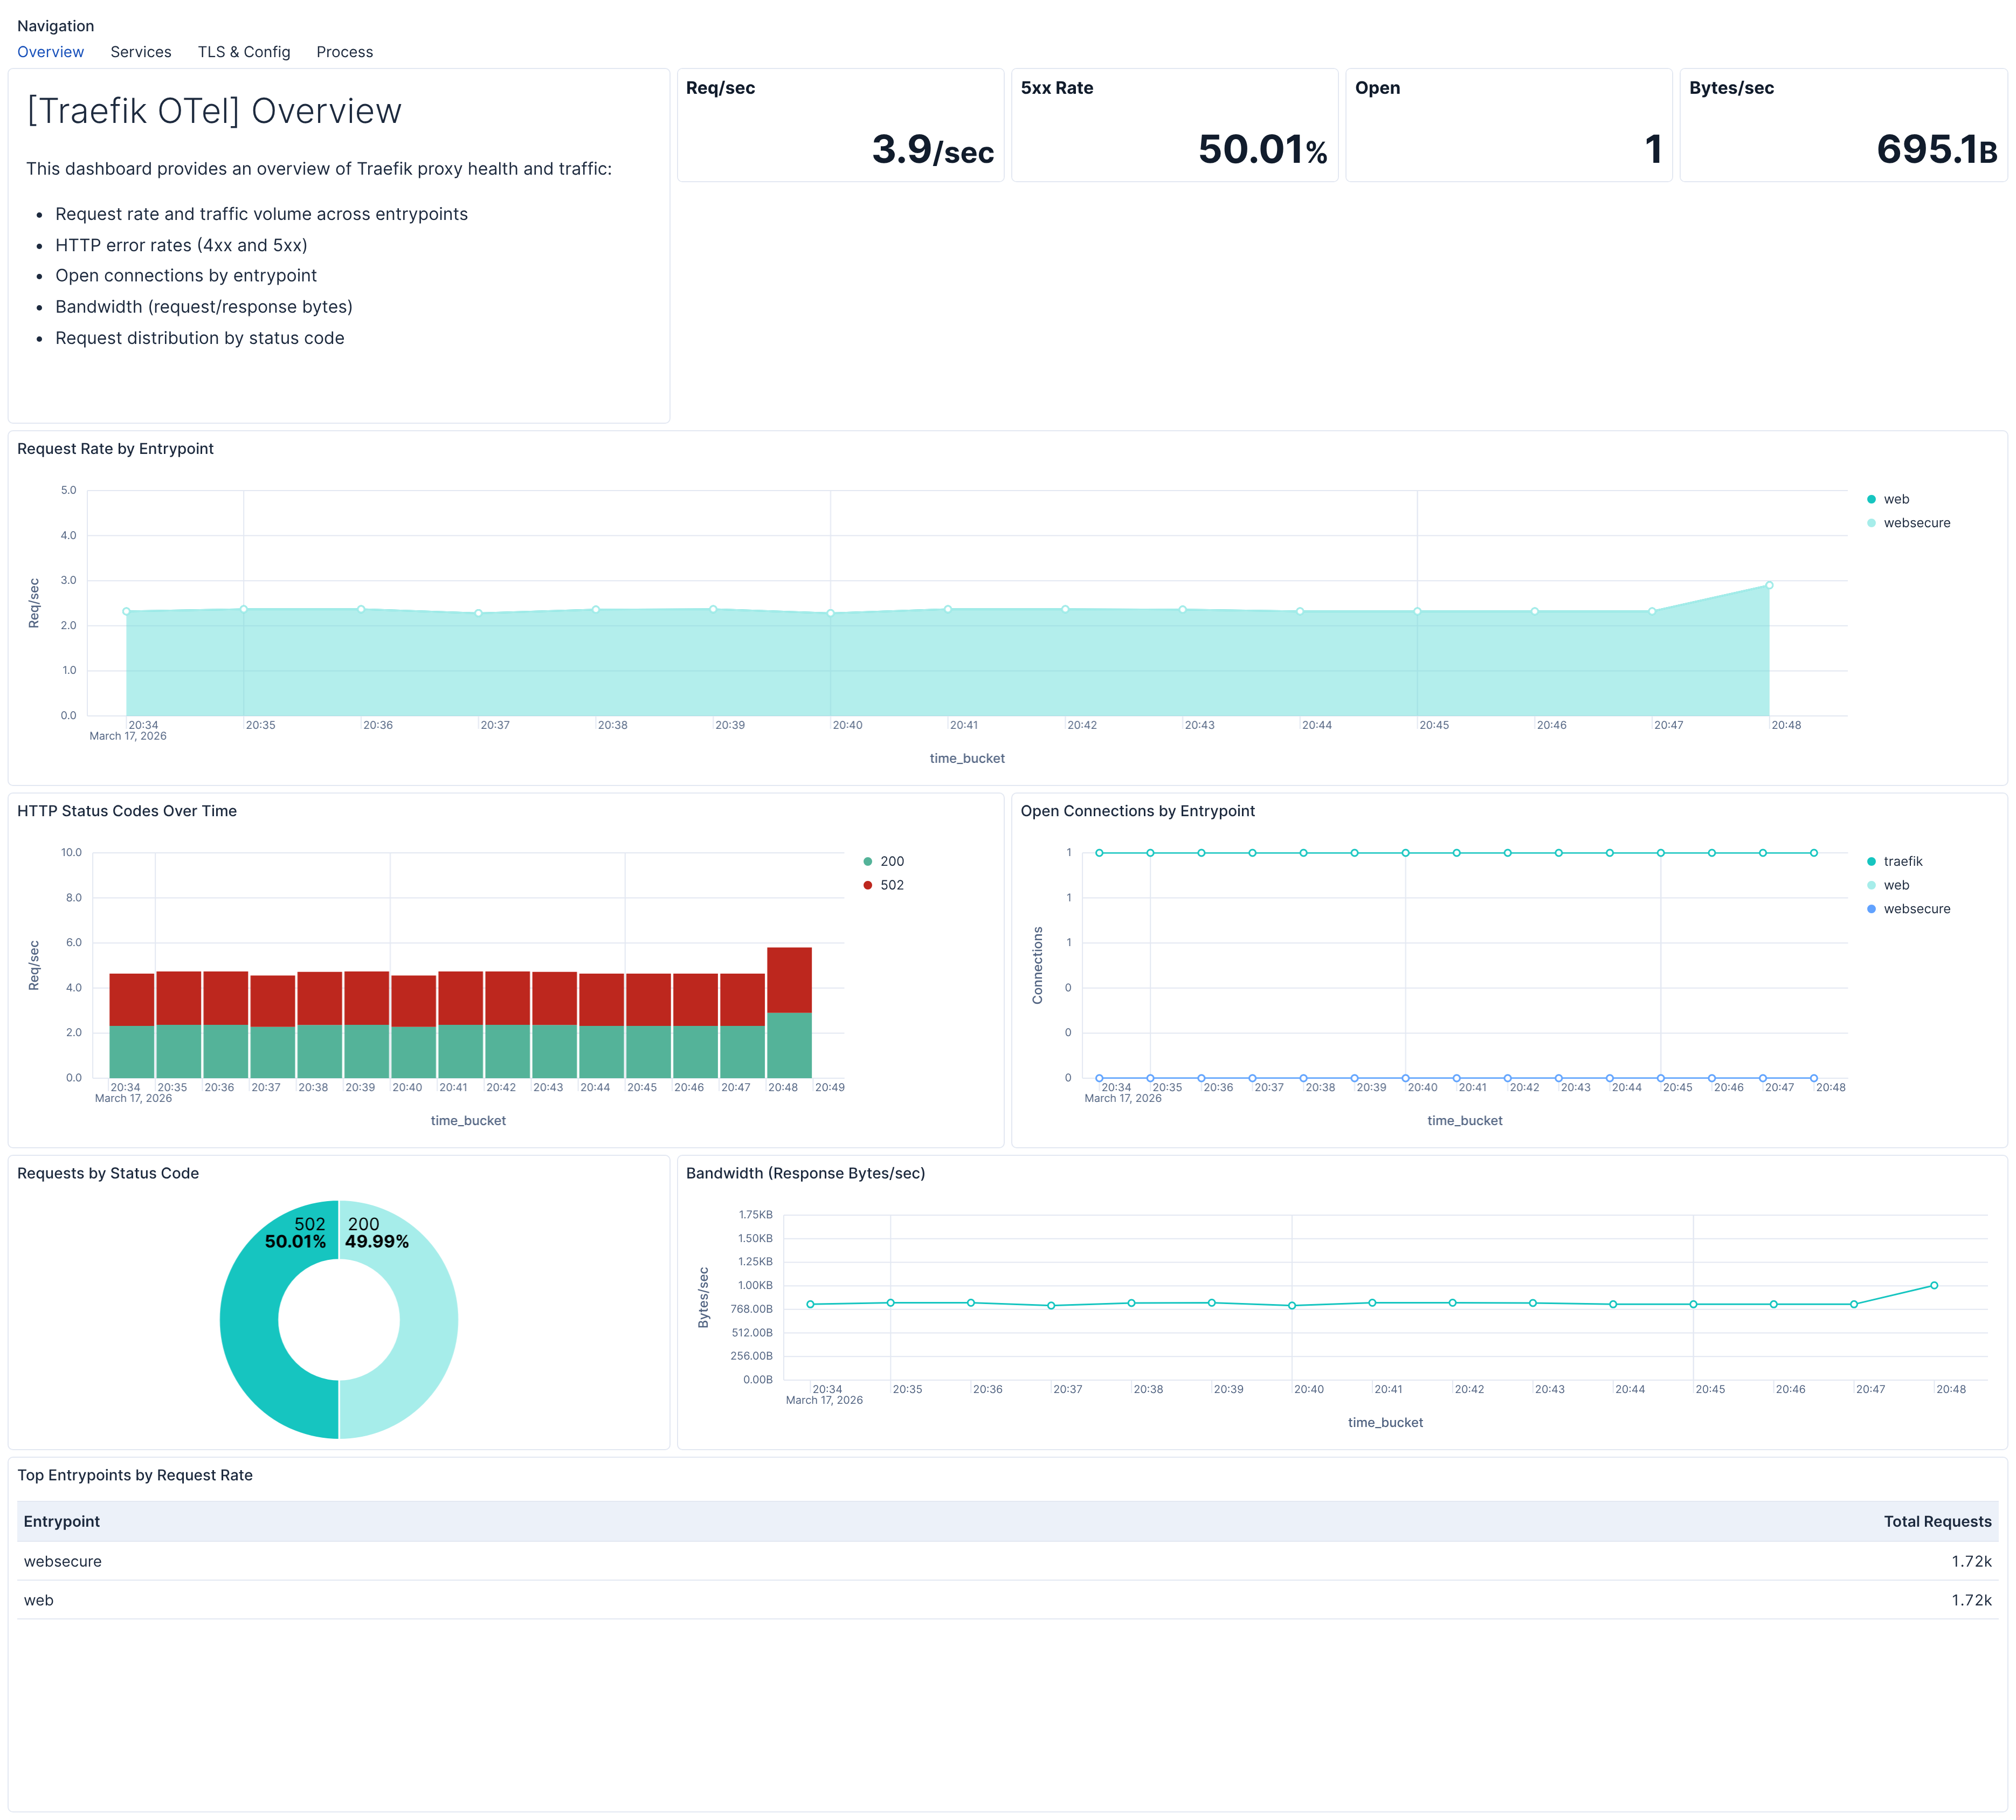
| **[Traefik OTel] Overview** | High-level Traefik proxy health and traffic flow: request rates, error rates, open connections, and bandwidth. |
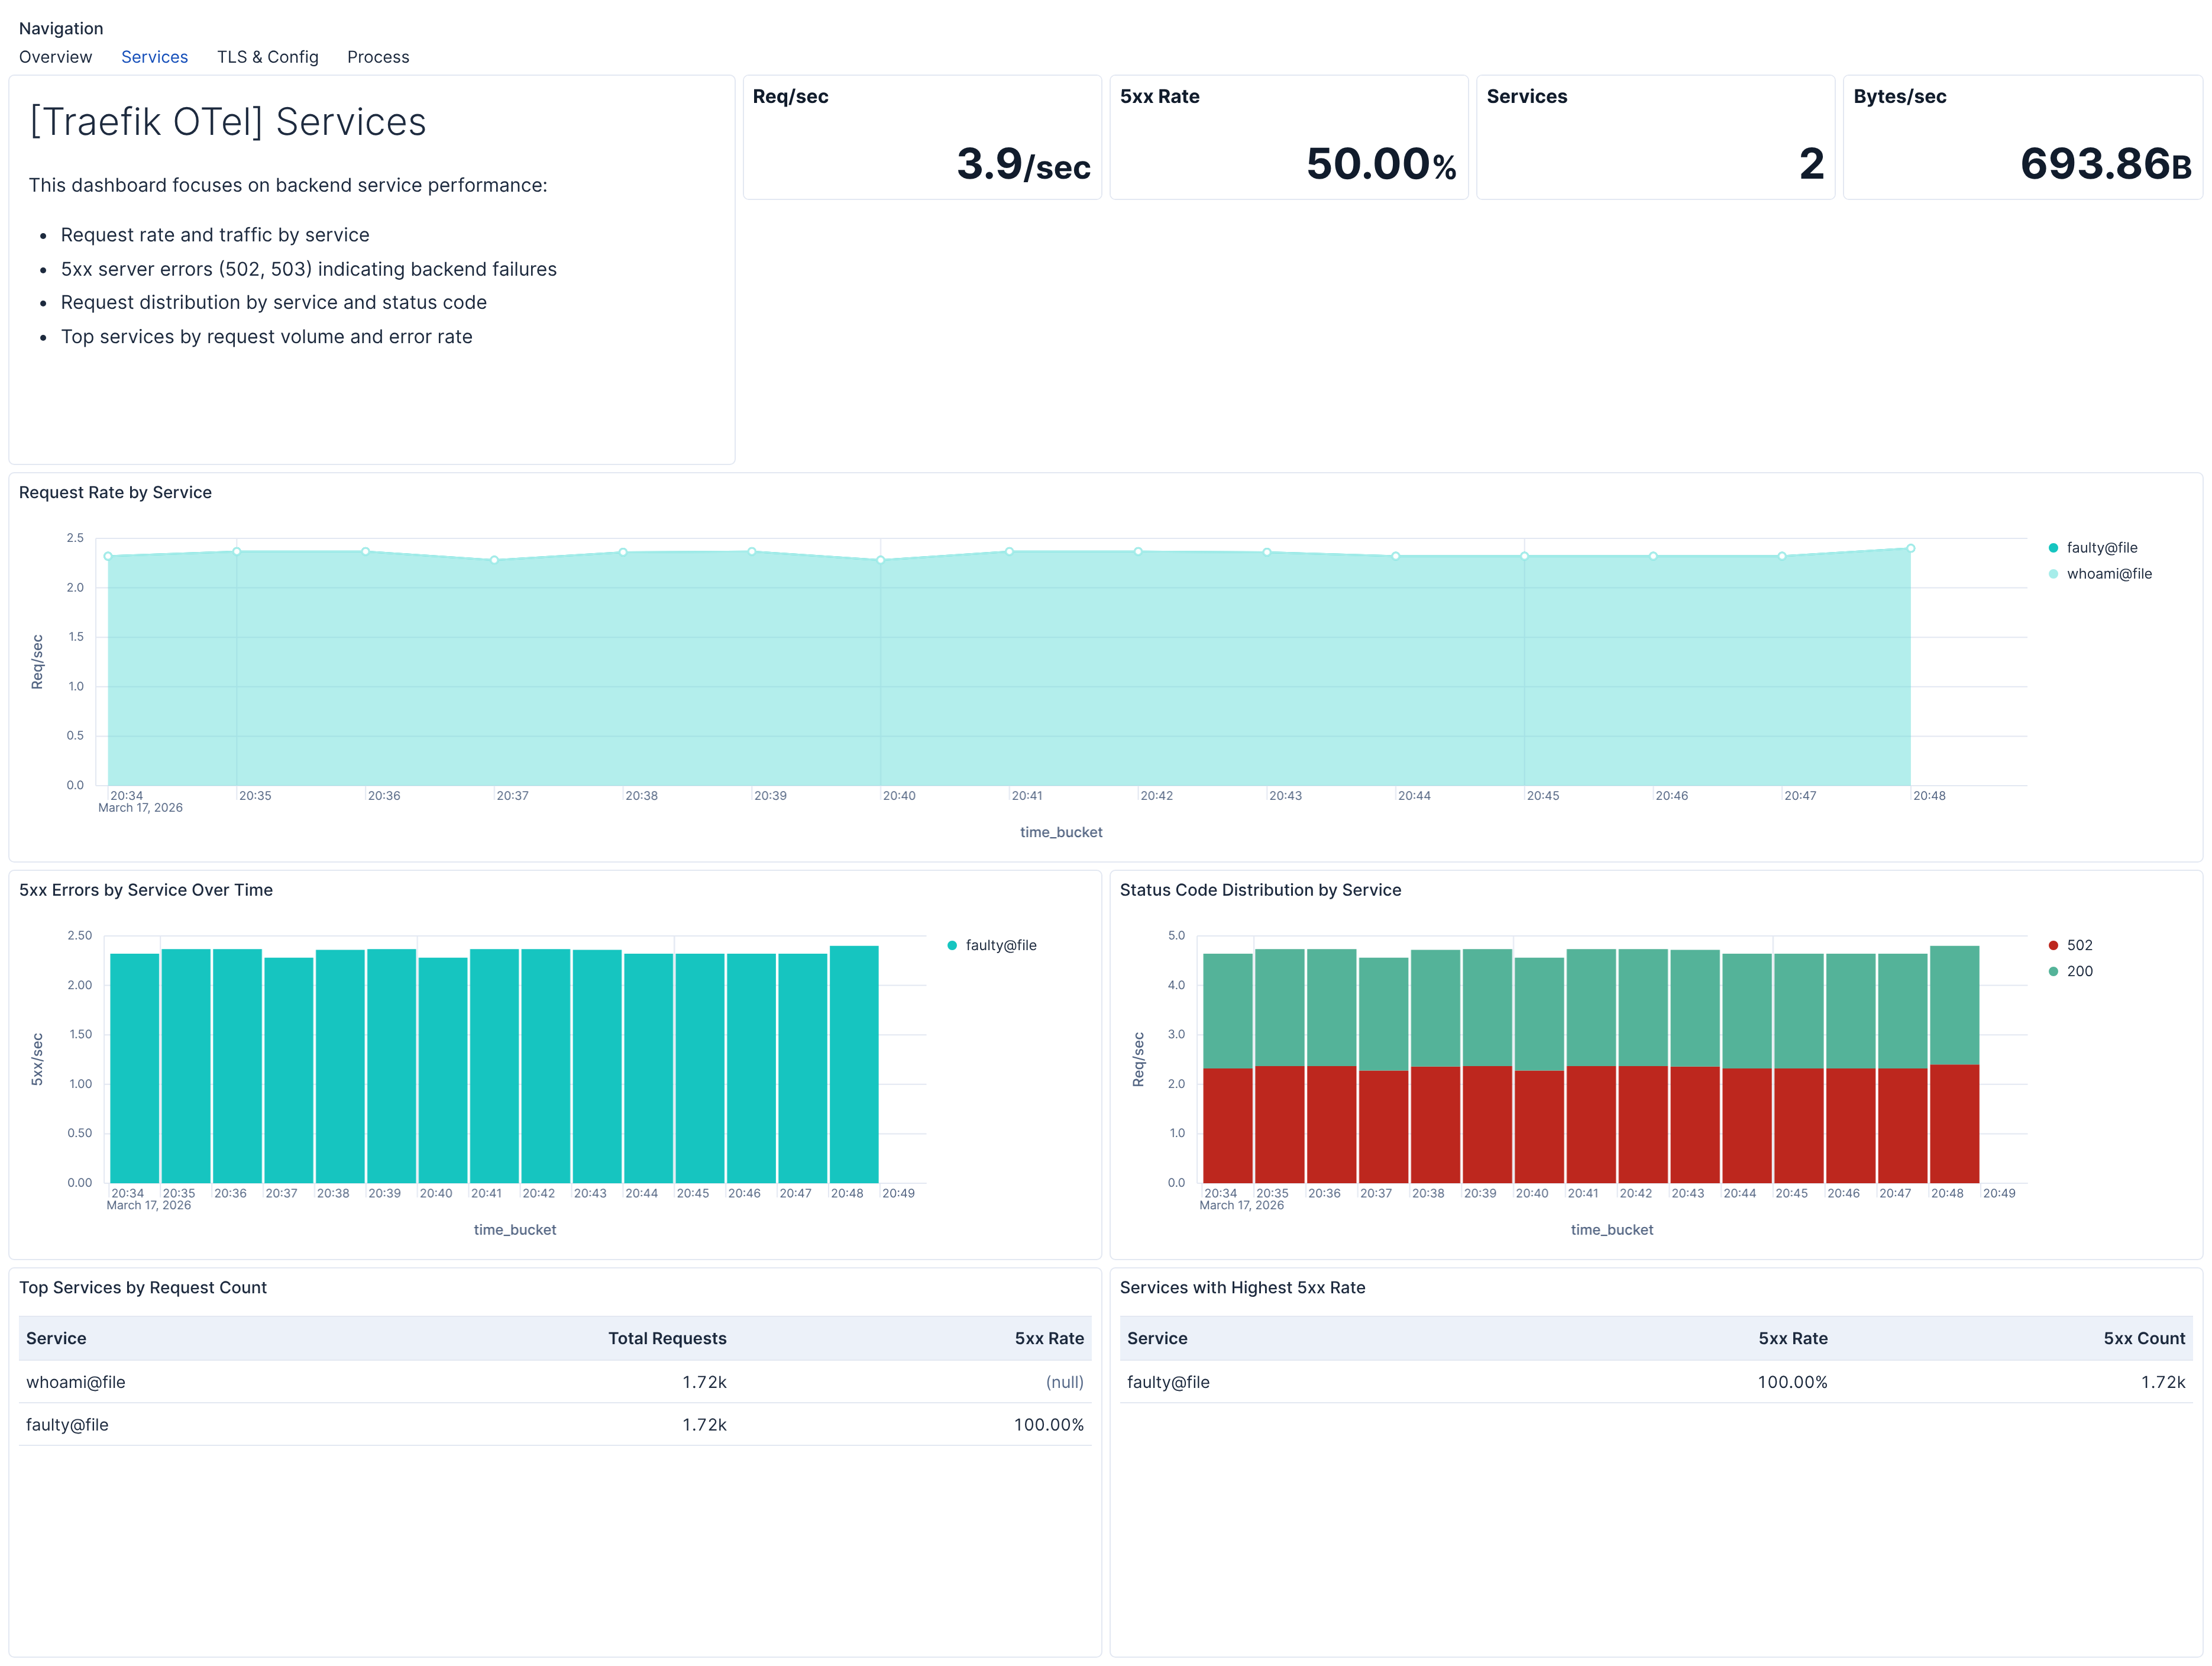
| **[Traefik OTel] Services** | Backend service traffic, error rates, and performance for identifying failing backends. |
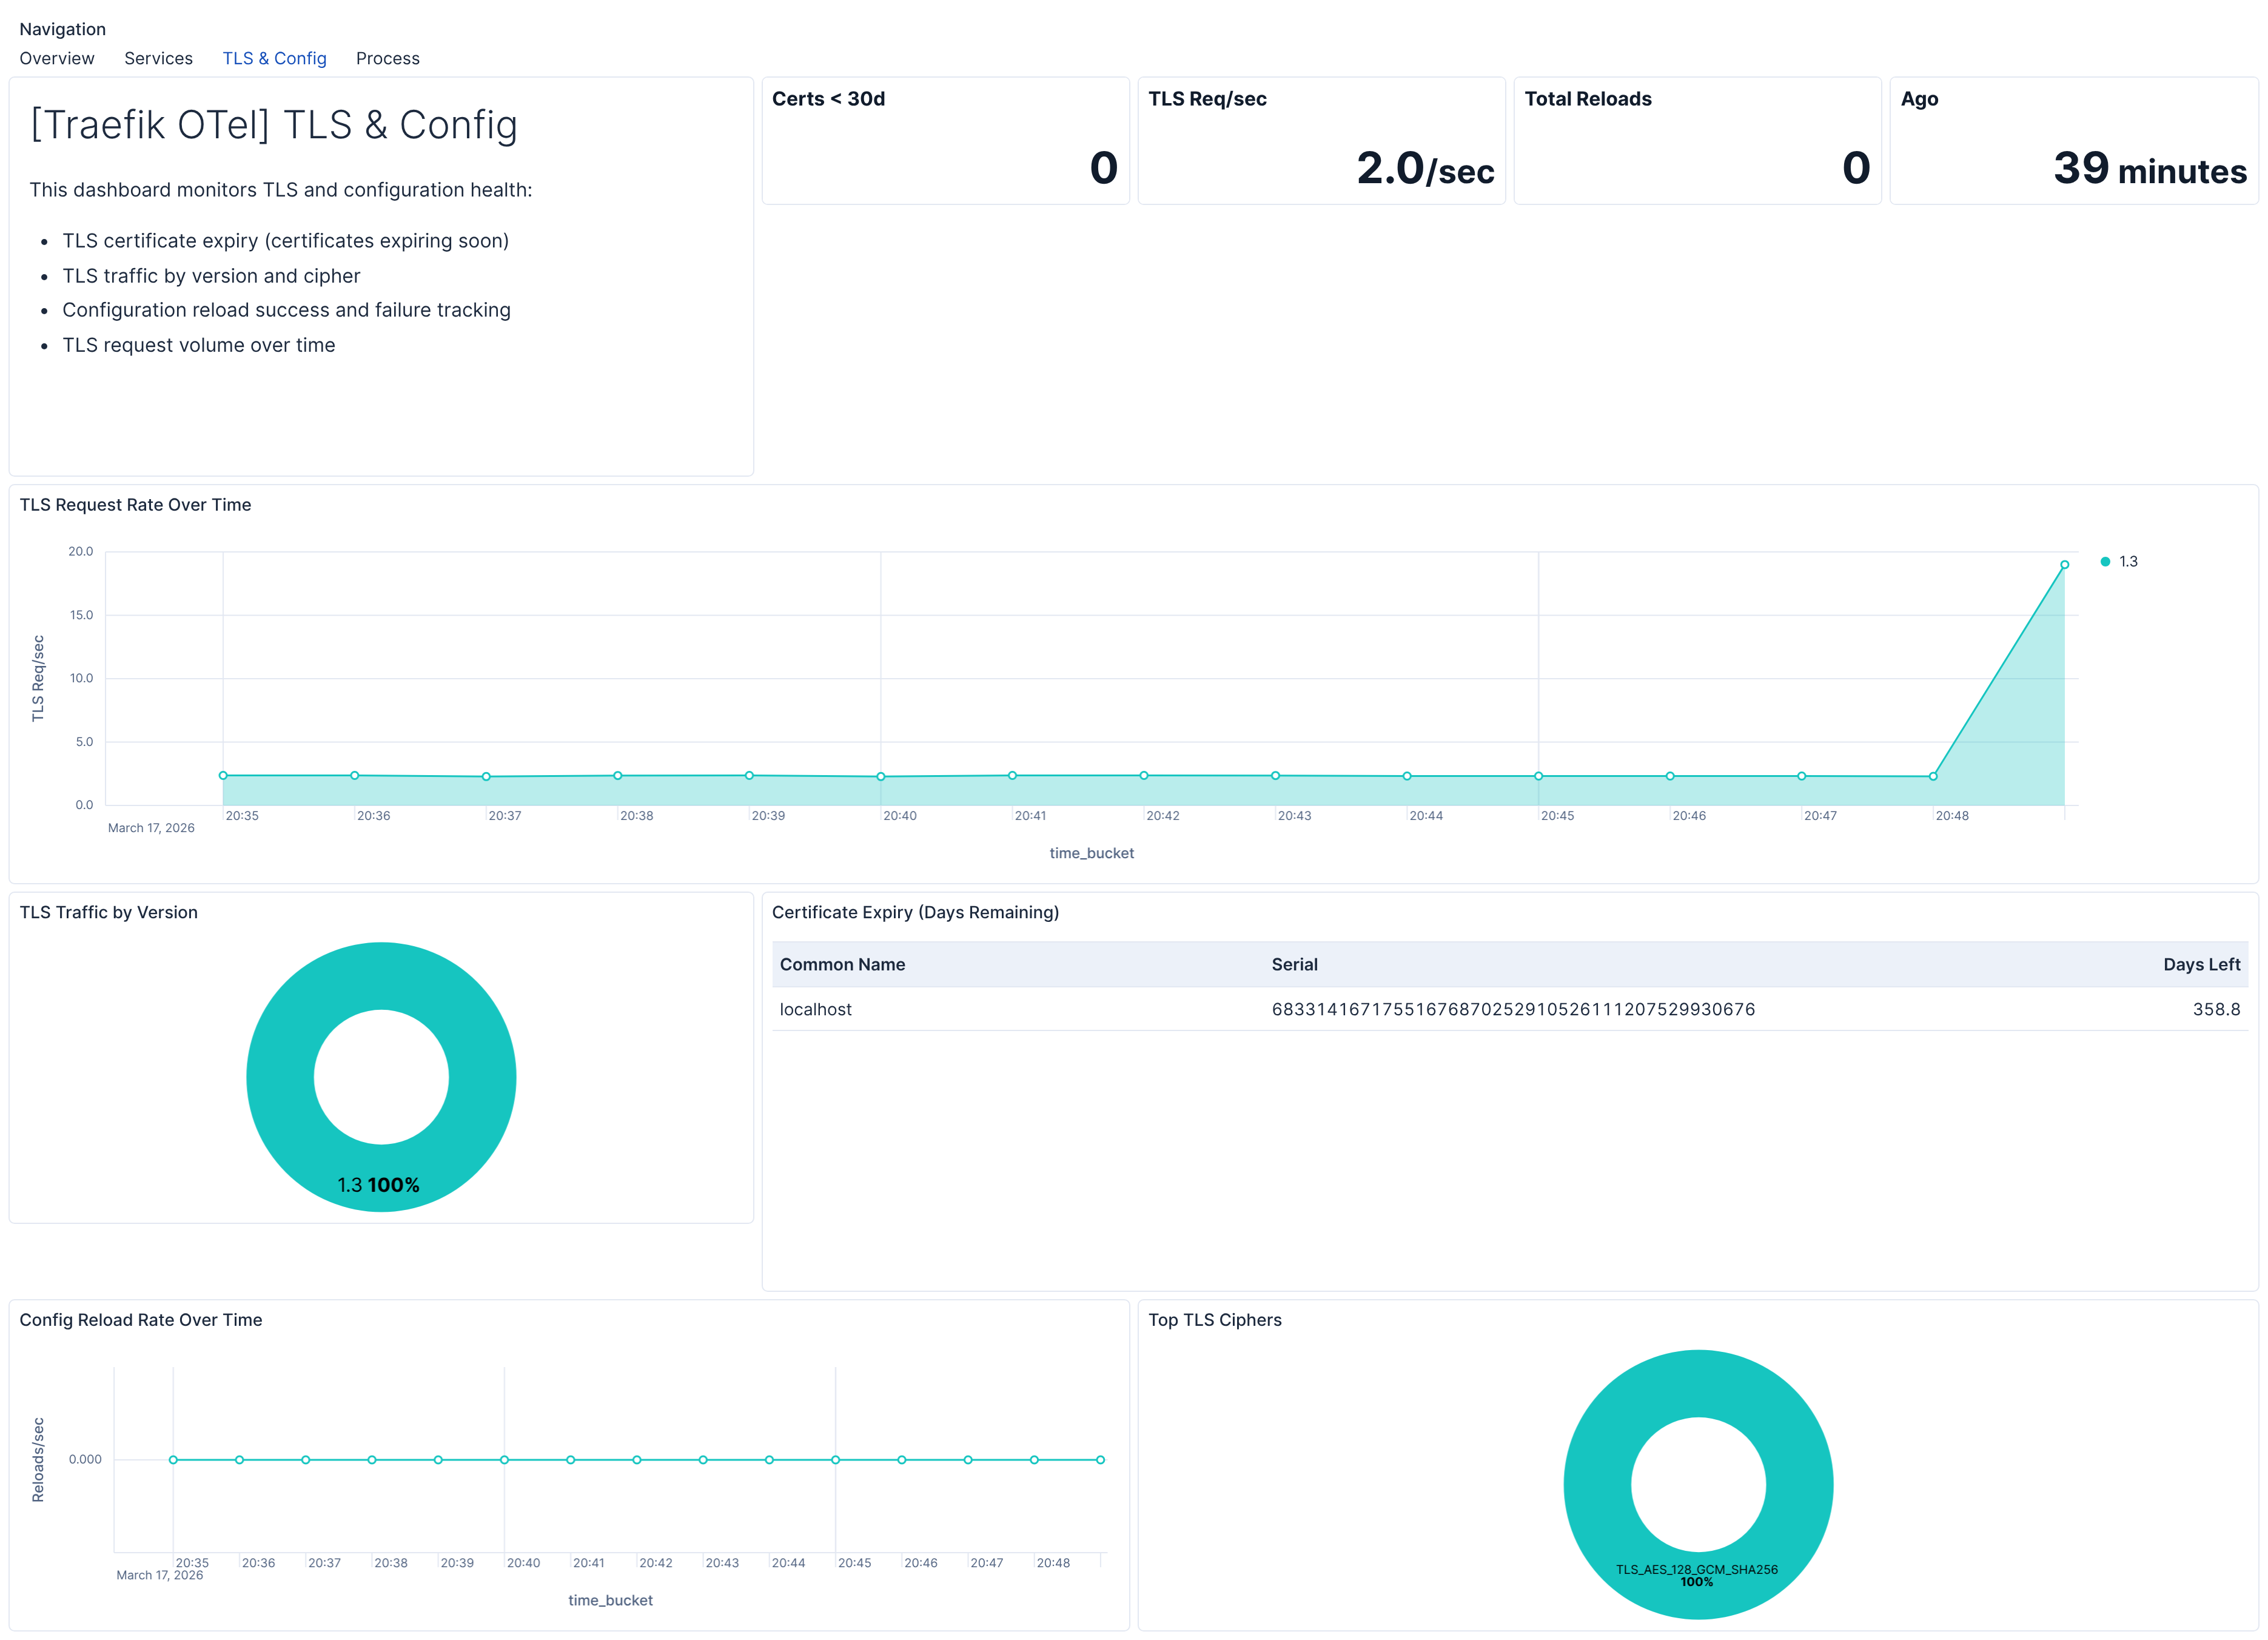
| **[Traefik OTel] TLS & Config** | TLS certificate expiry, TLS traffic distribution, and configuration reload health. |
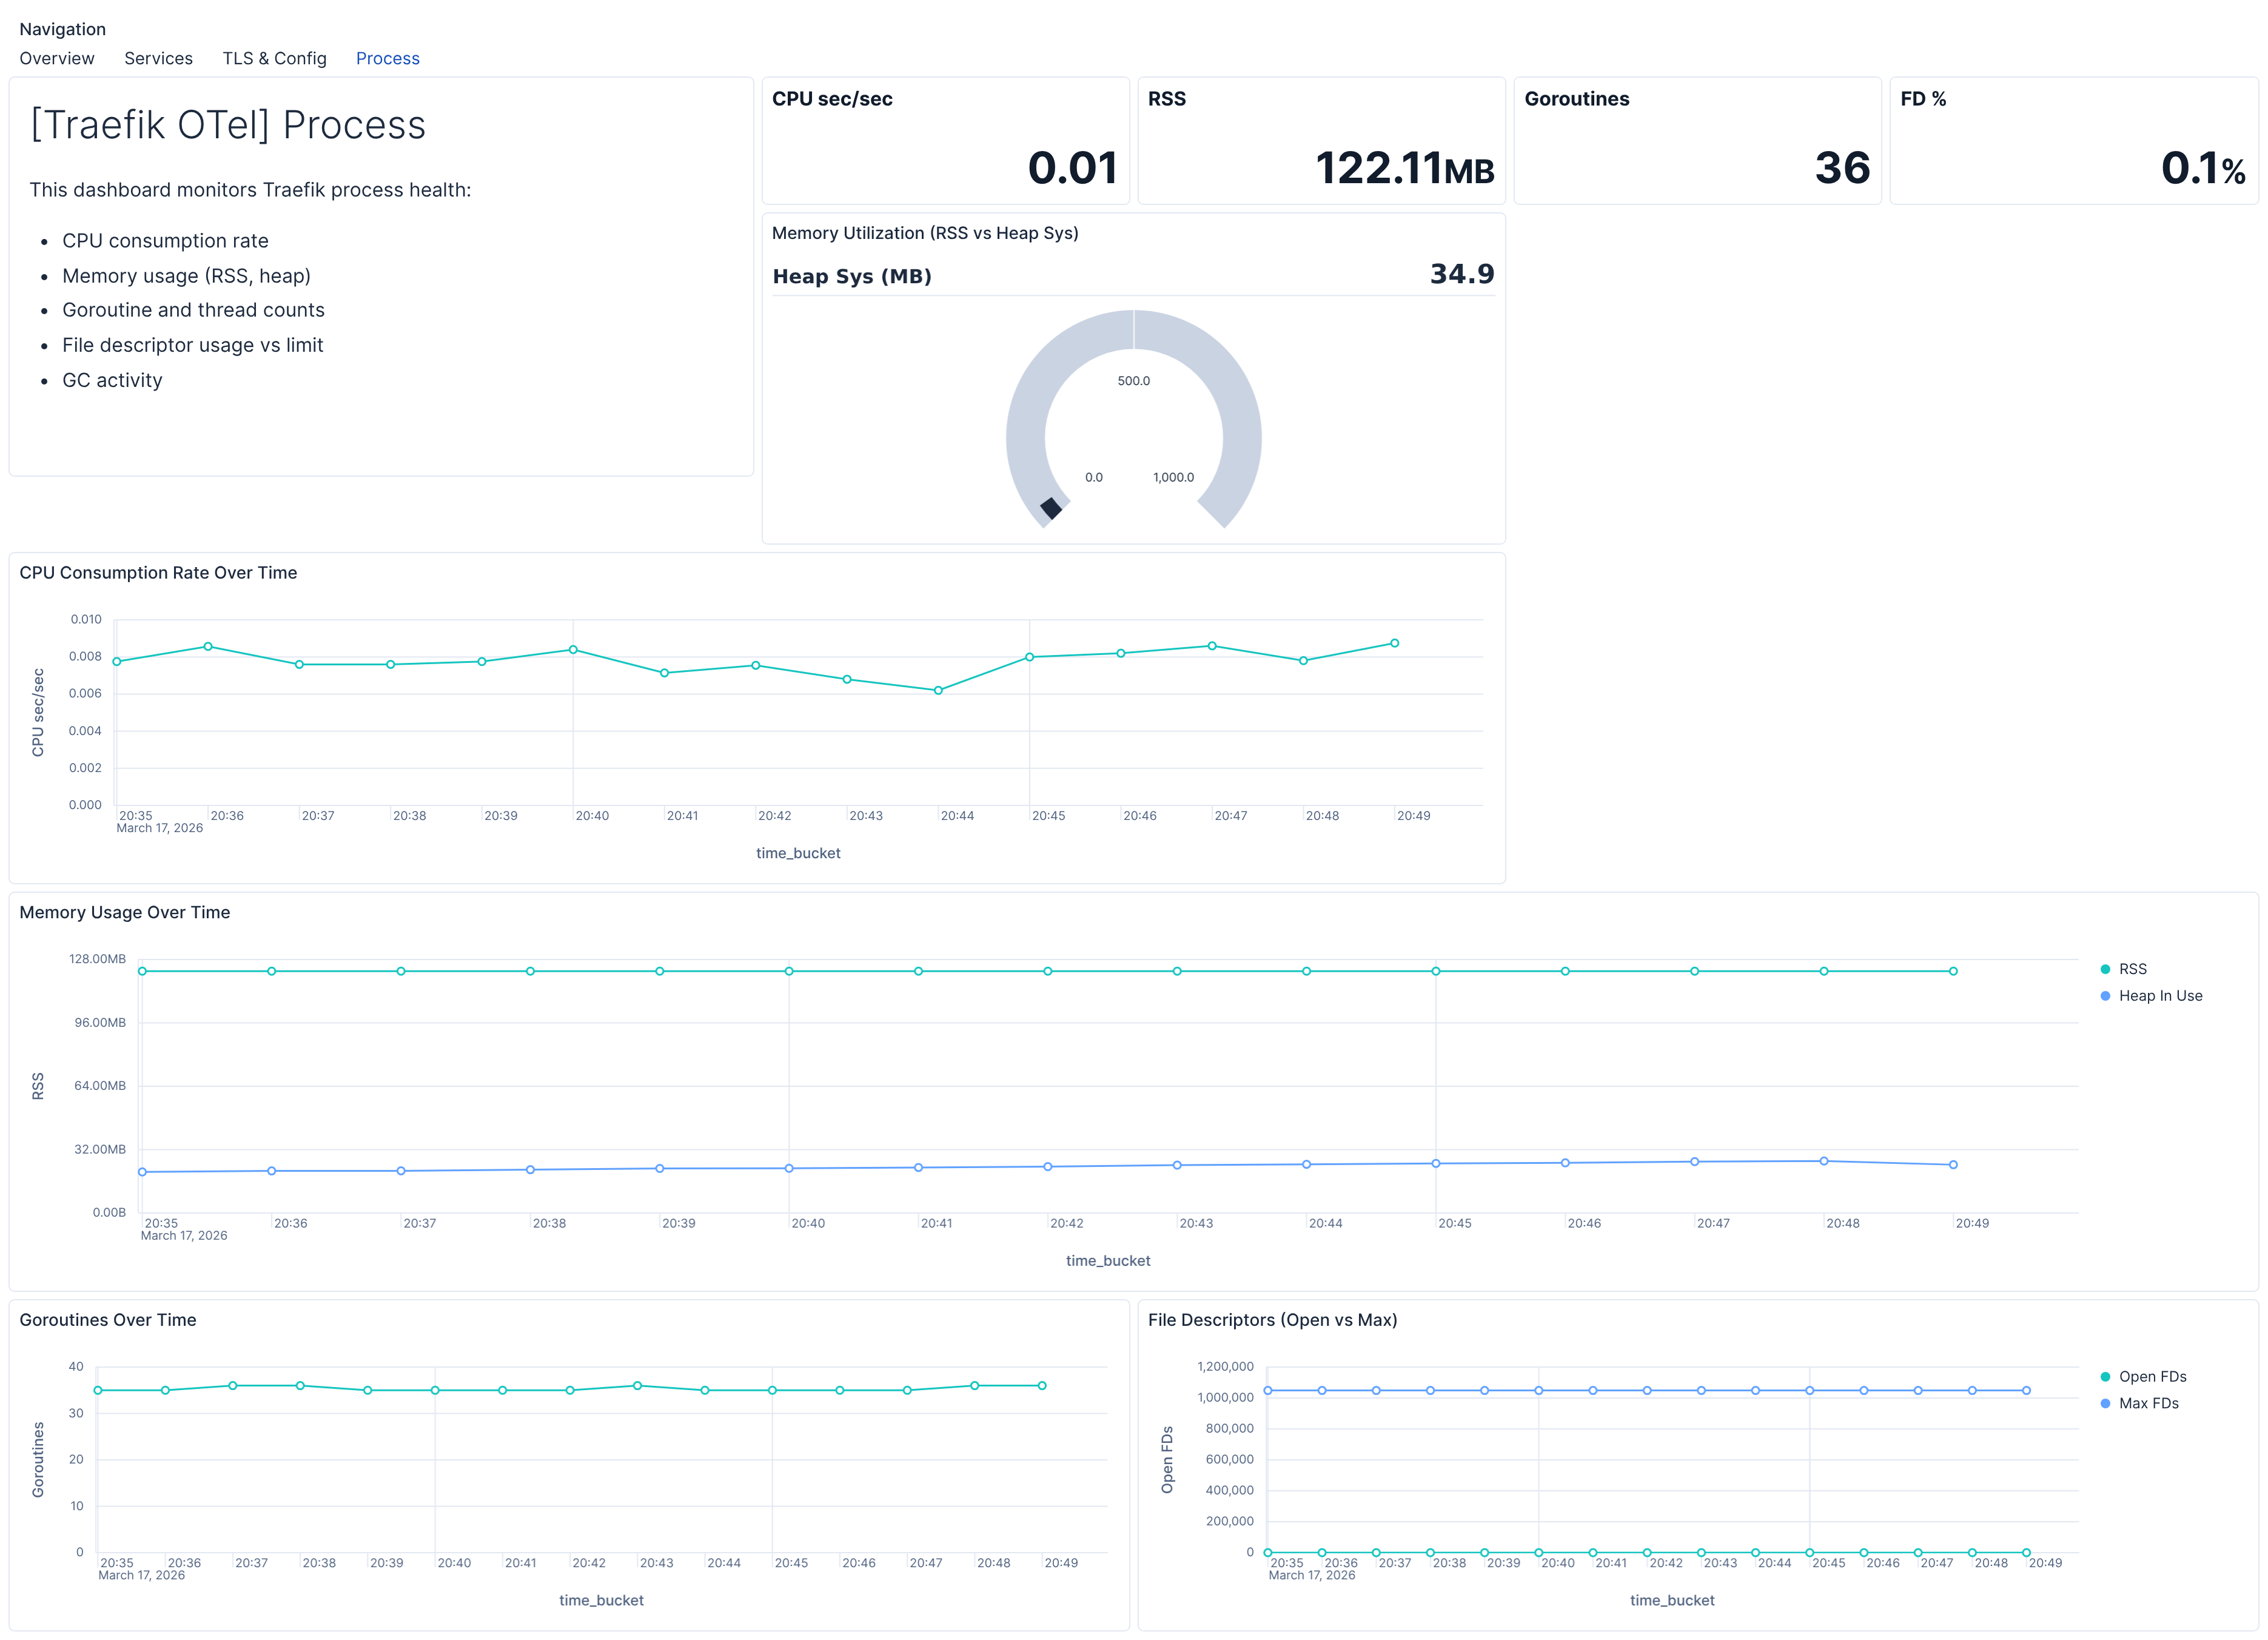
| **[Traefik OTel] Process** | Traefik process health: CPU, memory, goroutines, and file descriptor usage. |
## Alert rules
| Alert | Trigger | Severity |
|------------------------------------------------------|-------------------------------------------------------------|----------|
| **[Traefik OTel] High 5xx error rate by entrypoint** | 5xx error rate exceeds 5% for an entrypoint (15‑min window) | Critical |
| **[Traefik OTel] High 5xx error rate by router** | 5xx error rate exceeds 5% for a router (15‑min window) | Critical |
| **[Traefik OTel] High 5xx error rate by service** | 5xx error rate exceeds 5% for a service (15‑min window) | Critical |
| **[Traefik OTel] TLS certificate expiry imminent** | TLS certificate expires within 30 days | Critical |
| **[Traefik OTel] Stale config reload success** | Last successful configuration reload more than 24 hours ago | High |
| **[Traefik OTel] High memory usage** | Process resident memory exceeds 2 GB | Medium |
| **[Traefik OTel] File descriptor pressure** | Open file descriptors exceed 80% of limit | Medium |
| **[Traefik OTel] High goroutine count** | Goroutine count exceeds 2000 | Medium |
| **[Traefik OTel] High open connections** | Total open connections exceed 1000 | Medium |
## SLO templates
SLO templates require Elastic Stack version 9.4.0 or later.
| SLO | Target | Window | Description |
|-----------------------------------------------------------------------|--------|----------------|---------------------------------------------------------------|
| **[Traefik OTel] Service latency under 200 ms 99.5% rolling 30 days** | 99.5% | 30‑day rolling | 99.5% of service-level requests complete within 200 ms. |
| **[Traefik OTel] Service availability 99.5% rolling 30 days** | 99.5% | 30‑day rolling | 99.5% of service-level requests return a non‑5xx status code. |
## Screenshots
This integration includes one or more Kibana dashboards that visualizes the data collected by the integration. The screenshots below illustrate how the ingested data is displayed.
## Changelog
| Version | Details | Minimum Kibana version |
|-----------|-----------------------------------------------------------------------------------------------------------------------|------------------------|
| **0.1.0** | **Enhancement** ([View pull request](https://github.com/elastic/integrations/pull/17861))Initial draft of the package | 9.2.1 |