---
title: Vercel OpenTelemetry Assets
description: Vercel is a cloud platform for deploying and hosting frontend applications on a globally distributed edge network. The Vercel OpenTelemetry assets provide...
url: https://docs-v3-preview.elastic.dev/elastic/integration-docs/tree/main/reference/vercel_otel
products:
- Elastic integrations
applies_to:
- Serverless Observability projects: Preview
- Serverless Security projects: Preview
- Elastic Stack: Preview since 9.4
---
# Vercel OpenTelemetry Assets
| | |
|-------------------------------------------------------------------------------------------------------------------------------|-------------------------------------------------------------------|
| **Version** | 0.2.1 : Preview ([View all](#changelog)) |
| **Subscription level**[What's this?](https://www.elastic.co/subscriptions) | Basic |
| **Developed by**[What's this?](https://docs-v3-preview.elastic.dev/elastic/integration-docs/tree/main/reference/developed-by) | Elastic |
| **Minimum Kibana version(s)** | 9.4.0 |
To use pre-release integrations, go to the **Integrations** page in Kibana, scroll down, and toggle on the _Display beta integrations_ option.
Vercel is a cloud platform for deploying and hosting frontend applications on a globally distributed edge network.
The Vercel OpenTelemetry assets provide dashboards for Vercel logs, audit logs, Web Analytics, and Speed Insights forwarded through [Vercel Drains](https://vercel.com/docs/drains) into an Elastic Cloud [managed endpoint](https://www.elastic.co/docs/reference/opentelemetry/managed-inputs), covering server-side health, user experience, traffic and engagement, and team governance.
## Compatibility
The Vercel OpenTelemetry assets have been tested with Vercel Drains delivering to the Vercel path (`/inputs/vercel/_default_`) of the Elastic Cloud managed endpoint.
## Requirements
You need Elasticsearch for storing and searching your data and Kibana for visualizing and managing it.
You can use our hosted Elasticsearch Service on Elastic Cloud, which is recommended, or self-manage
the Elastic Stack on your own hardware.
The managed endpoint used by these assets is available on Elastic Cloud Serverless and Elastic Cloud Hosted. It is not available for self-managed, ECE, or ECK clusters. Refer to [Managed inputs](https://www.elastic.co/docs/reference/opentelemetry/managed-inputs).
## Setup
Vercel data reaches Elasticsearch through a [Vercel drain](https://vercel.com/docs/drains/using-drains) that posts to an Elastic Cloud [managed endpoint](https://www.elastic.co/docs/reference/opentelemetry/managed-inputs). Elastic operates the endpoint, so you do not need to install or run an OpenTelemetry Collector.
Setup has three parts, done in order:
1. Enable the Vercel features you want to collect.
2. Gather two values from Elastic: a **managed endpoint URL** and an **API key**.
3. Create the drains in Vercel using those two values.
### Step 1: Enable the Vercel features you want to collect
- **Logs** and **Audit Log**: available through [Vercel Drains](https://vercel.com/docs/drains/using-drains). Log drains require a Pro or Enterprise plan. Audit Log drains require an Enterprise plan.
- **Web Analytics**: install and enable the [@vercel/analytics](https://vercel.com/docs/analytics) SDK in your application so page views and custom events are emitted.
- **Speed Insights**: install and enable the [@vercel/speed-insights](https://vercel.com/docs/speed-insights) SDK in your application so Web Vitals are collected in the browser.
### Step 2: Gather the managed endpoint URL and API key from Elastic
You need an Elastic Cloud Serverless project or an Elastic Cloud Hosted deployment.
#### Managed endpoint URL for Vercel
Find your Elastic Cloud public endpoint:
1. Log in to the [Elastic Cloud Console](https://cloud.elastic.co/).
2. Open your project or deployment and select **Manage**.
3. In **Application endpoints, cluster and component IDs**, select the Vercel endpoint, then copy the public endpoint value.
The managed endpoint URL for Vercel is that public endpoint plus `/inputs/vercel/_default_`, which is the path that accepts Vercel drain payloads:
```text
https:///inputs/vercel/_default_
```
For example, if your public endpoint is `https://abc123.ingest.us-east-1.aws.elastic.cloud`, then the managed endpoint URL for Vercel is:
```text
https://abc123.ingest.us-east-1.aws.elastic.cloud/inputs/vercel/_default_
```
Every project and deployment has its own host, so always build the managed endpoint URL for Vercel from the endpoint shown in your own Elastic Cloud project or deployment. Refer to [Find your endpoint](https://www.elastic.co/docs/reference/opentelemetry/managed-inputs/managed-otlp-endpoint#find-your-elastic-cloud-managed-otlp-endpoint) for more detail.
#### API key
Create an API key by following the [Send data to Elastic Cloud](https://www.elastic.co/docs/solutions/observability/get-started/quickstart-elastic-cloud-otel-endpoint) quickstart, then copy the encoded value. Vercel sends it in an `Authorization` header that must use the `ApiKey` scheme, as described in [Authentication](https://www.elastic.co/docs/reference/opentelemetry/managed-inputs/managed-otlp-endpoint#authentication).
Alternatively, in your Elastic Cloud Serverless project, go to **Add data** → **Applications** → **OpenTelemetry**. That wizard shows the endpoint and generates a pre-configured API key for you.
### Step 3: Create the drains in Vercel
A Vercel drain carries a single data type, so create a separate drain for each of Logs, Audit Log, Web Analytics, and Speed Insights that you want in Elastic. All of them use the same managed endpoint URL and API key.
For each data type, in Vercel:
1. Open your team **Drains** settings and create a drain for that data type.
2. Choose **Custom Endpoint** as the destination.
3. Set the **Endpoint URL** to the managed endpoint URL for Vercel, for example `https://abc123.ingest.us-east-1.aws.elastic.cloud/inputs/vercel/_default_`.
4. Under **Custom Headers**, add a header named `Authorization` with the value `ApiKey `, for example `Authorization: ApiKey abc123`.
5. Save the drain.
For Logs drains, you can also narrow which sources, environments, and sampling rates are forwarded under **Additional configuration for logs**. Refer to [Log Drains reference](https://vercel.com/docs/drains/reference/logs).
The managed endpoint URL for Vercel is always your Elastic Cloud public endpoint plus `/inputs/vercel/_default_`. Do not point the drain at a self-hosted collector for these assets; the supported path is the Elastic Cloud managed endpoint.
## Reference
Vercel drain payloads are decoded by the Elastic Cloud managed endpoint and written to the data streams below. Each data type has its own payload schema, documented by Vercel, and those fields are what you query in Elastic. For drain configuration on the Vercel side, see [Using drains](https://vercel.com/docs/drains/using-drains). For managed endpoint behavior, see [Managed inputs](https://www.elastic.co/docs/reference/opentelemetry/managed-inputs).
### Metrics
| Signal | Data stream | Fields |
|----------------|------------------------------------------|--------------------------------------------------------------------------------------------|
| Speed Insights | `metrics-vercel.speedinsights.v1.otel-*` | [Speed Insights Drains reference](https://vercel.com/docs/drains/reference/speed-insights) |
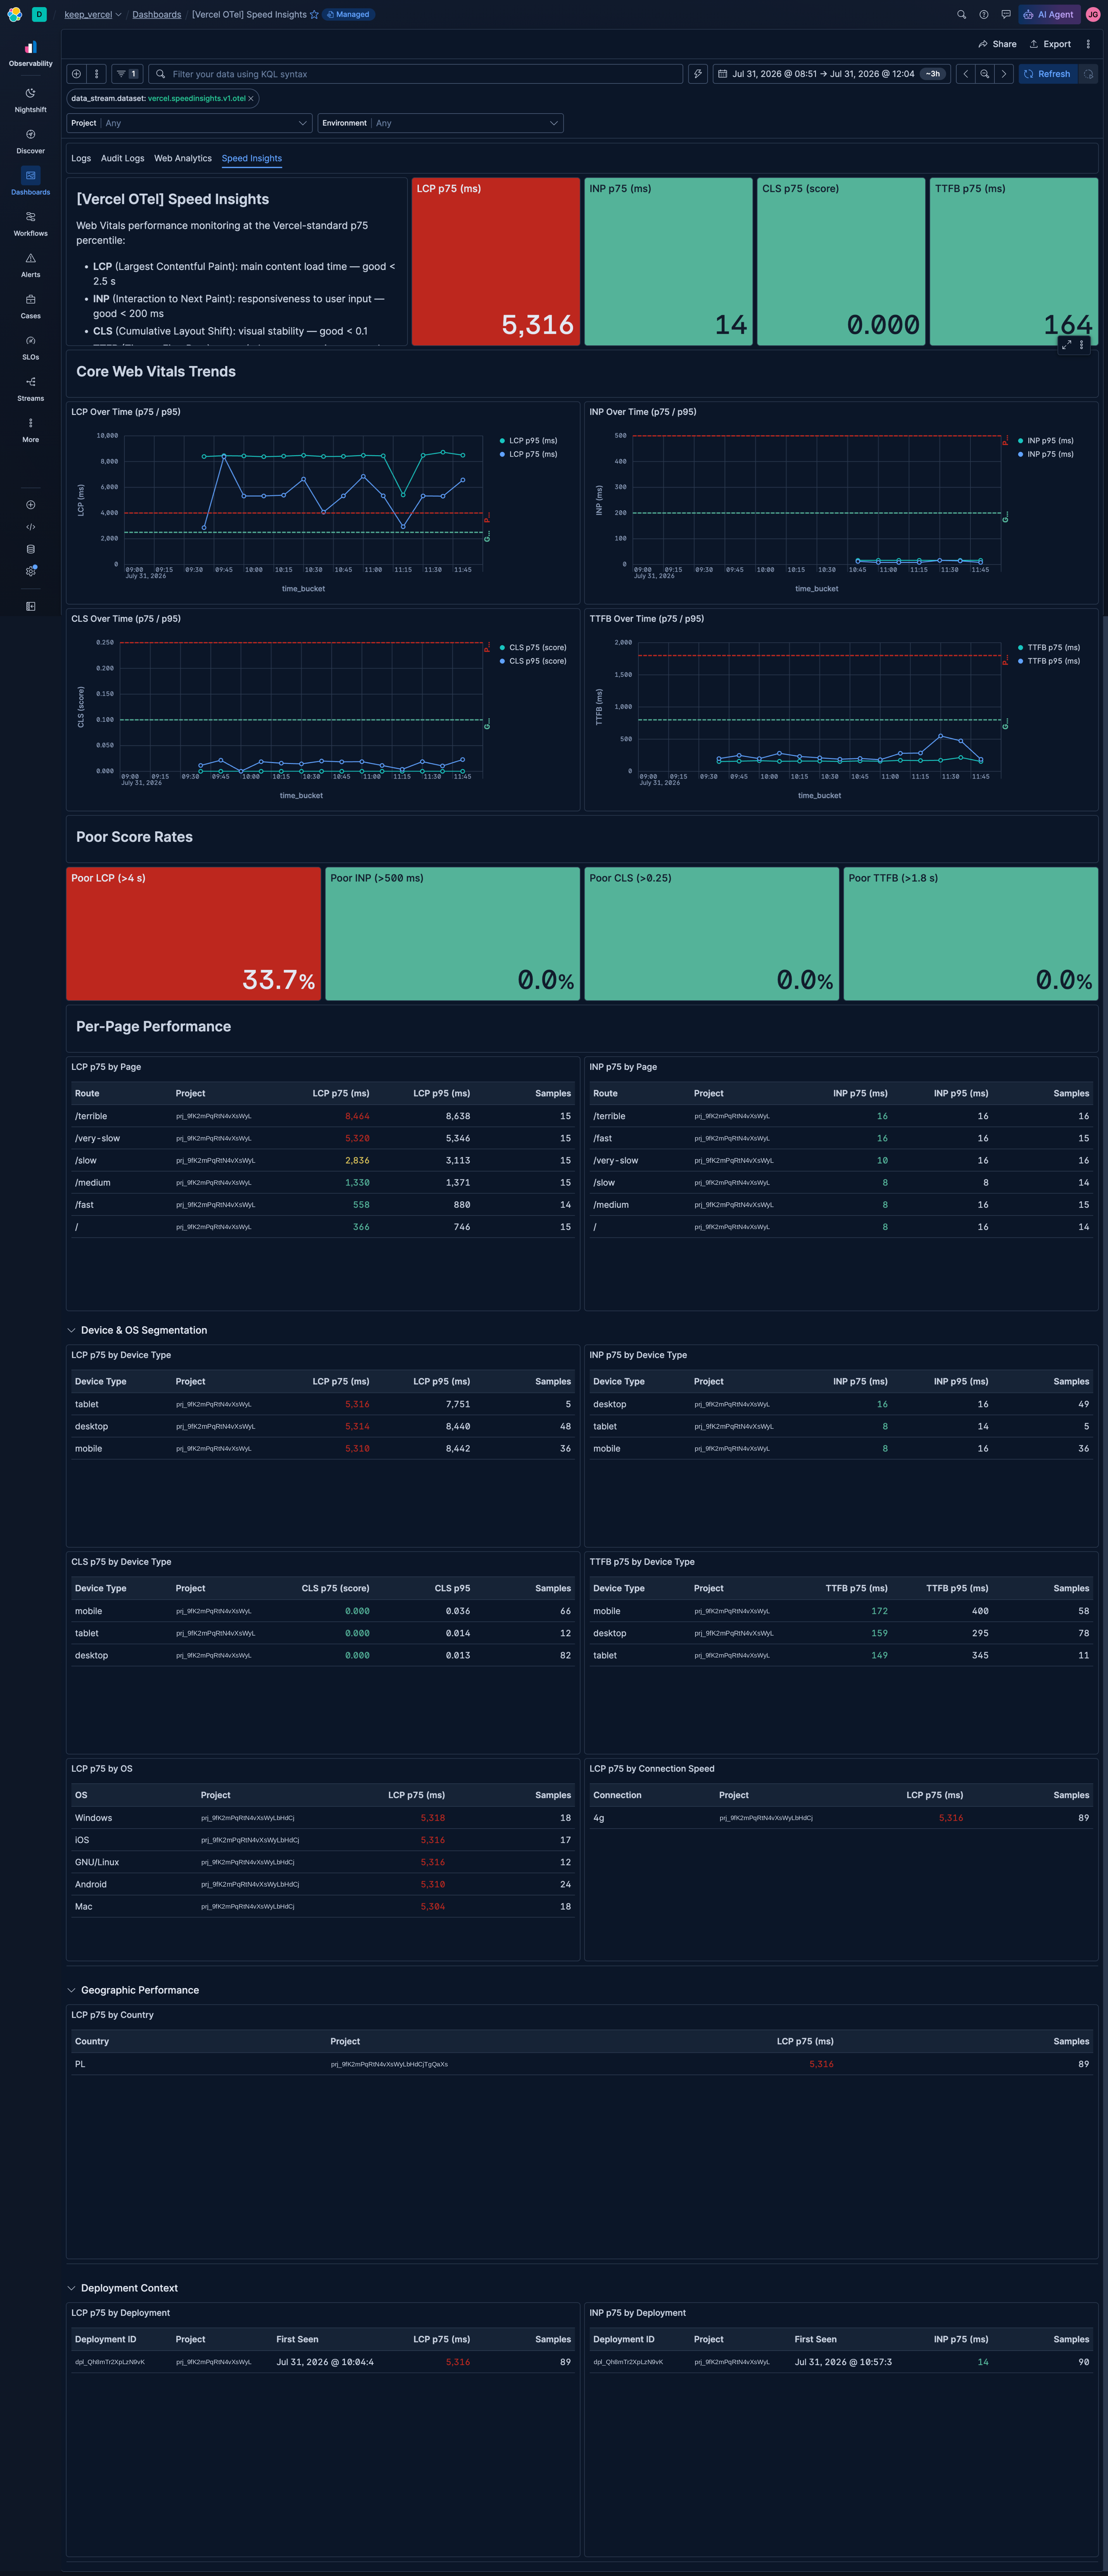
Speed Insights carries Web Vitals (LCP, INP, CLS, TTFB) and their related attributes, such as route, device, and country.
### Logs
| Signal | Data stream | Fields |
|---------------|-----------------------------------|-----------------------------------------------------------------------------------|
| Logs | `logs-vercel.logs.otel-*` | [Log Drains reference](https://vercel.com/docs/drains/reference/logs) |
| Audit logs | `logs-vercel.auditlog.v1.otel-*` | [Audit Log Drains reference](https://vercel.com/docs/drains/reference/audit-logs) |
| Web Analytics | `logs-vercel.analytics.v2.otel-*` | [Analytics Drains reference](https://vercel.com/docs/drains/reference/analytics) |
The Logs data stream holds every source selected on the drain, so it covers build output and static asset requests alongside function output from the `lambda` and `edge` runtimes. Use the **Log Source** filter on the Logs dashboard to focus on a single source.
To see how a payload field is indexed, open the data stream in **Discover** and inspect a document, or check the data stream mappings in **Stack Management** → **Index Management**.
## Dashboards
| Dashboard | Description |
|----------------------------------|-----------------------------------------------------------------------------------------------------------------------------------|
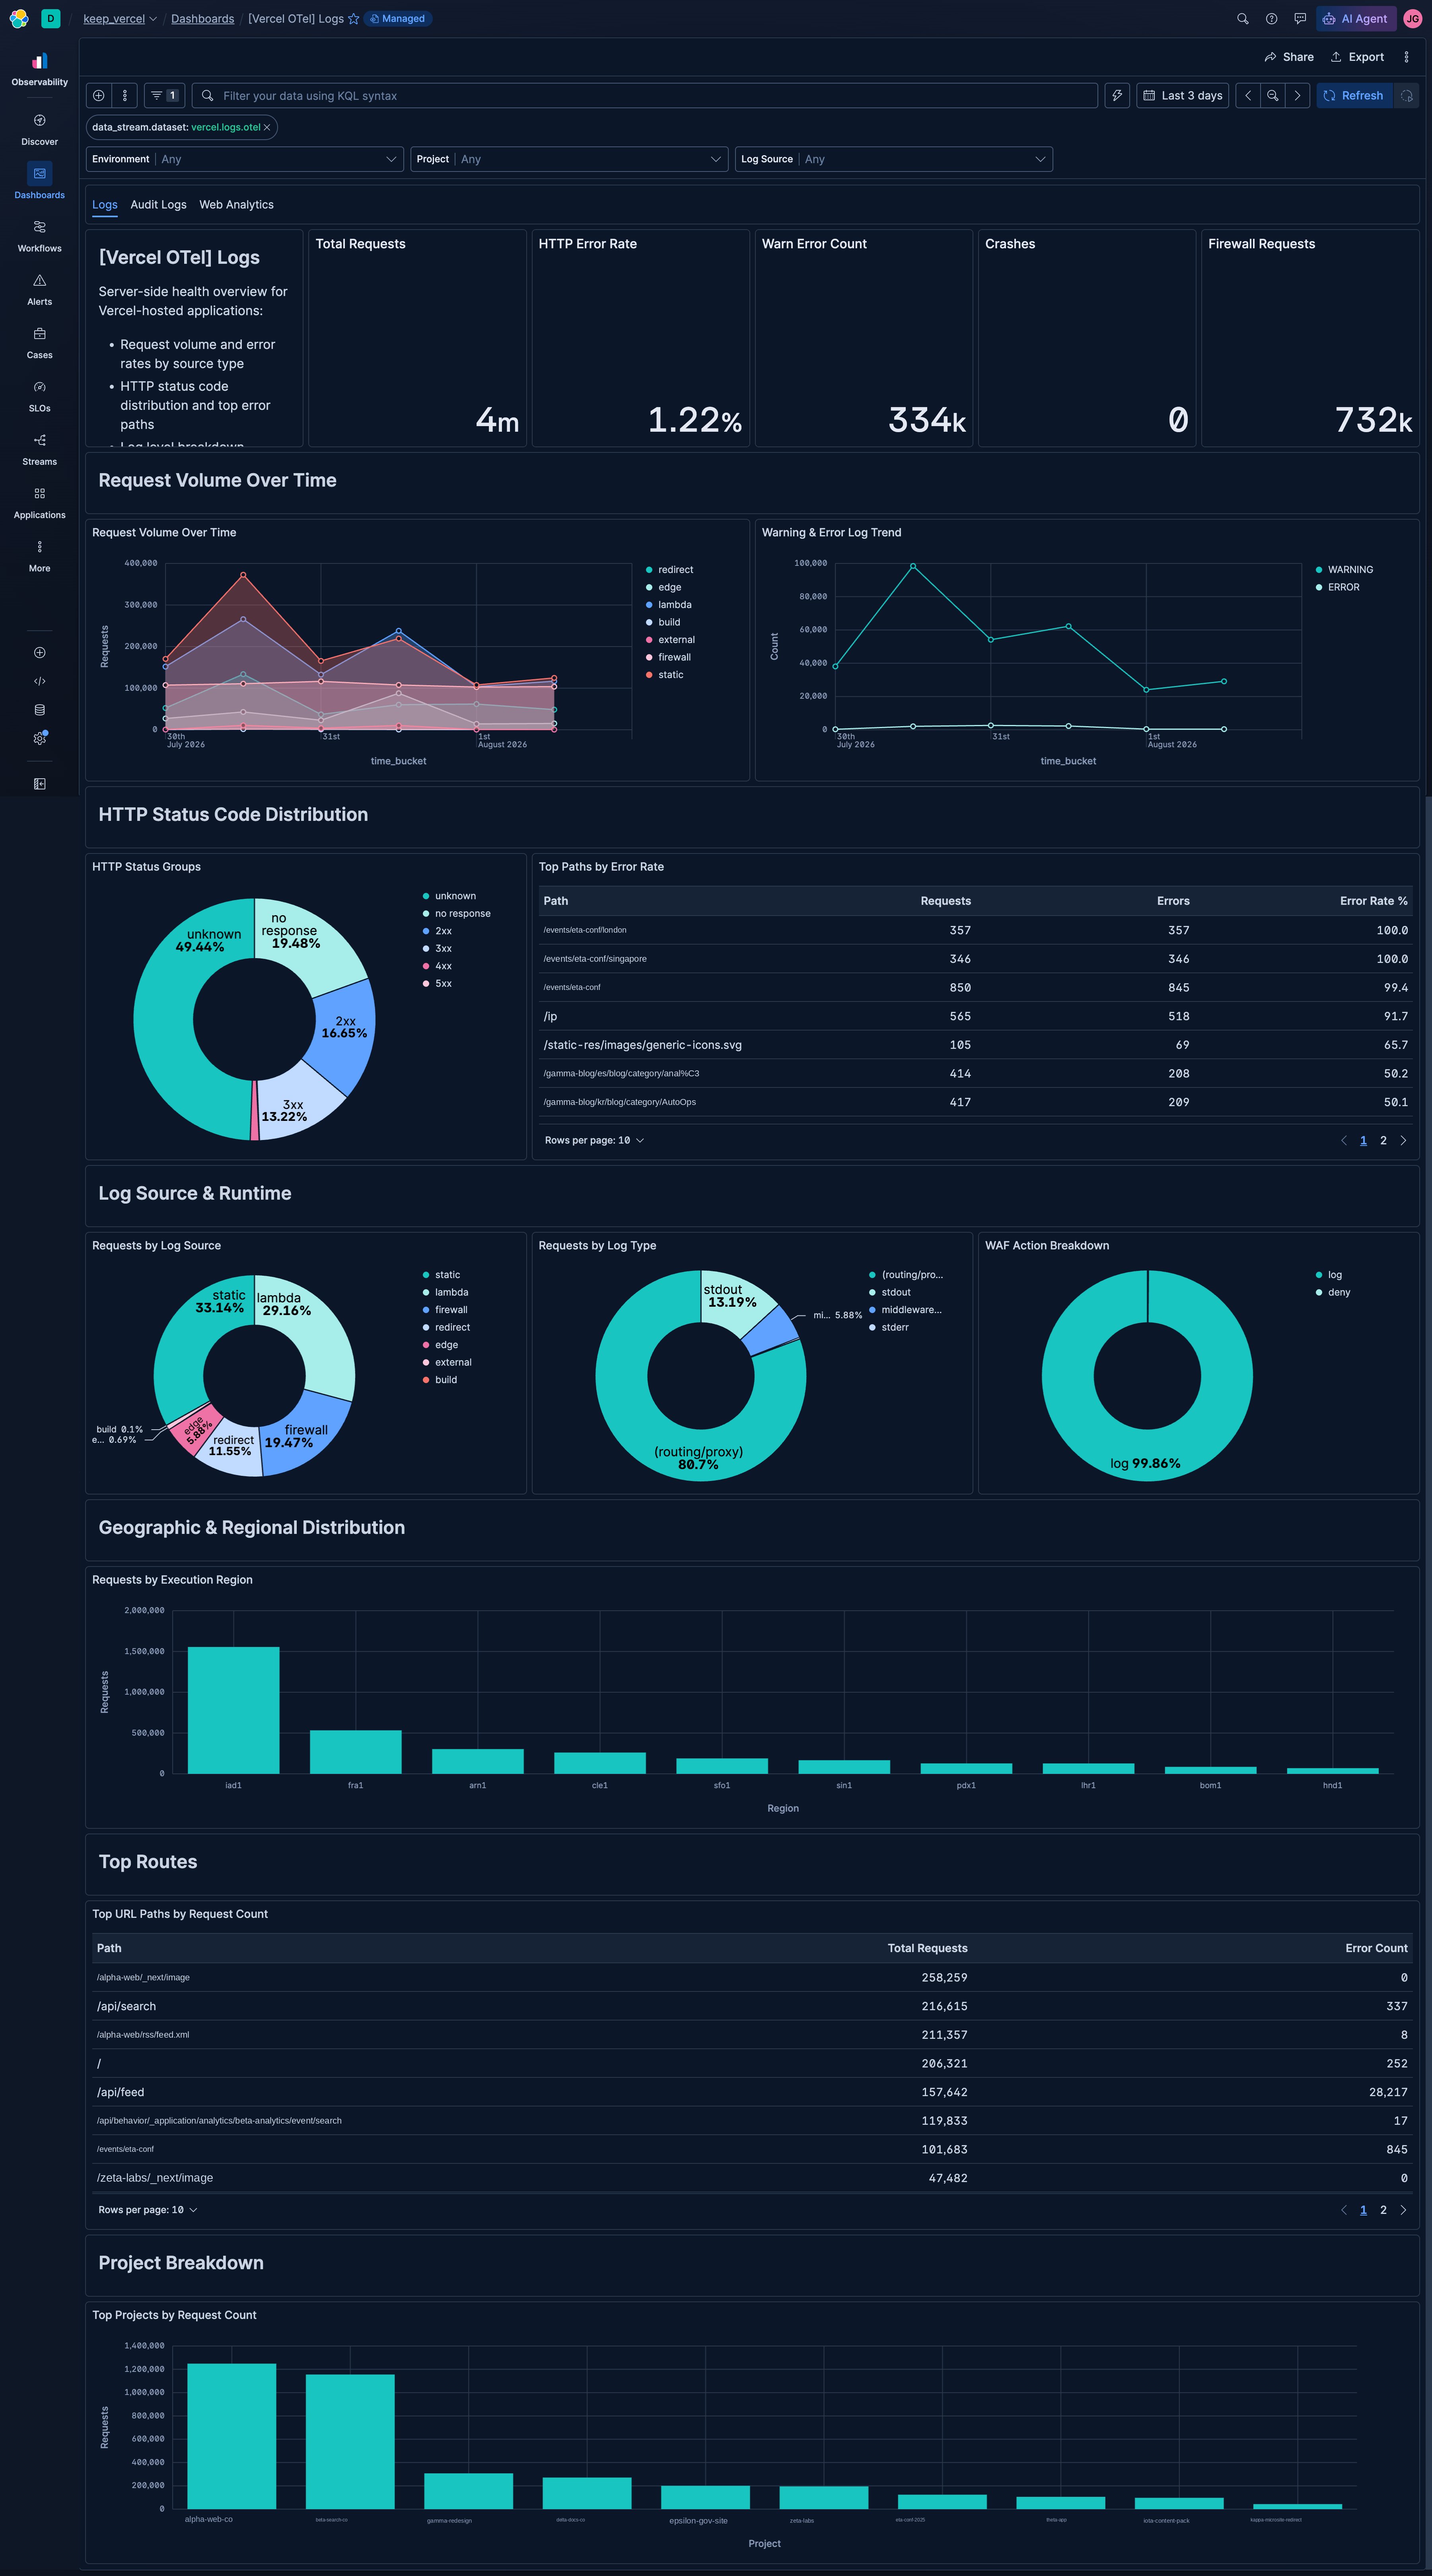
| **[Vercel OTel] Logs** | Server-side health overview covering request volume, error rates, HTTP status distribution, log sources, regions, and top routes. |
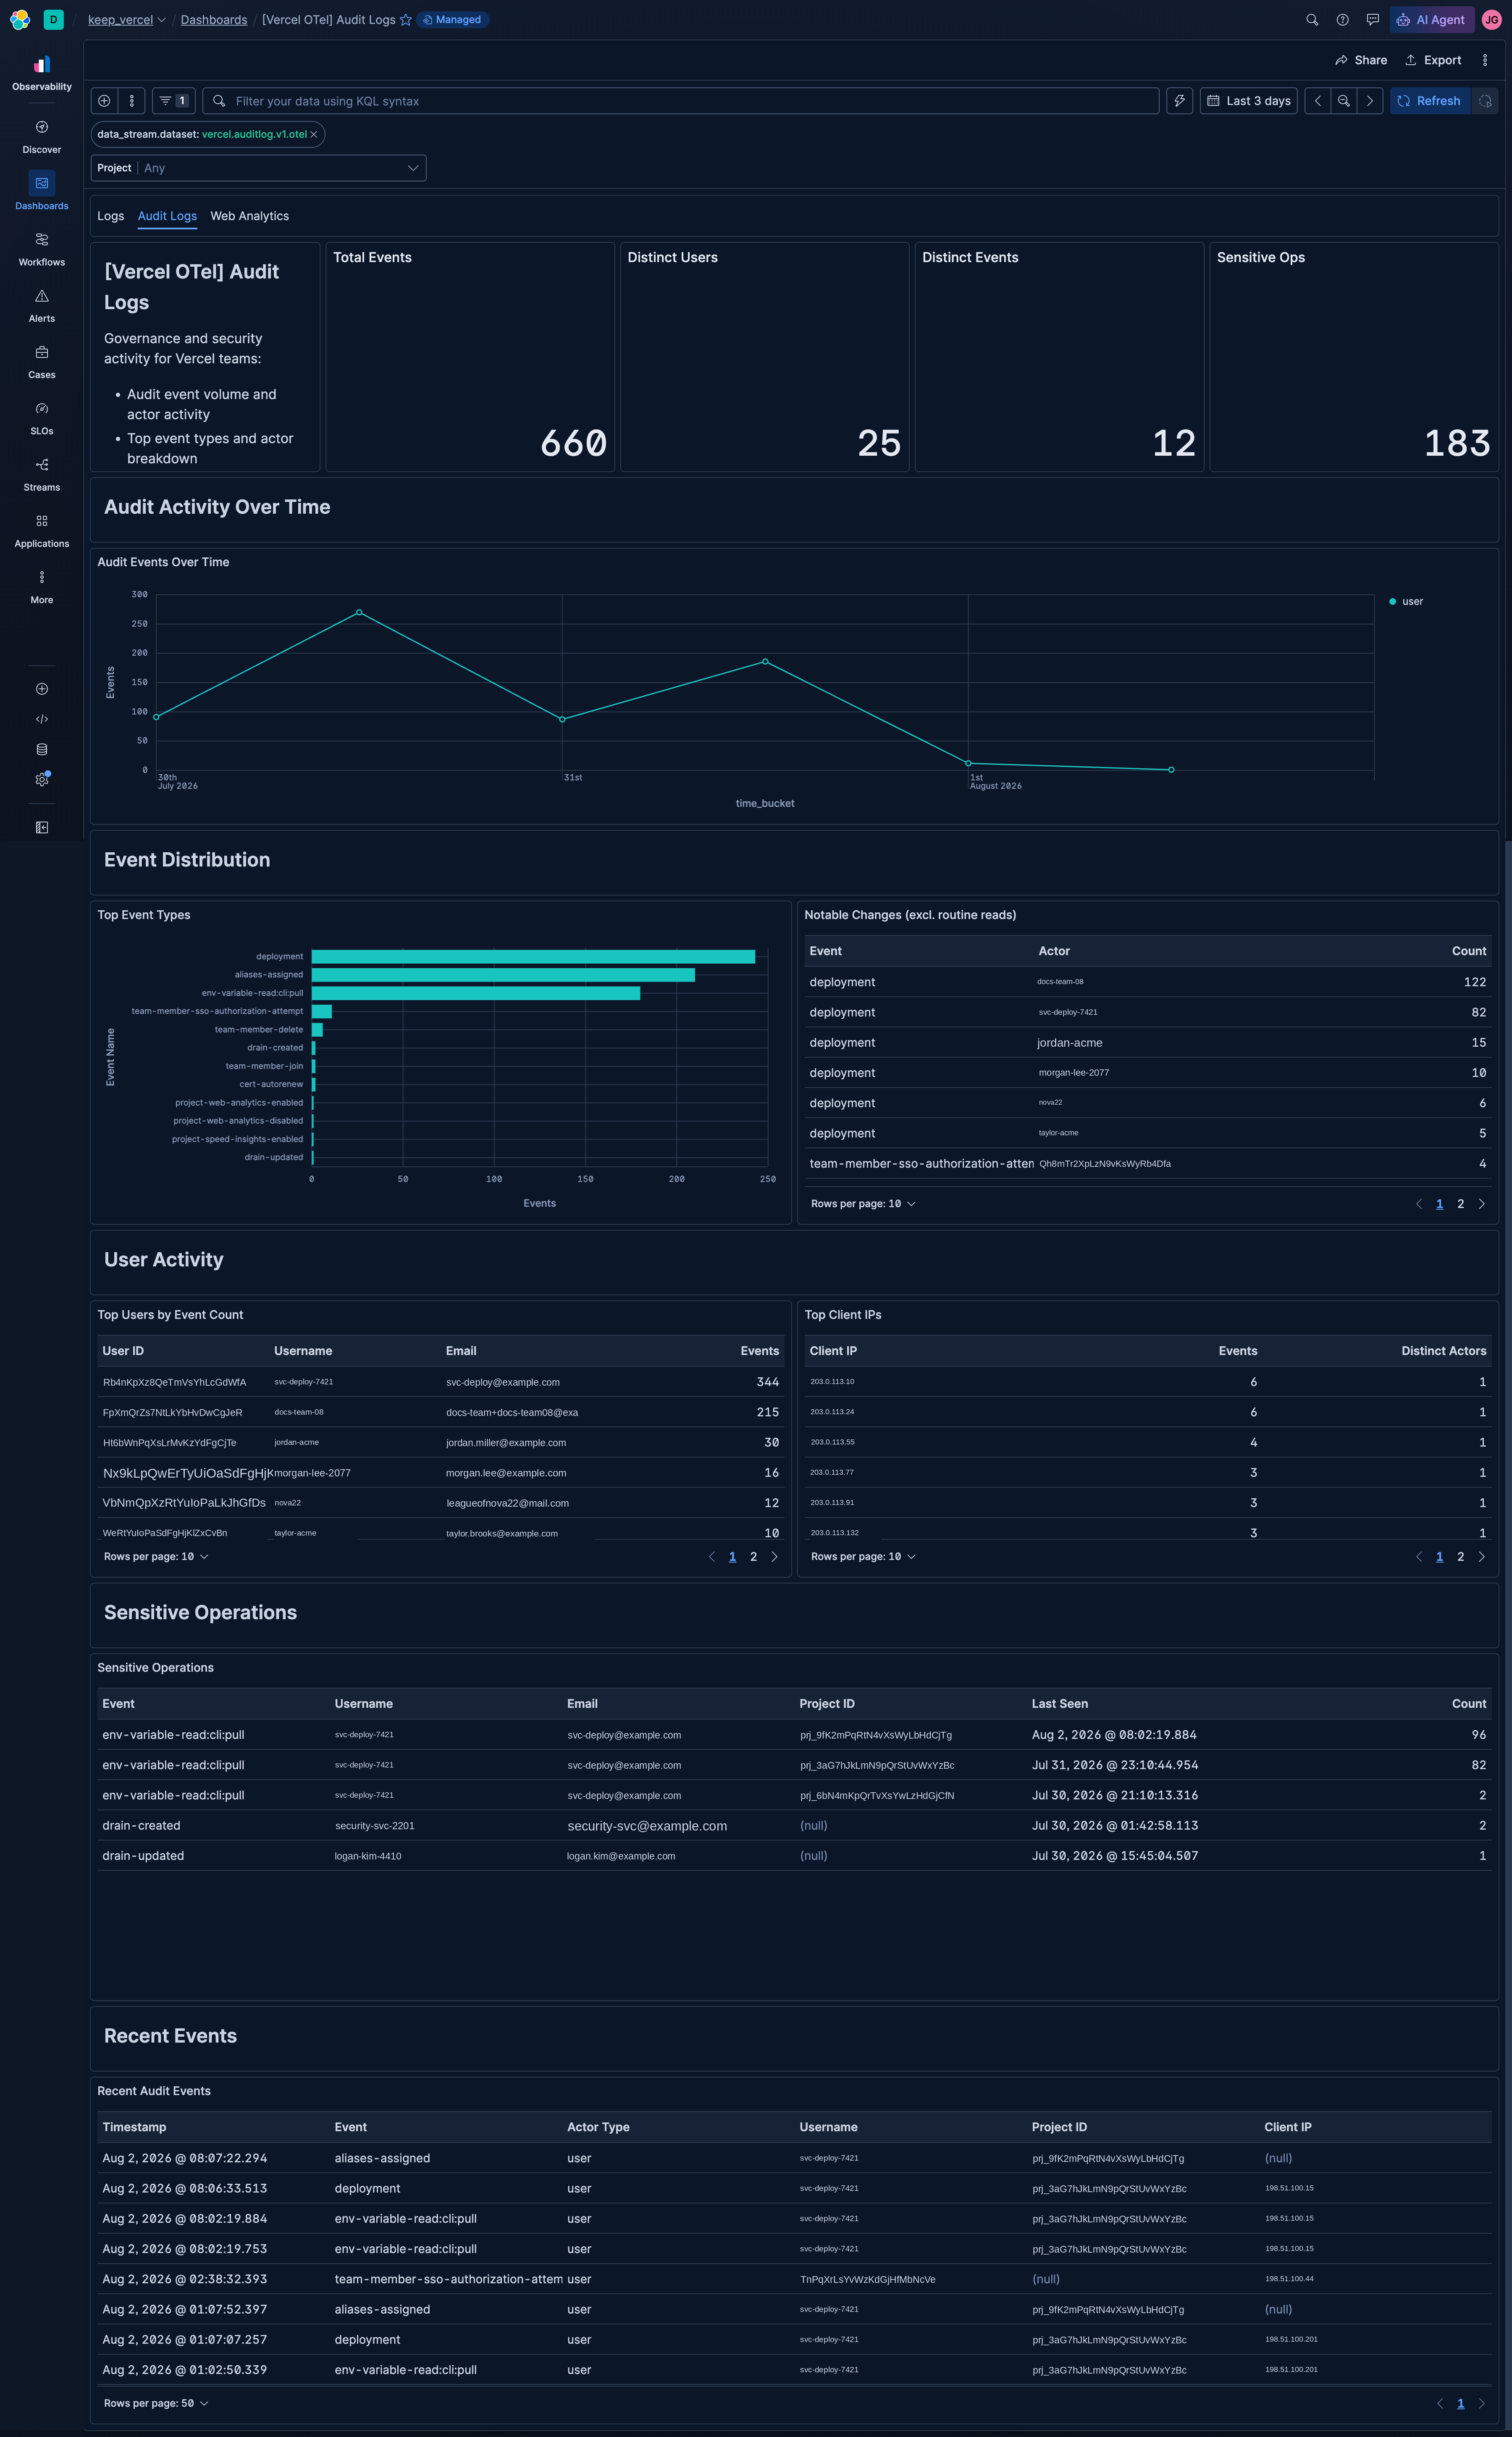
| **[Vercel OTel] Audit Logs** | Governance and security overview of audit event volume, actors, top event types, user activity, and sensitive operations. |
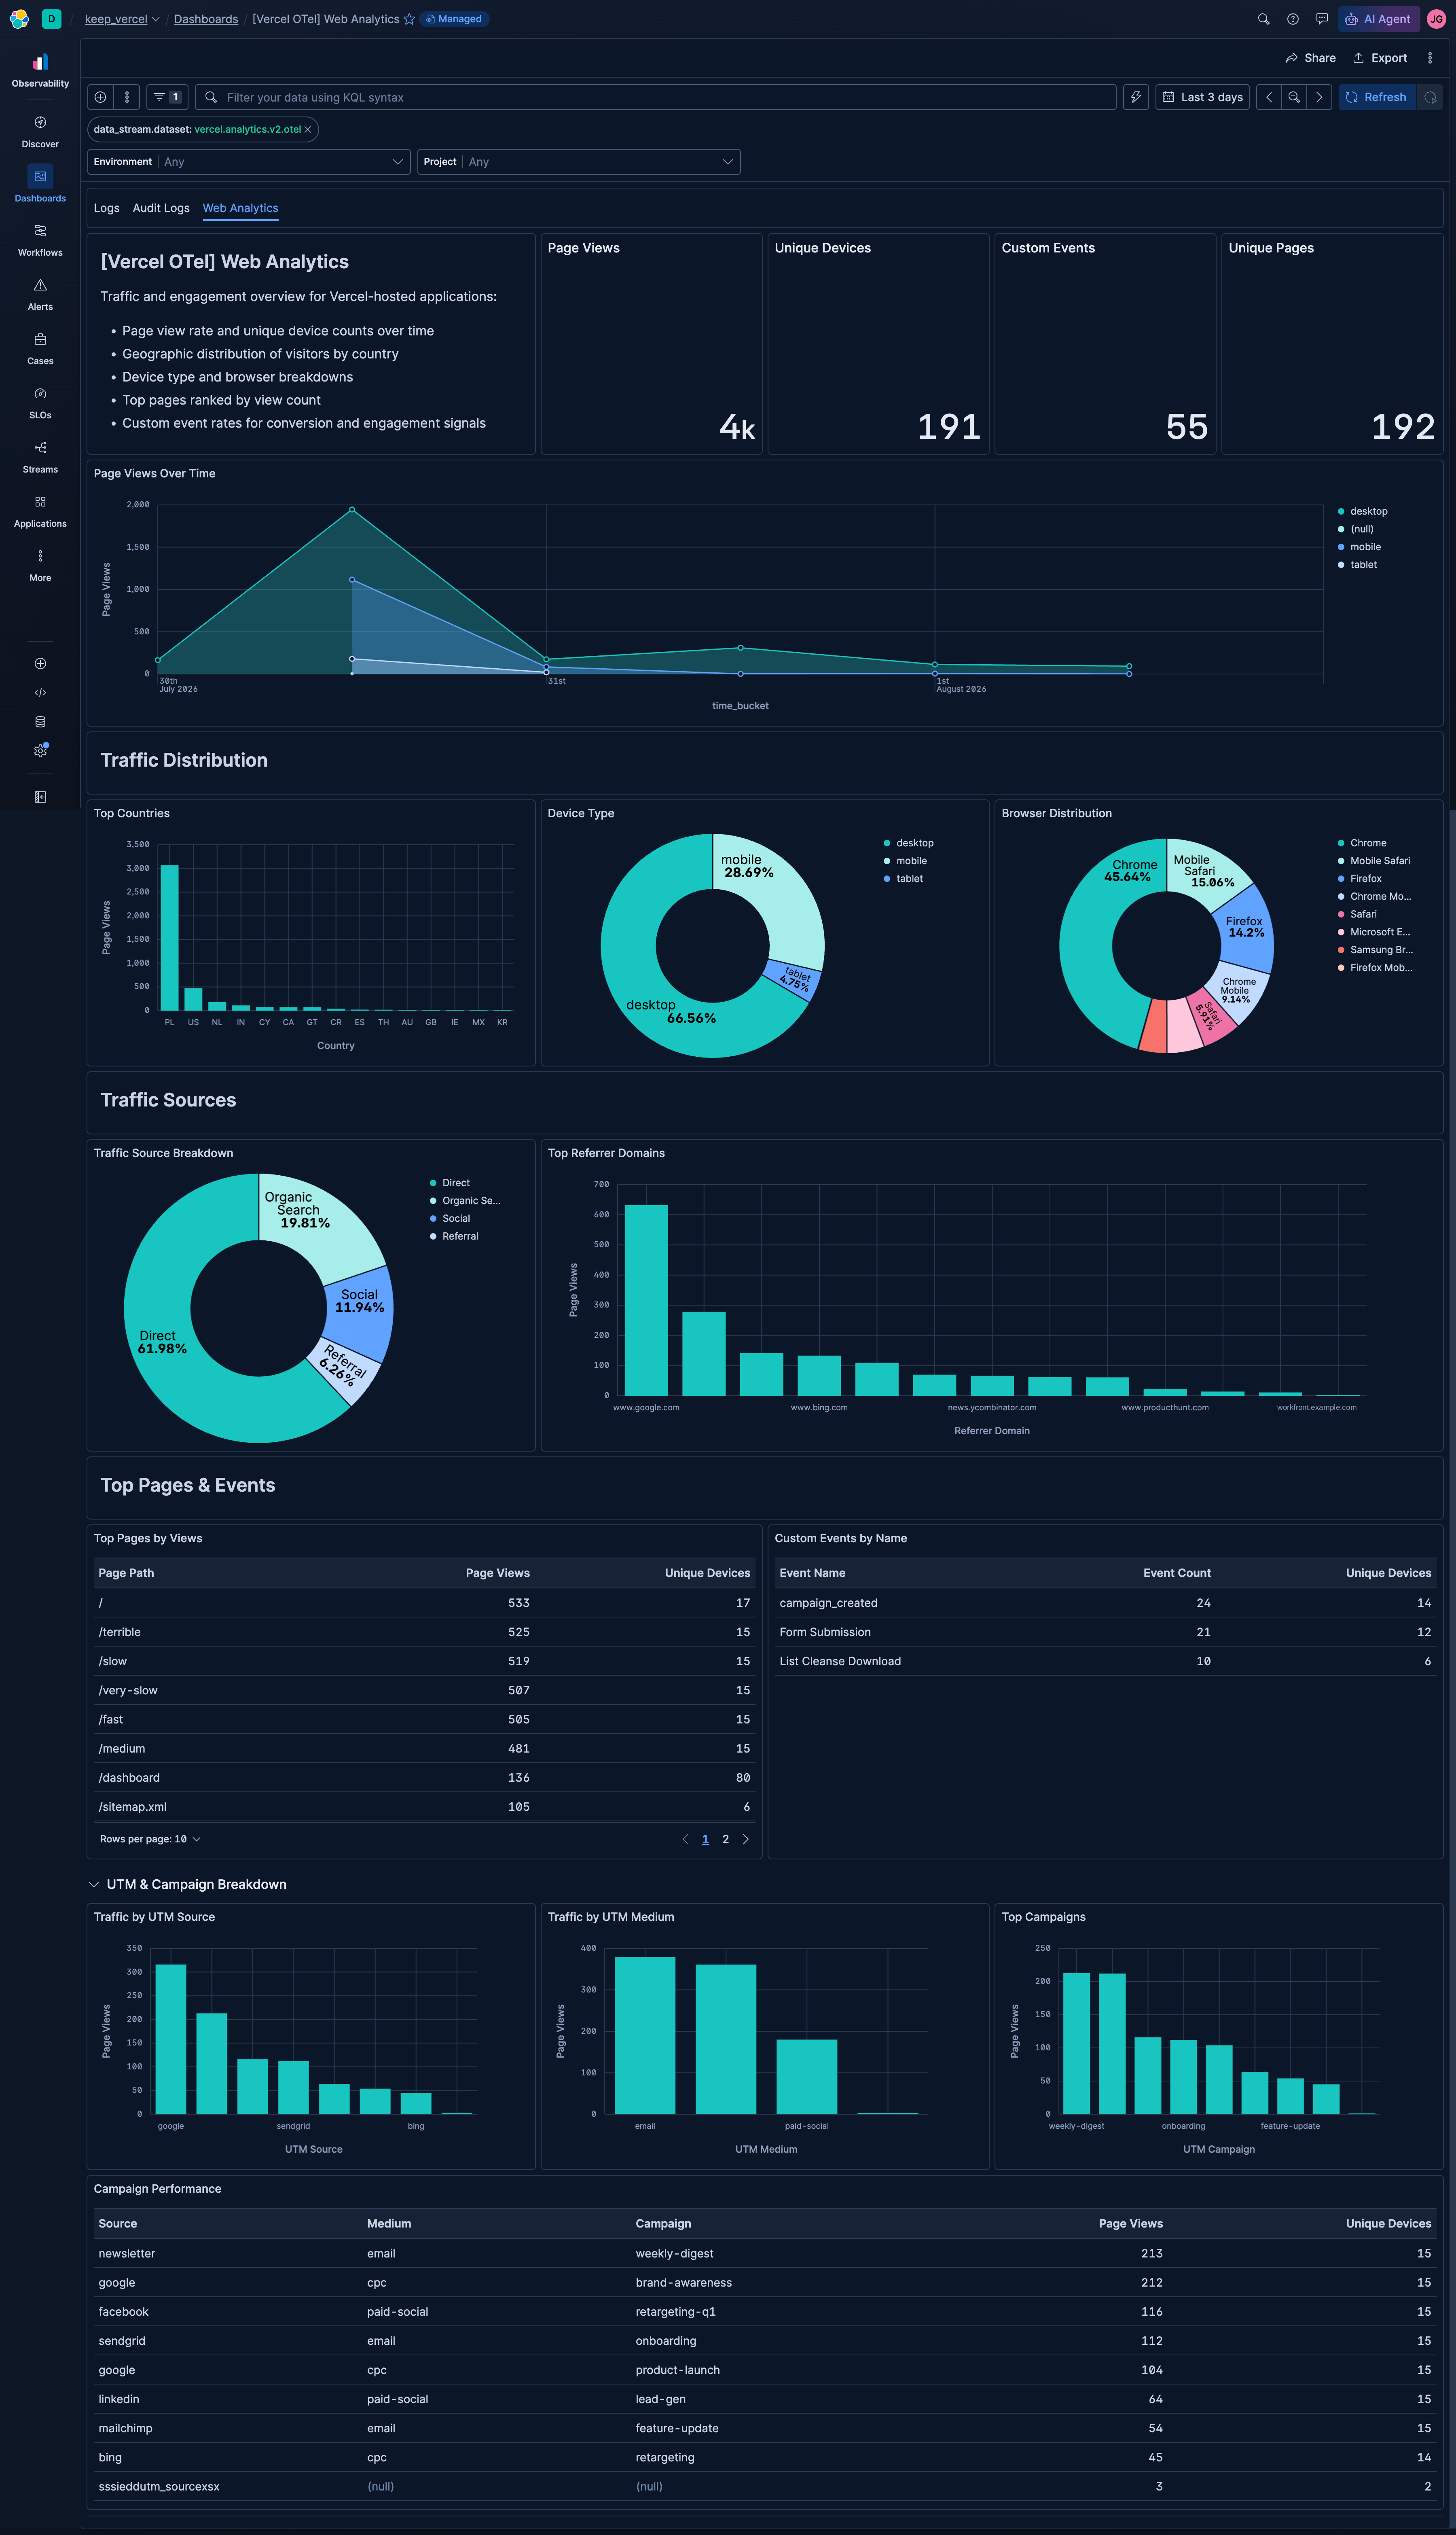
| **[Vercel OTel] Web Analytics** | Traffic and engagement overview covering page views, geography, devices, top pages, and custom events. |
| **[Vercel OTel] Speed Insights** | Web Vitals performance overview tracking LCP, INP, CLS, and TTFB at the p75 benchmark over time and per page. |
## Screenshots
This integration includes one or more Kibana dashboards that visualizes the data collected by the integration. The screenshots below illustrate how the ingested data is displayed.
## Changelog
| Version | Details | Minimum Kibana version |
|-----------|------------------------------------------------------------------------------------------------------------------------------------------------------------------------|------------------------|
| **0.2.1** | **Bug fix** ([View pull request](https://github.com/elastic/integrations/pull/20651))Update managed endpoint path | 9.4.0 |
| **0.2.0** | **Enhancement** ([View pull request](https://github.com/elastic/integrations/pull/20441))Add the Speed Insights dashboard and the vercel.speedinsights.v1.otel dataset | 9.4.0 |
| **0.1.0** | **Enhancement** ([View pull request](https://github.com/elastic/integrations/pull/20387))Initial release of the Vercel content package | 9.4.0 |