---
title: VMware vSphere OpenTelemetry Assets
description: VMware vSphere is a server virtualization platform comprising vCenter Server (centralized management) and ESXi hypervisors (compute hosts). It abstracts...
url: https://docs-v3-preview.elastic.dev/elastic/integration-docs/tree/main/reference/vsphere_otel
products:
- Elastic integrations
applies_to:
- Serverless Observability projects: Generally available
- Serverless Security projects: Generally available
- Elastic Stack: Generally available since 9.3
---
# VMware vSphere OpenTelemetry Assets
| | |
|-------------------------------------------------------------------------------------------------------------------------------|----------------------------------------------------------------|
| **Version** | 0.1.0 : Beta ([View all](#changelog)) |
| **Subscription level**[What's this?](https://www.elastic.co/subscriptions) | Basic |
| **Developed by**[What's this?](https://docs-v3-preview.elastic.dev/elastic/integration-docs/tree/main/reference/developed-by) | Elastic |
| **Minimum Kibana version(s)** | 9.3.0 |
To use beta integrations, go to the **Integrations** page in Kibana, scroll down, and toggle on the _Display beta integrations_ option.
VMware vSphere is a server virtualization platform comprising vCenter Server (centralized management) and ESXi hypervisors (compute hosts). It abstracts physical compute, memory, storage, and networking resources into pools that are allocated to virtual machines.
The VMware vSphere OpenTelemetry assets provide pre-built dashboards, alert rules, and SLO templates for infrastructure health, host and VM performance, storage capacity, and memory pressure. They use metrics from the OpenTelemetry vcenterreceiver and cover availability, CPU, memory, and storage operations.
## Compatibility
- **vSphere versions:** Tested against vSphere 7.0 (API version 7.0). The vcenterreceiver is expected to work with vSphere 6.5 and later.
- **OpenTelemetry Collector:** Tested with otelcol-contrib v0.147.0 (vcenterreceiver v0.147.0).
## Requirements
You need Elasticsearch for storing and searching your data and Kibana for visualizing and managing it.
You can use our hosted Elasticsearch Service on Elastic Cloud, which is recommended, or self-manage
the Elastic Stack on your own hardware.
## Setup
### Prerequisites
The vcenterreceiver connects to vCenter Server via the vSphere API. Ensure that:
1. You have a vCenter Server or SDK-enabled ESXi host reachable from the collector.
2. You have a user account with **Read-only** or **View** permissions. For full metric coverage, grant the user the **Performance.ModifyIntervals** privilege (or equivalent) so the receiver can set the statistics collection level.
3. The collector host can reach vCenter on port 443 (HTTPS).
### Configuration
Configure the OpenTelemetry Collector or the Elastic Observability Distribution for OpenTelemetry (EDOT) to receive vSphere metrics and export them to Elasticsearch. The following example uses the vcenterreceiver and the `elasticsearch/otel` exporter with `mapping.mode: otel`.
| Placeholder | Description | Example |
|--------------------------------------|------------------------------------------------|-------------------------------------------------------------|
| `` | vCenter Server or ESXi host URL | `https://vcenter.example.com` |
| `` | vCenter user with read-only access | `administrator@vsphere.local` |
| `` | vCenter user password | Set via `${env:VCENTER_PASSWORD}` |
| `` | Elasticsearch endpoint URL | `https://my-deployment.es.us-central1.gcp.cloud.es.io:9243` |
| `` | Elasticsearch username | `elastic` |
| `` | Elasticsearch password | Set via `${env:ES_PASSWORD}` |
| `` | Skip TLS certificate verification (true/false) | `false` |
```yaml
receivers:
vcenter:
endpoint: ${env:VCENTER_ENDPOINT}
username: ${env:VCENTER_USERNAME}
password: ${env:VCENTER_PASSWORD}
collection_interval: 2m
initial_delay: 1s
tls:
insecure_skip_verify: ${env:VCENTER_TLS_INSECURE_SKIP_VERIFY}
processors:
batch:
timeout: 10s
send_batch_size: 1024
exporters:
elasticsearch/otel:
endpoints:
- ${env:ES_ENDPOINT}
user: ${env:ES_USERNAME}
password: ${env:ES_PASSWORD}
mapping:
mode: otel
service:
pipelines:
metrics:
receivers: [vcenter]
processors: [batch]
exporters: [elasticsearch/otel]
```
## Reference
### Metrics
Refer to the [metadata.yaml](https://github.com/open-telemetry/opentelemetry-collector-contrib/blob/main/receiver/vcenterreceiver/metadata.yaml)
of the OpenTelemetry vCenter receiver for details on available metrics.
## Dashboards
| Dashboard | Description |
|-------------------------------------|----------------------------------------------------------------------------------|
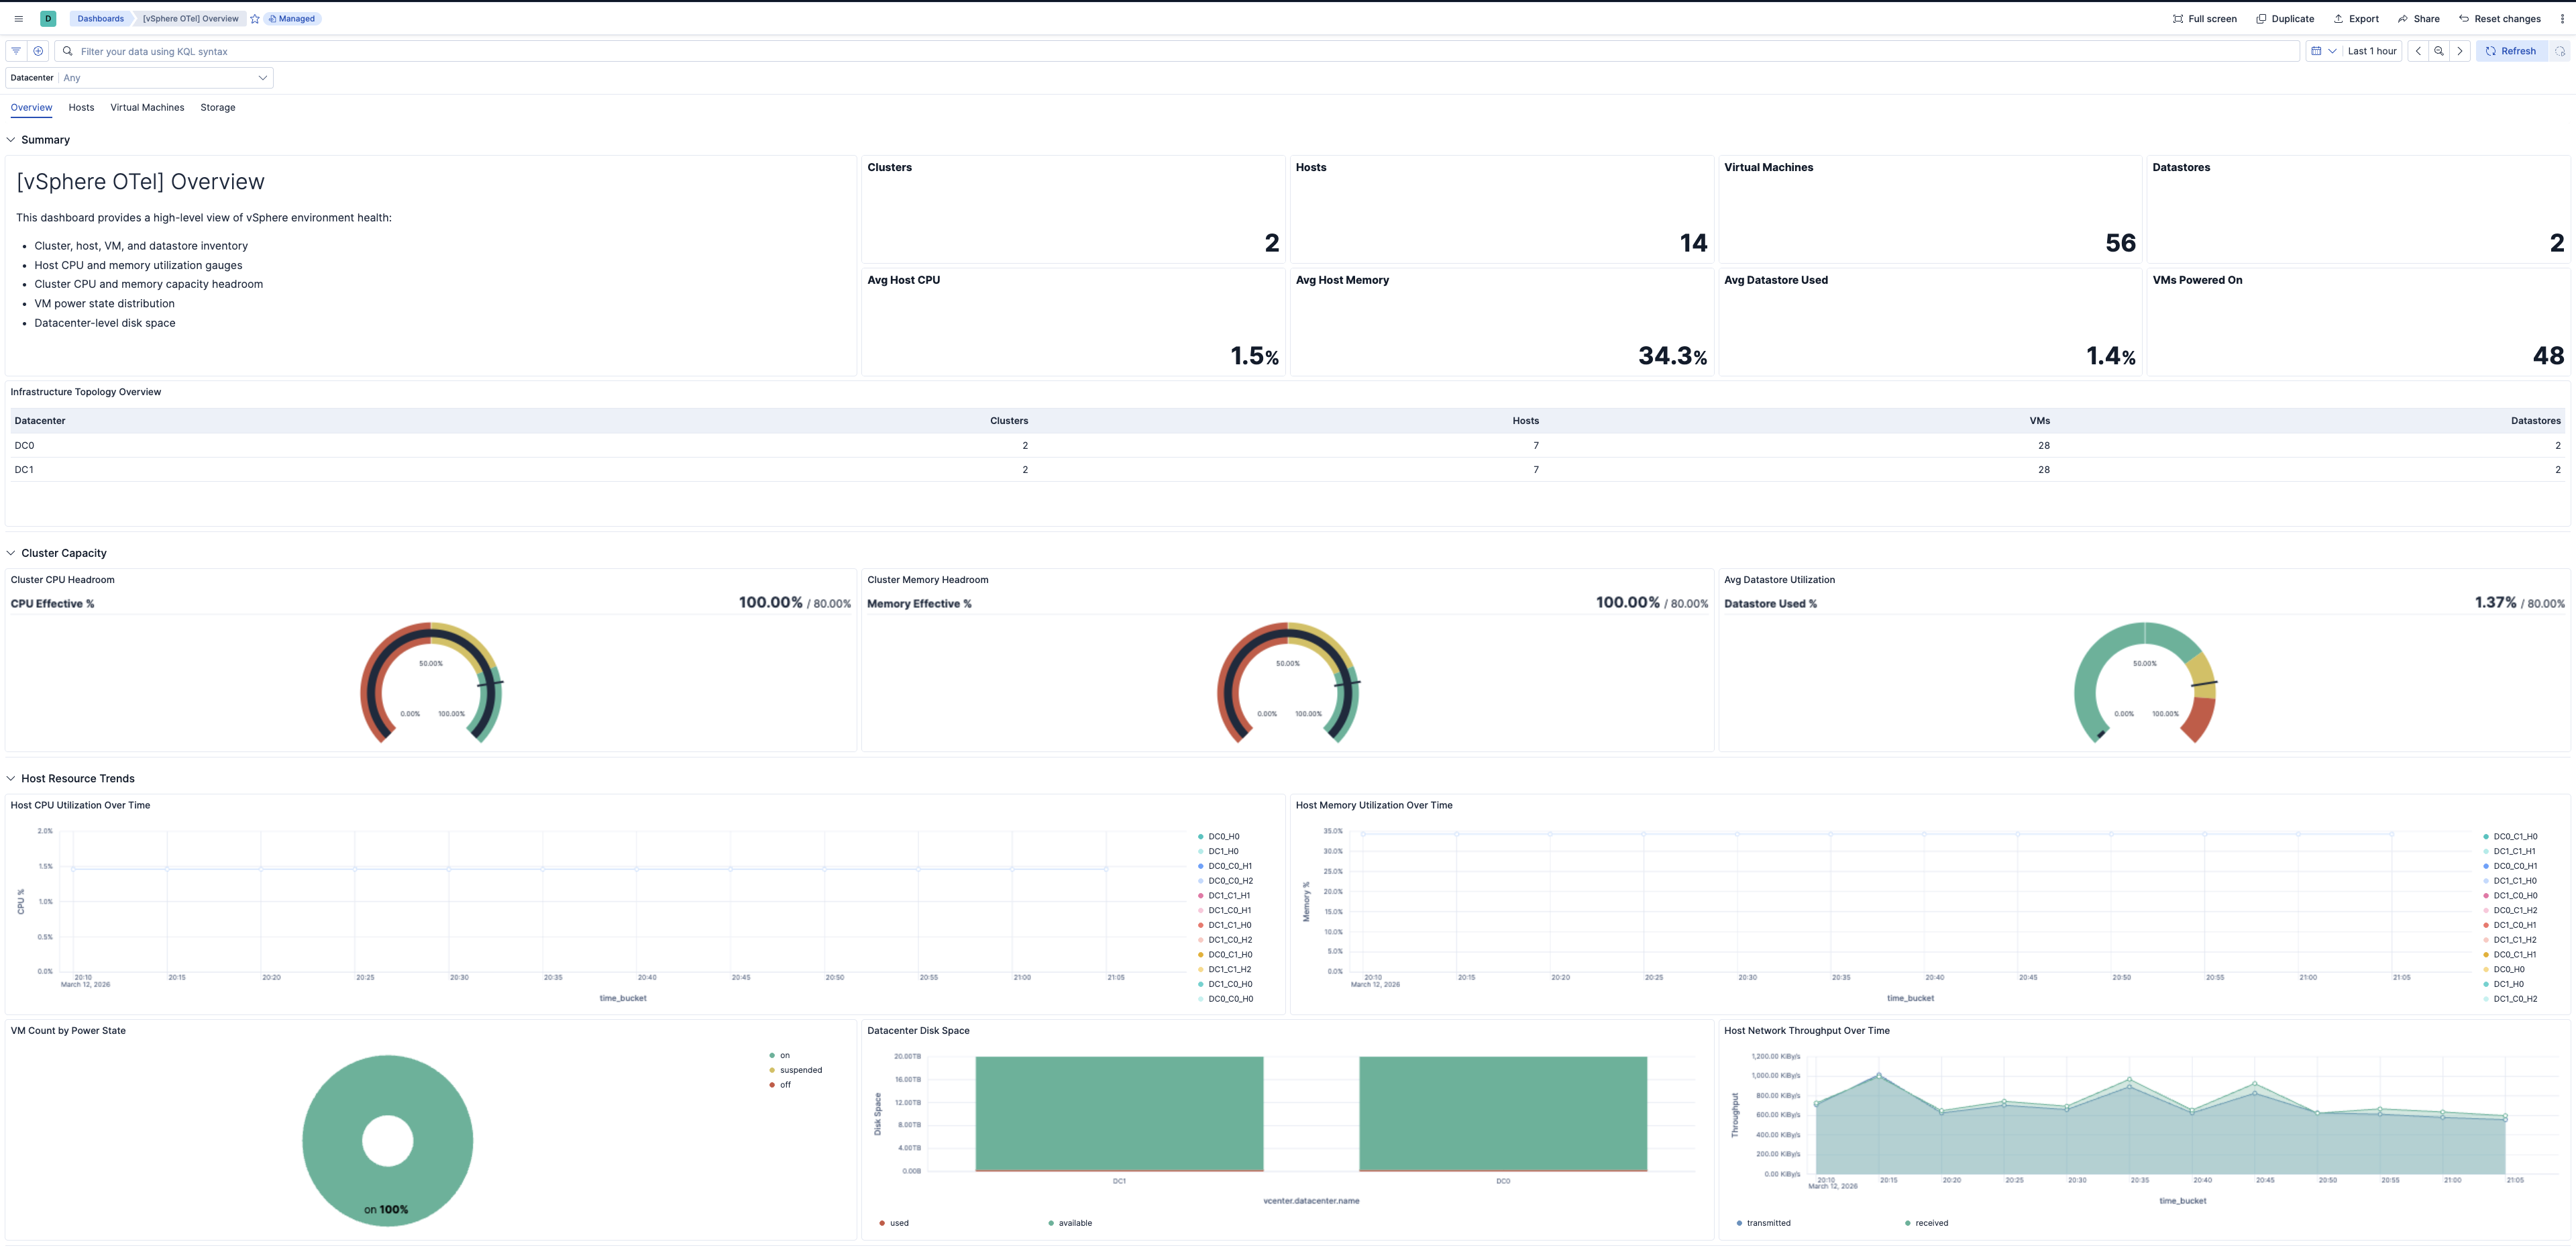
| **[vSphere OTel] Overview** | Infrastructure health, host and VM counts, entity status, and capacity summary. |
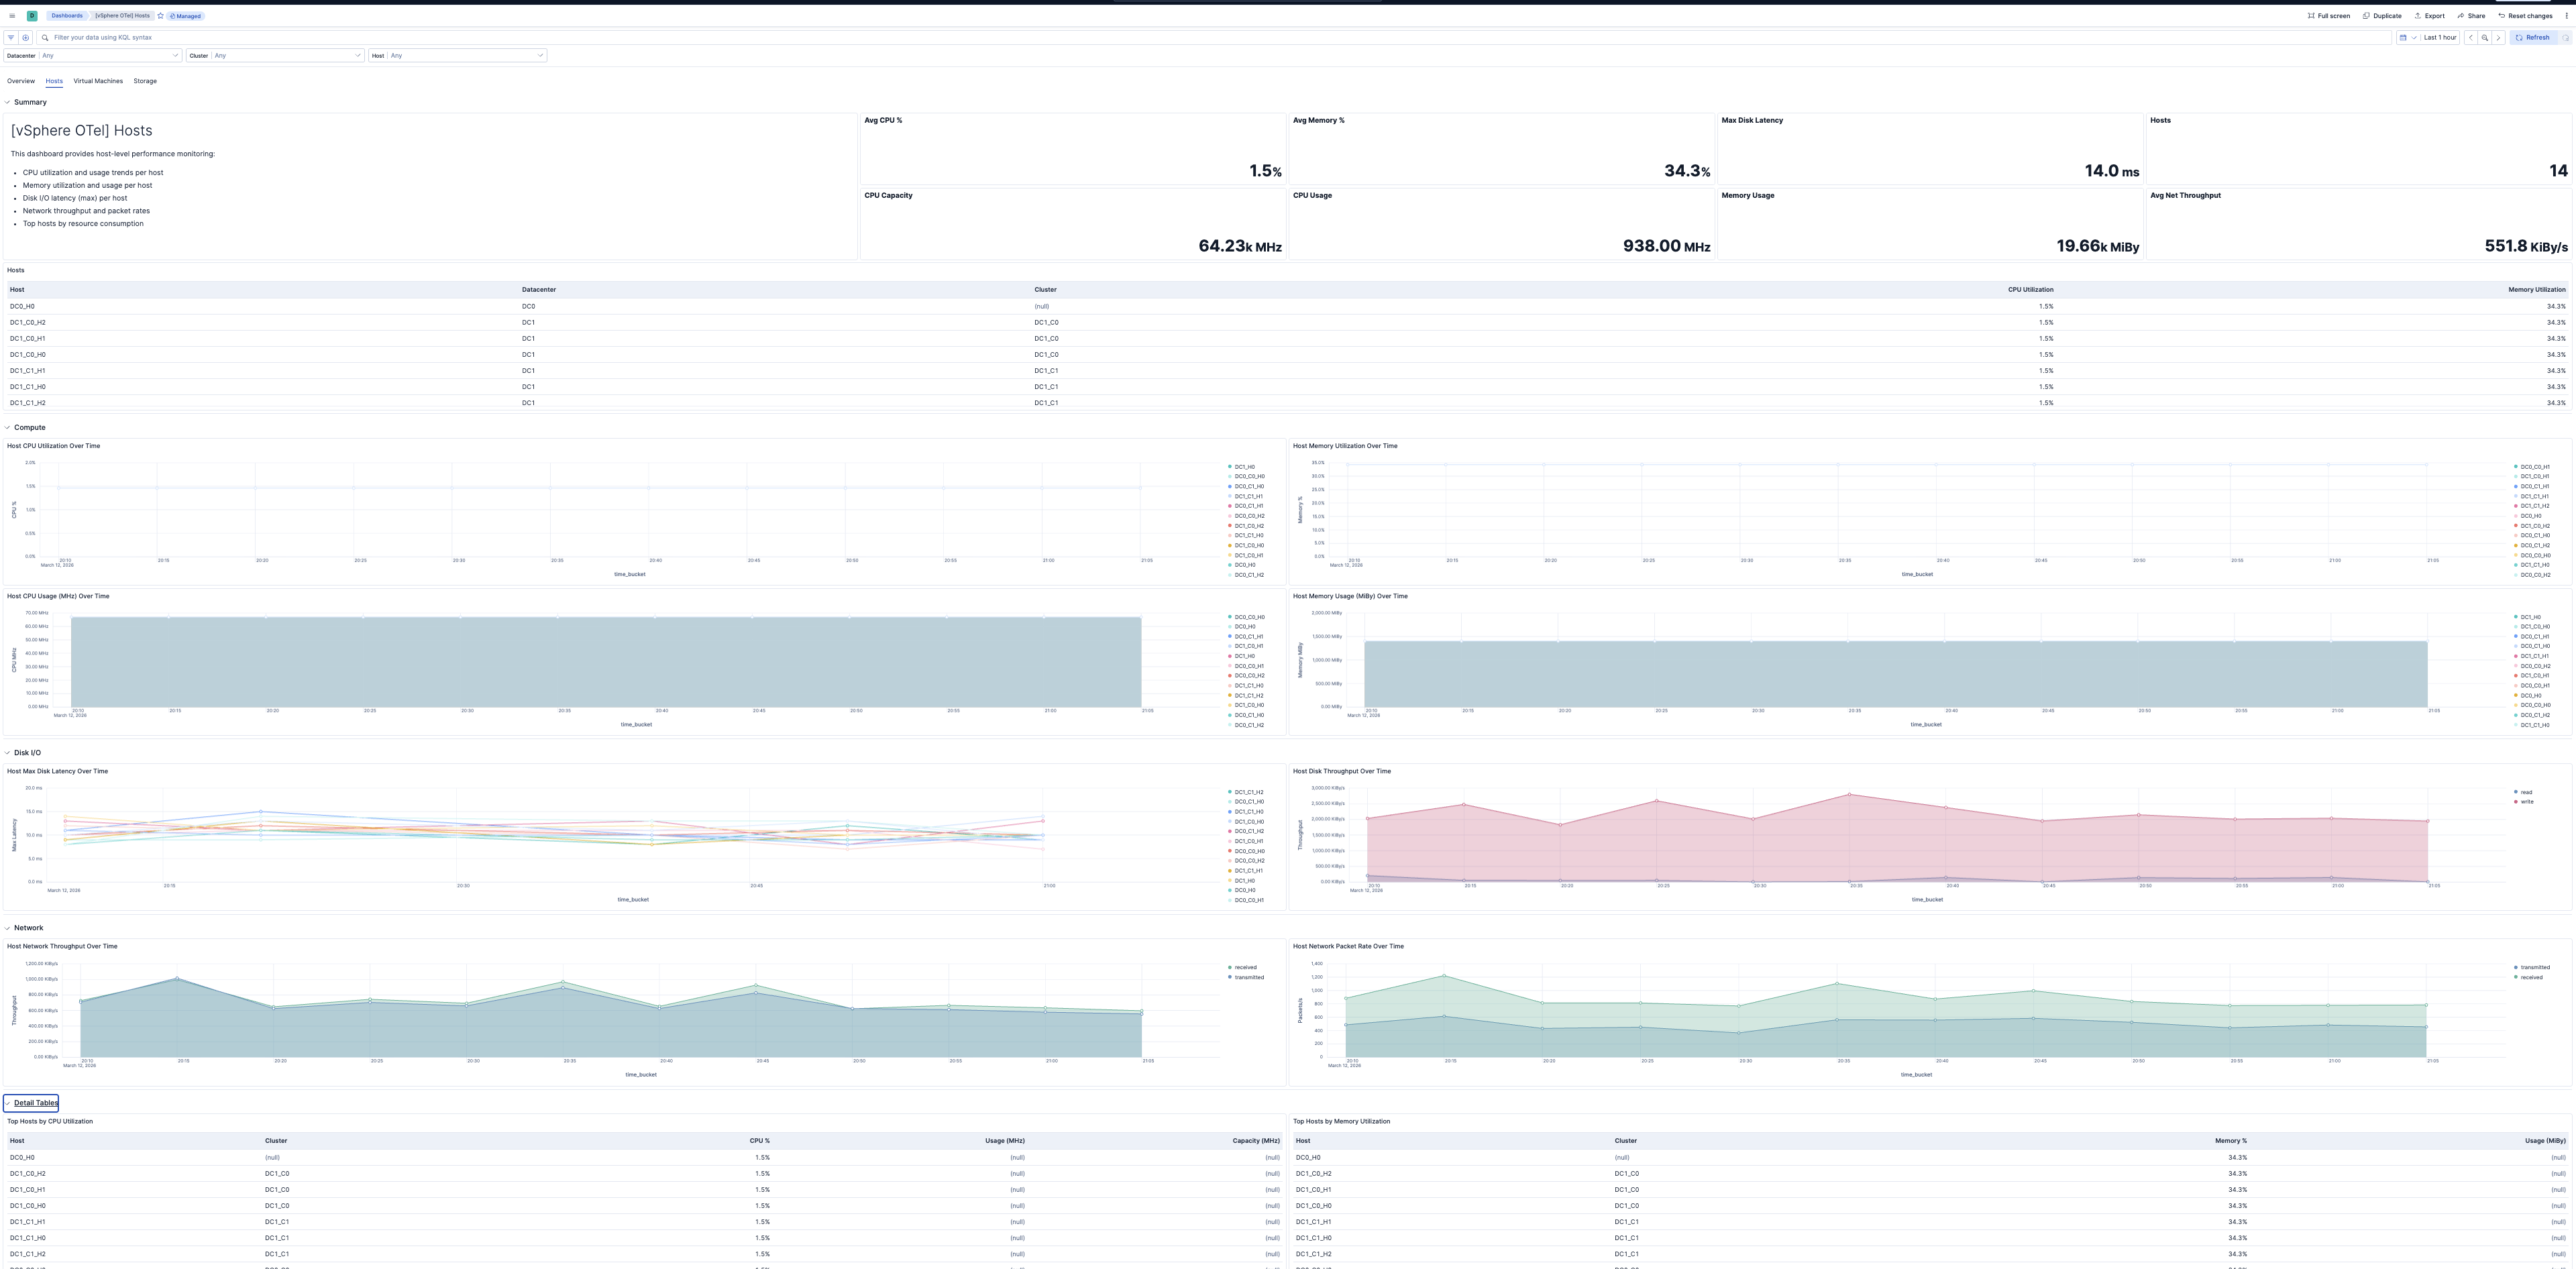
| **[vSphere OTel] Hosts** | ESXi host CPU utilization, memory, disk I/O latency, and network health. |
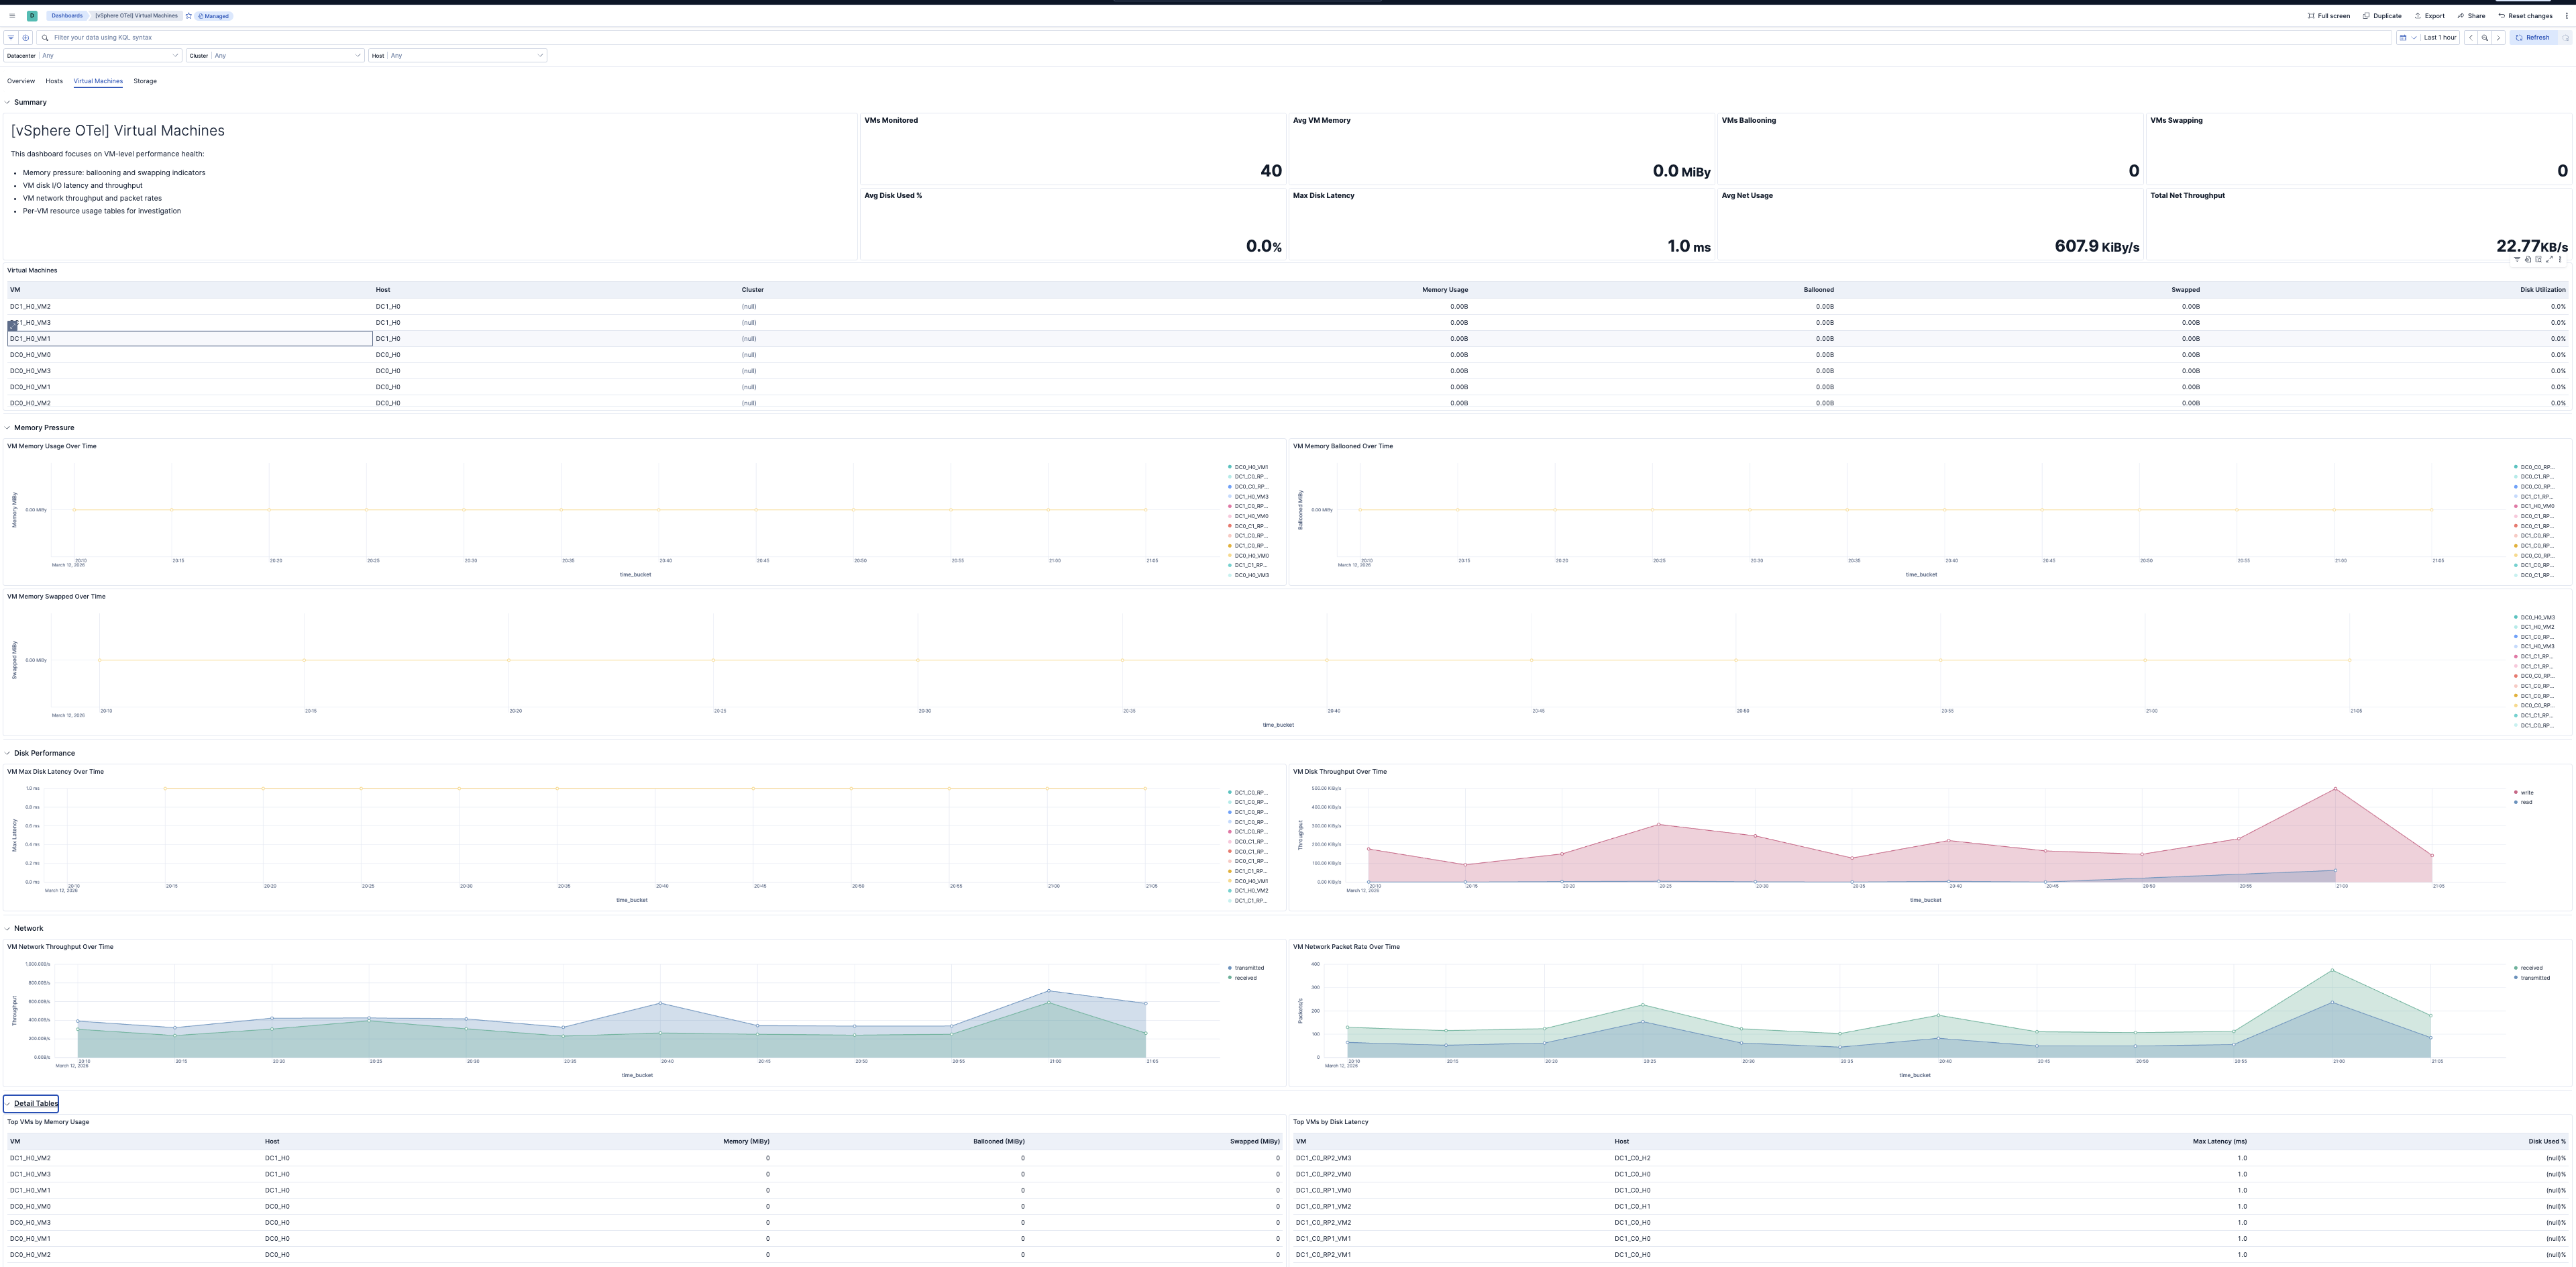
| **[vSphere OTel] Virtual Machines** | VM CPU readiness, memory ballooning and swapping, disk latency, and performance. |
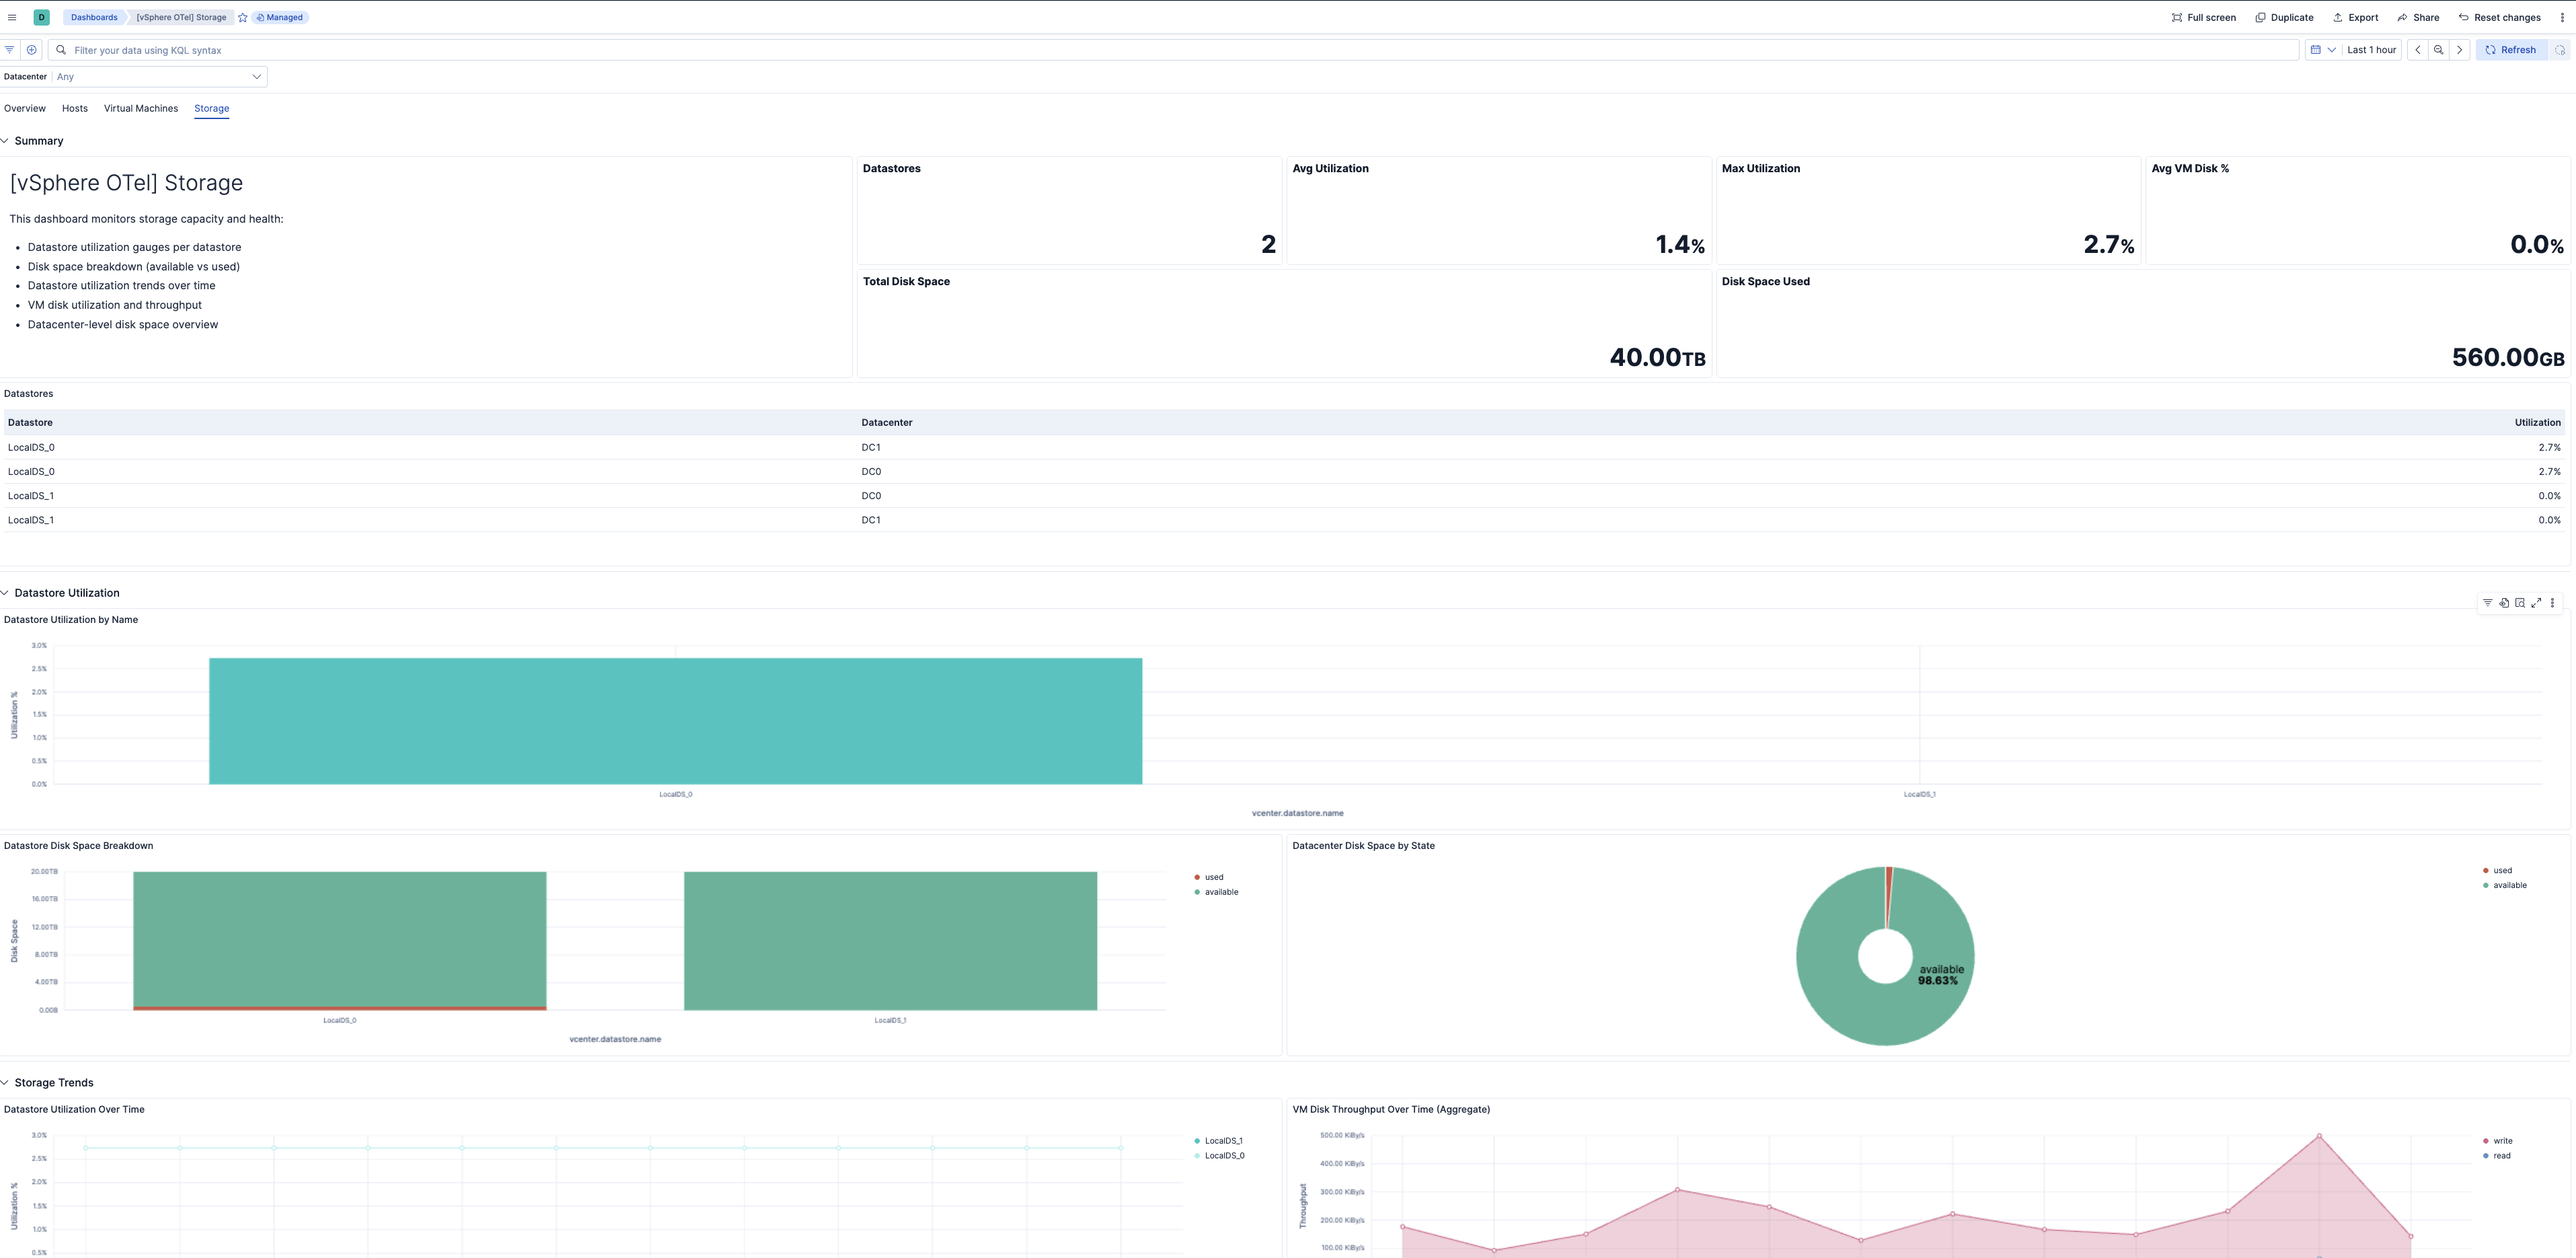
| **[vSphere OTel] Storage** | Datastore capacity, disk utilization, and I/O latency. |
## Alert rules
| Alert | Trigger | Severity |
|-------------------------------------------------|----------------------------------------------------------|----------|
| **[vSphere OTel] VM disk latency high** | VM disk max latency exceeds 20 ms | High |
| **[vSphere OTel] Host disk latency high** | Host disk max latency exceeds 15 ms | High |
| **[vSphere OTel] Host power state unhealthy** | Hosts in off or standby power state | Critical |
| **[vSphere OTel] Entity status unhealthy** | Hosts, VMs, or clusters with yellow or red entity status | Critical |
| **[vSphere OTel] Datastore utilization high** | Datastore disk utilization exceeds 80% | High |
| **[vSphere OTel] Host memory utilization high** | Host memory utilization exceeds 85% | High |
| **[vSphere OTel] Host CPU utilization high** | Host CPU utilization exceeds 80% | High |
| **[vSphere OTel] VM memory swapping** | VMs with memory swapped to disk (non-zero) | Critical |
| **[vSphere OTel] VM memory ballooning** | VMs with memory ballooned (non-zero) | High |
## SLO templates
| SLO | Target | Window | Description |
|--------------------------------------------------------------------------------|--------|----------------|----------------------------------------------------------------------------------|
| **[vSphere OTel] VM CPU readiness below 5% 99.5% rolling 30 days** | 99.5% | 30-day rolling | Percentage of 1-minute intervals where average VM CPU readiness is below 5%. |
| **[vSphere OTel] Average host disk latency below 15 ms 99.5% rolling 30 days** | 99.5% | 30-day rolling | Percentage of 1-minute intervals where average host disk latency is below 15 ms. |
## Screenshots
This integration includes one or more Kibana dashboards that visualizes the data collected by the integration. The screenshots below illustrate how the ingested data is displayed.
## Changelog
| Version | Details | Minimum Kibana version |
|-----------|----------------------------------------------------------------------------------------------------------------------------------------------------|------------------------|
| **0.1.0** | **Enhancement** ([View pull request](https://github.com/elastic/integrations/pull/17802))Initial draft of the vSphere OpenTelemetry Assets Package | 9.3.0 |