User activity
The user activity service records user actions in Kibana by writing structured log events. It helps you keep a durable record of what happened, to what object, and by whom.
This functionality is not part of the Kibana audit log. The Kibana audit log is a separate feature. For more information, refer to Kibana audit events.
The service is disabled by default. Configure it under user_activity in kibana.yml:
user_activity:
  enabled: true
  appenders:
    console_json_default_appender:
      type: console
      layout:
        type: json
  filters:
    - policy: keep
      actions: [user_logged_in]
user_activity.enabled: Enables or disables emitting user activity events.user_activity.appenders: Logging appenders used by the service. This uses the same appender schema as Kibana logging. For more details, refer to Logging settings. By default, it uses a JSON console appender.user_activity.filters: Optional list of filter rules applied toevent.action.
When enabled, events are logged under the logger context user_activity.event and include the fields { message, event, object, metadata, error, user, session, ...}.
Filters are evaluated with AND semantics: for an activity to be logged, its event.action must pass all configured filter rules.
Each filter has:
policy:keepordropactions: list of action IDs (see Available actions)
keep allows only actions listed in actions. drop excludes actions listed in actions. If you don’t configure any filters, all actions are eligible to be logged.
| Action | Description |
|---|---|
log_in_user |
User logged in to Kibana. |
log_out_user |
User logged out of Kibana. |
| Action | Description |
|---|---|
dashboard_create |
User saved a dashboard for the first time. |
dashboard_delete |
User deleted a dashboard. |
dashboard_refresh |
Dashboard panels refreshed after a user action, such as applying a filter, changing the time range, or opening a dashboard with a relative time range. Panels can also refresh automatically at the configured interval. The event measures the time from when the query starts until the last panel finishes loading. |
dashboard_update |
User edited an existing dashboard and saved the changes. |
dashboard_view |
User opened a dashboard. This action can also trigger dashboard_refresh when Kibana needs to query panel data, such as when the dashboard uses a relative time range. |
All dashboard actions include the common log fields and populate object.id, object.name, object.type, and object.tags. The object.type value is dashboard, and object.tags contains the dashboard tag names.
dashboard_view sets event.type to access. event.start and event.end are ISO8601 timestamps, and event.duration, measured in nanoseconds, records each continuous period that the dashboard is visible. A period ends when the user navigates away, closes or reloads the tab, or switches browser tabs.
dashboard_refresh sets event.type to access. event.start and event.end are ISO8601 timestamps, and event.duration is measured in nanoseconds. event.outcome is success when no panels return blocking errors and failure otherwise.
Each automatic refresh produces a separate dashboard_refresh event. Short refresh intervals can therefore increase the volume of user activity logs.
The action also populates the following metadata fields:
| Field | Description |
|---|---|
metadata.time_range |
(Optional) Dashboard time range at the time of the refresh. |
metadata.refresh_interval |
(Optional) Auto-refresh interval in milliseconds. This field is omitted when auto-refresh is paused. |
metadata.query |
(Optional) Dashboard query, including its expression and language. The language is kql or lucene. |
metadata.filters |
(Optional) List of dashboard filters. |
metadata.panel_count |
Number of panels on the dashboard. |
metadata.errors |
List of panels with blocking errors. Each item contains the panel ID in panel_id and the error message in error. The list is empty when no panels return blocking errors. |
Dashboard query expressions and filter values are recorded without redaction. Manage access to and retention of user activity logs according to your organization's data-handling requirements.
When metadata.errors is not empty, error.type is panel_errors and error.message contains the error list as JSON.
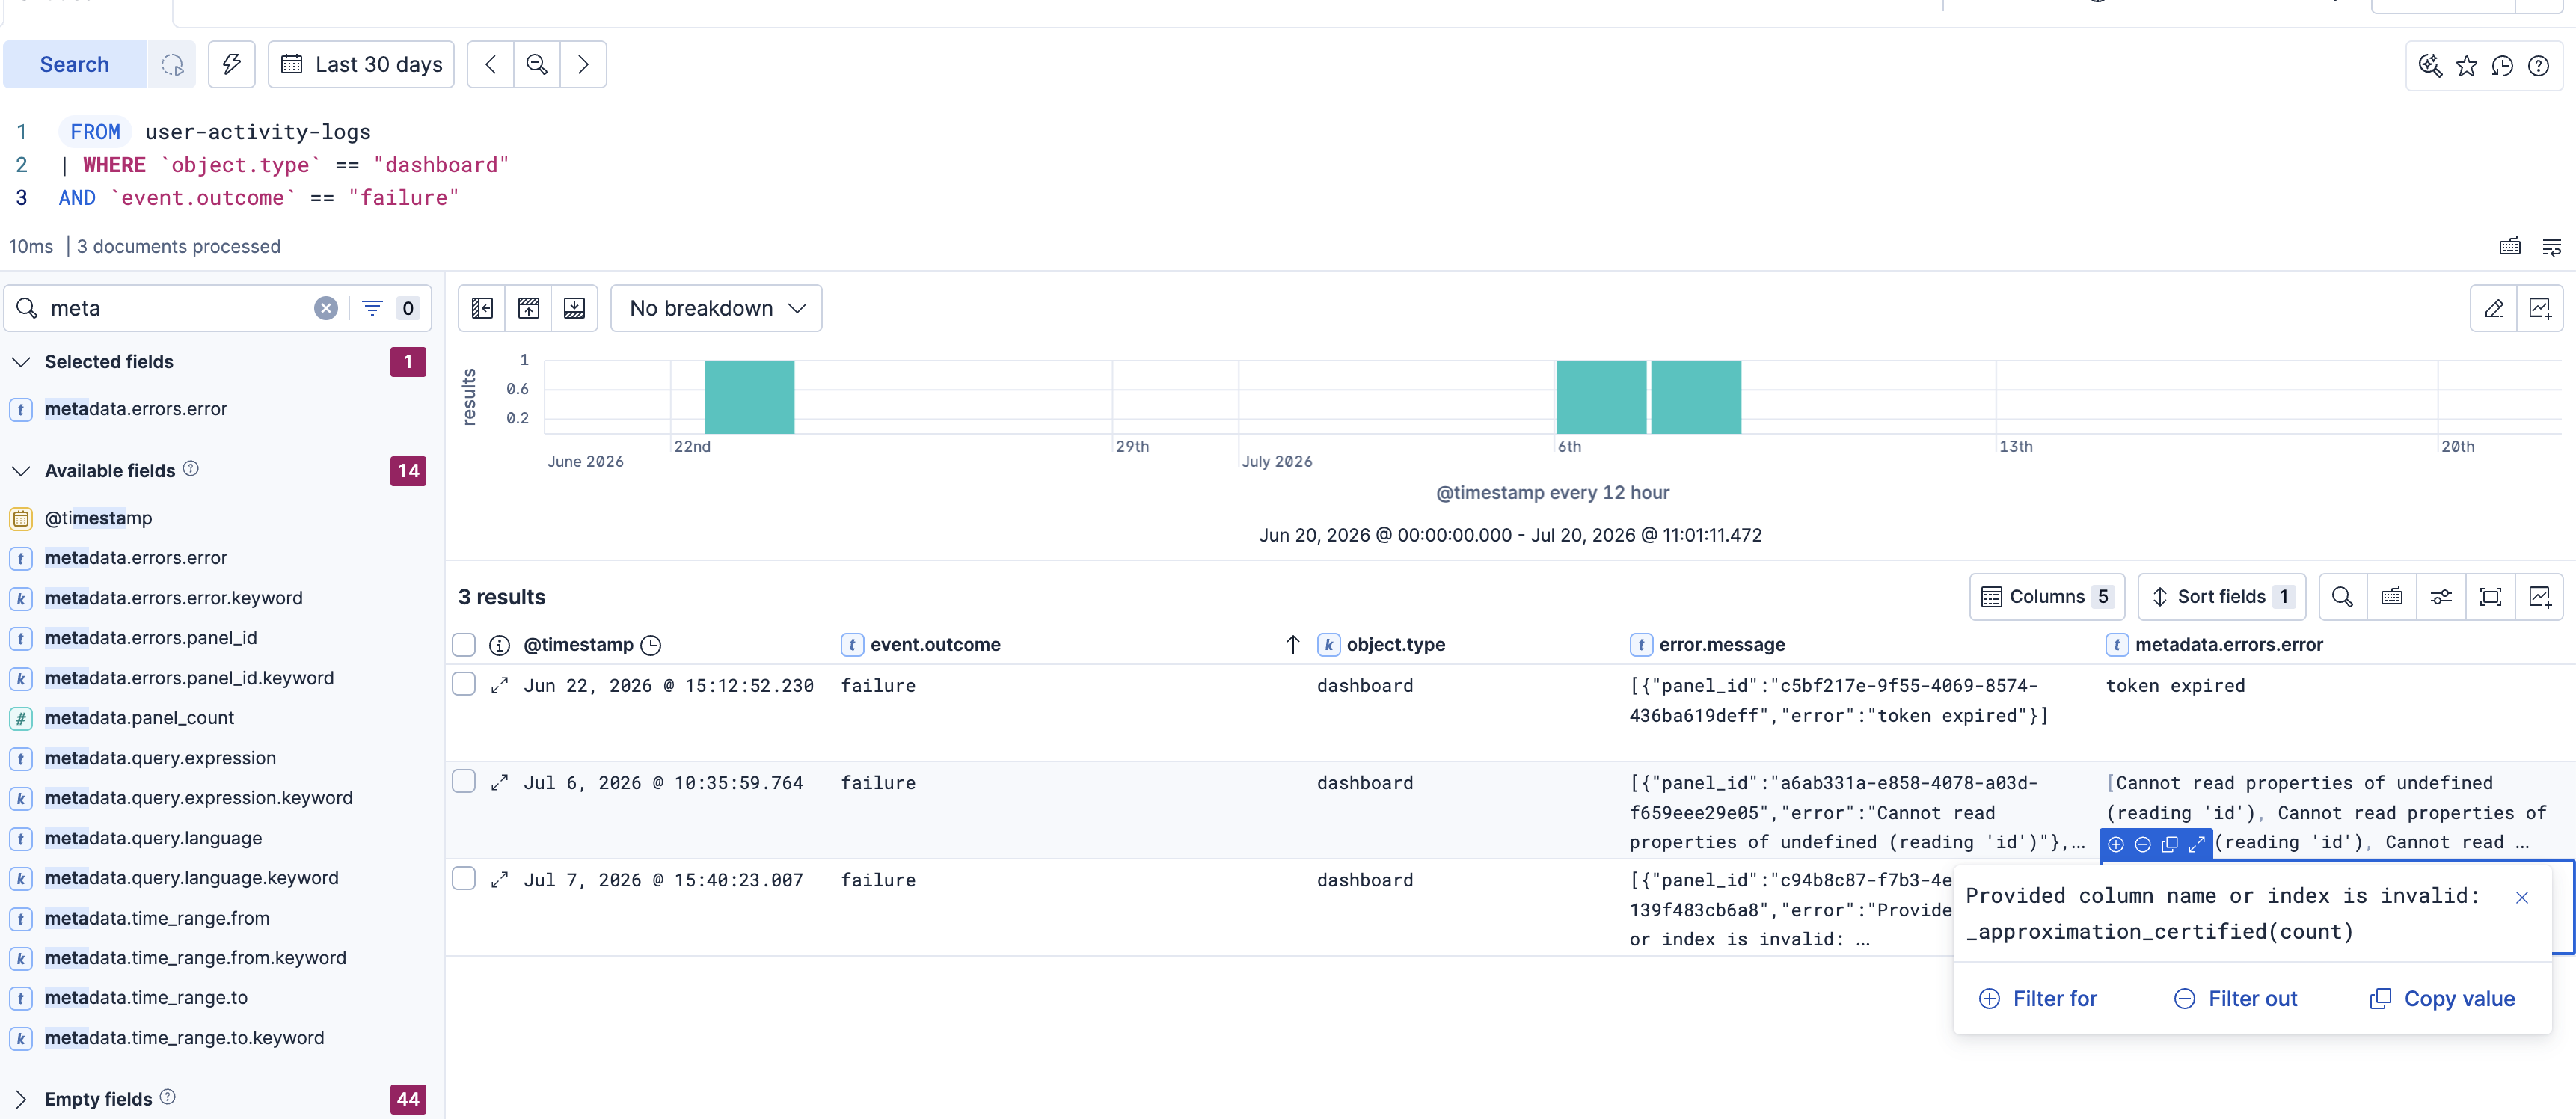
This example uses a custom user-activity-logs index. User activity events are emitted through the configured logging appenders and are not indexed automatically. To explore them in Discover, route the events to Elasticsearch using your existing log collection pipeline. Your index or data stream name depends on that configuration.
User activity events are written as JSON log entries. When using the JSON logging layout, these entries are ECS-compatible (see Elastic Common Schema (ECS)) and may include additional non-ECS fields used by Kibana (for example, kibana.space.id and object.*).
| Field | Description |
|---|---|
@timestamp |
The timestamp of the event. |
message |
Human readable description of the action performed. |
| Field | Description |
|---|---|
event.action |
Human readable standardized description of the action performed. Refer to Available actions for a list of possible values. |
event.type |
Human readable standardized categorization of actions performed. |
event.outcome |
(Optional) Denotes whether the event represents a success or a failure from the perspective of the entity that produced the event: success, failure, or unknown. |
event.start |
(Optional) ISO8601 timestamp of the event start time. |
event.end |
(Optional) ISO8601 timestamp of the event end time. |
event.duration |
(Optional) Duration (in ns) between the event start and end timestamps. |
| Field | Description |
|---|---|
trace.id |
Correlation id for events that happen together (for example, events for the same HTTP request). |
| Field | Description |
|---|---|
session.id |
Redacted id of the session. |
| Field | Description |
|---|---|
kibana.space.id |
ID of the space where the action originates from. |
| Field | Description |
|---|---|
user.id |
Unique identifier of the user. |
user.name |
Username of the user. |
user.email |
Email address of the user at the time of the action. |
user.roles |
Kibana roles of the user at the time of the action. |
Some actions, such as log_in_user and log_out_user, are recorded on unauthenticated requests. For these events, the user.* and session.id fields may not be populated. The identity of the user can still be determined from the object.* fields.
| Field | Description |
|---|---|
client.ip |
IP address of the client that performed the action. |
client.address |
Copy of client.ip for OpenTelemetry compliance. |
http.request.referrer |
Referrer associated with the request that triggered the action. |
| Field | Description |
|---|---|
object.id |
Unique id of the target. |
object.name |
Target resource name. |
object.type |
Target resource type of the action. |
object.tags |
List of tags assigned to the target. |
| Field | Description |
|---|---|
metadata |
(Optional) Additional bucket of non-standard metadata specific to the Kibana usage log. For dashboard refresh metadata, refer to Dashboard event fields. |
| Field | Description |
|---|---|
error.type |
(Optional) The type of the error, for example the class name of the exception. |
error.message |
(Optional) Error message. |
error.stack_trace |
(Optional) The stack trace of this error in plain text. |
error.code |
(Optional) Error code describing the error. |
| Field | Description |
|---|---|
service.id |
The cluster ID. |
service.node.roles |
Roles of Kibana: ["ui", "background_tasks"]. |
service.state |
The status of Kibana. |
service.type |
kibana. |
service.version |
Version of Kibana that emitted the event. |