Kibana advanced settings
Advanced Settings control the behavior of Kibana. You can change the settings that apply to a specific space only, or to all of Kibana. For example, you can change the format used to display dates, specify the default data view, and apply your own branding.
Changing a setting can affect Kibana performance and cause problems that are difficult to diagnose. Setting a property value to a blank field reverts to the default behavior, which might not be compatible with other configuration settings. Deleting a custom setting permanently removes it from Kibana.
Settings on this page are ordered as they appear in Kibana.
You must have the Advanced Settings Kibana privilege to access the Advanced Settings page.
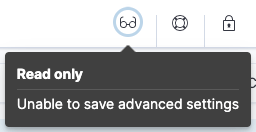
When you have insufficient privileges to edit advanced settings, the edit options are not visible, and the following indicator shows:
To add the privilege, go to the Roles management page using the navigation menu or the global search field.
For more information on granting access to Kibana, refer to Granting access to Kibana.
Change the settings that apply only to a specific Kibana space.
- Go to the Advanced settings page using the navigation menu or the global search field.
- Click Space Settings.
- Scroll or search for the setting.
- Make your change, then click Save changes.
General
- hideAnnouncements
-
Supported on:
Stops showing messages and tours that highlight new features.
Datatype:
boolDefault:
falseNoteIf this setting is set to falsebut thehideAnnouncementssetting located in the Global Settings tab is set totrue, then messages and tours that highlight new features won't show for the current space. - dateFormat
-
Supported on:
The format to use for displaying pretty formatted dates.
Datatype:
string - dateFormat:tz
-
Supported on:
The timezone that Kibana uses.
Datatype:
stringDefault:
Browser - dateFormat:scaled
-
Supported on:
The values that define the format to use to render ordered time-based data. Formatted timestamps must adapt to the interval between measurements. Keys are ISO8601 intervals.
Datatype:
string - dateFormat:dow
-
Supported on:
The day that a week should start on.
Datatype:
string - dateNanosFormat
-
Supported on:
The format to use for displaying pretty formatted dates of Elasticsearch date_nanos type.
Datatype:
string - theme:darkMode
-
Supported on:
The UI theme that the Kibana UI should use. Set to
enabledordisabledto enable or disable the dark theme. Set tosystemto have the Kibana UI theme follow the system theme. You must refresh the page to apply the setting.The default value depends on your version:
-
Defaults to system. -
Defaults to disabled.
Datatype:
enumOptions:
-
enabled -
disabled -
system
-
- state:storeInSessionStorage
-
Supported on:
Kibana tracks UI state in the URL, which can lead to problems when there is a lot of state information, and the URL gets long. Enabling this setting stores part of the URL in your browser session to keep the URL short.
Datatype:
bool - savedObjects:perPage
-
Supported on:
The number of objects to show on each page of the list of saved objects.
Datatype:
intDefault:
20 - savedObjects:listingLimit
-
Supported on:
The number of objects to fetch for lists of saved objects. Do not set above
10000.Datatype:
intDefault:
1000 - csv:separator
-
Supported on:
The separator for exported values.
Datatype:
stringDefault:
, - csv:quoteValues
-
Supported on:
Quotes exported values in CSV exports when activated.
Datatype:
boolDefault:
true - shortDots:enable
-
Supported on:
Shortens long field names in visualizations. For example, shows
f.b.bazinstead offoo.bar.baz.Datatype:
boolDefault:
false - format:defaultTypeMap
-
Supported on:
A map of the default format name for each field type. Field types that are not explicitly mentioned use "default".
Datatype:
string - format:number:defaultPattern
-
Supported on:
The numeral pattern for the "number" format.
Datatype:
stringDefault:
0,0.[000] - format:percent:defaultPattern
-
Supported on:
The numeral pattern for the "percent" format.
Datatype:
stringDefault:
0,0.[000]% - format:bytes:defaultPattern
-
Supported on:
The default numeral pattern format for the "bytes" format.
Datatype:
stringDefault:
0,0.[0]b - format:currency:defaultPattern
-
Supported on:
The default numeral pattern format for the "currency" format.
Datatype:
stringDefault:
($0,0.[00]) - format:number:defaultLocale
-
Supported on:
The numeral pattern locale.
Datatype:
stringDefault:
en - data_views:fields_excluded_data_tiers
-
Supported on:
Allows the exclusion of listed data tiers when getting a field list for faster performance.
Datatype:
string - data_views:cache_max_age
-
Supported on:
Sets how long data view fields API requests are cached in seconds. A value of 0 turns off caching. Modifying this value might not take immediate effect, users need to clear browser cache or wait until the current cache expires. To get immediate changes, try a hard reload of Kibana.
Datatype:
intDefault:
5 - metaFields
-
Supported on:
Fields that exist outside of
_source. Kibana merges these fields into the document when displaying it.Datatype:
stringDefault:
_source, _id, _index, _score, _ignored - query:queryString:options
-
Supported on:
Options for the Lucene query string parser. Only used when
search:queryLanguageis set to Lucene.Datatype:
string - query:allowLeadingWildcards
-
Supported on:
Allows a wildcard (*) as the first character in a query clause. To disallow leading wildcards in Lucene queries, use
query:queryString:options.Datatype:
boolDefault:
true - search:queryLanguage
-
Supported on:
The query language to use in the query bar. Choices are KQL, a language built specifically for Kibana, and the Lucene query syntax.
Datatype:
stringDefault:
KQL - sort:options
-
Supported on:
Options for the Elasticsearch sort parameter.
Datatype:
string - defaultIndex
-
Supported on:
The default data view to access if none is set in Discover and Dashboards.
Datatype:
stringDefault:
null - histogram:barTarget
-
Supported on:
When date histograms use the
autointerval, Kibana attempts to generate this number of bars.Datatype:
intDefault:
50 - histogram:maxBars
-
Supported on:
Limits the density of date and number histograms across Kibana using a test query to improve performance. When the test query contains too many buckets, the interval between buckets increases. Applies separately to each histogram aggregation, and does not apply to other types of aggregations. To find the maximum value, divide the Elasticsearch
search.max_bucketsvalue by the maximum number of aggregations in each visualization.Datatype:
intDefault:
1000 - history:limit
-
Supported on:
In fields that have history, such as query inputs, shows this many recent values.
Datatype:
intDefault:
10 - timepicker:refreshIntervalDefaults
-
Supported on:
The default refresh interval for the time filter. Specify the
valueparameter in milliseconds.Datatype:
stringDefault:
{"pause": true, "value": 60000} - timepicker:timeDefaults
-
Supported on:
The default selection in the time filter. Must be an object containing "from" and "to" (refer to accepted formats).
Datatype:
stringDefault:
{"from": "now-15m", "to": "now"} - timepicker:quickRanges
-
Supported on:
The list of ranges to show in the Quick section of the time filter. This must be an array of objects, with each object containing
from,to(refer to accepted formats), anddisplay(the title to be displayed).Datatype:
string - filters:pinnedByDefault
-
Supported on:
Makes filters have a global state and be pinned by default when activated.
Datatype:
boolDefault:
false - filterEditor:suggestValues
-
Supported on:
Enables the filter editor and KQL autocomplete to suggest values for fields.
Datatype:
boolDefault:
true - defaultRoute
-
Supported on:
The default route when opening Kibana. Use this setting to route users to a specific dashboard, application, or saved object as they enter each space.
Datatype:
string - fileUpload:maxFileSize
-
Supported on:
Sets the file size limit when importing files. The highest supported value for this setting is
1GB.Datatype:
stringDefault:
100MB - enableESQL
-
Supported on:
Enables ES|QL in Kibana.
When deactivated, hides the ES|QL user interface from various applications. However, users can still access existing ES|QL-based Discover sessions, visualizations, and other objects.
Datatype:
boolDefault:
true - metrics:max_buckets
-
Supported on:
Affects the TSVB histogram density. Must be set higher than
histogram:maxBars.Datatype:
intDefault:
2000 - metrics:allowStringIndices
-
Supported on:
Enables you to use Elasticsearch indices in TSVB visualizations.
Datatype:
boolDefault:
false - fields:popularLimit
-
Supported on:
The top N most popular fields to show.
Datatype:
intDefault:
10 - aiAssistant:preferredAIAssistantType
-
Supported on:
This setting allows you to choose which AI Assistants are available to use and where. You can choose to only show the AI Assistants in their solutions, in other Kibana applications (for example, Discover, Dashboards, and Stack Management pages), or nowhere.
Datatype:
stringNoteConfigure the aiAssistant:preferredAIAssistantTypesetting from the GenAI Settings page, which you can find using the Classic navigation menu or the global search field. Note that this setting is unavailable from the GenAI Settings page when using a solution view.
Presentation Labs
- labs:dashboard:deferBelowFold
-
Supported on:
Enables deferred loading of dashboard panels below the fold. Below the fold refers to panels that are not immediately visible when you open a dashboard, but become visible as you scroll.
Datatype:
boolDefault:
falseNoteFrom version 9.4.3, all panels load immediately regardless of this setting. Deferred loading of below-the-fold panels is disabled because enabling it can cause some dashboards to fail to load.
- labs:canvas:byValueEmbeddable
-
Enables support for by-value embeddables in Canvas.
Datatype:
boolDefault:
true - labs:dashboard:enable_ui
-
Provides access to the experimental Labs features for Dashboard when activated.
Datatype:
boolDefault:
false - labs:canvas:enable_ui
-
Provides access to the experimental Labs features for Canvas when activated.
Datatype:
boolDefault:
false
Accessibility
- accessibility:disableAnimations
-
Supported on:
Turns off all optional animations in the Kibana UI. Refresh the page to apply the changes.
Datatype:
boolDefault:
false
Autocomplete
- autocomplete:valueSuggestionMethod
-
Supported on:
The method to retrieve values for KQL autocomplete suggestions.
- When set to
terms_enum, autocomplete uses the terms enum API for value suggestions. Kibana returns results faster, but suggestions are approximate, sorted alphabetically, and can be outside the selected time range. (Note that this API is incompatible with Document-Level-Security.) - When set to
terms_agg, Kibana uses a terms aggregation for value suggestions, which is slower, but suggestions include all values that optionally match your time range and are sorted by popularity.
Datatype:
enumDefault:
terms_enumOptions:
-
terms_enum -
terms_agg
- When set to
- autocomplete:useTimeRange
-
Supported on:
When off, autocomplete suggestions come from your data set instead of the time range.
Datatype:
boolDefault:
true
Banners
Banners are a subscription feature.
-
Supported on:
The placement of the banner for this space. Set to
Topto display a banner above the Elastic header. Uses the value of thexpack.banners.placementconfiguration property by default.Datatype:
string -
Supported on:
The text to display inside the banner for this space, either plain text or Markdown. Uses the value of the
xpack.banners.textContentconfiguration property by default.Datatype:
string -
Supported on:
The color for the banner text for this space. Uses the value of the
xpack.banners.textColorconfiguration property by default.Datatype:
string -
Supported on:
The color for the banner link text for this space. Uses the value of the
xpack.banners.linkColorconfiguration property by default.Datatype:
string -
Supported on:
The color of the banner background for this space. Uses the value of the
xpack.banners.backgroundColorconfiguration property by default.Datatype:
string
Cases
- cases:maxOpenCasesPerRuleRun
-
Supported on:
Sets the upper limit for how many new cases the Cases connector can open during a single detection rule run. It applies when the rule has a Cases action. Values must be between 1 and 1000. Very high values can add load on Kibana and Elasticsearch.
Datatype:
intDefault:
20NoteThis setting does not apply to Attack Discovery, which uses its own case-creation limit.
Discover
- doc_table:highlight
-
Supported on:
Highlights search results in Discover and Discover session panels on dashboards. Highlighting slows requests when working on large documents.
Datatype:
boolDefault:
true - defaultColumns
-
Supported on:
The columns that appear by default on the Discover page. When empty, displays a summary of the document.
Datatype:
string - discover:defaultEsqlQuery
-
The ES|QL query that Discover starts with when opening in ES|QL mode. When set, it takes precedence over the query Discover would otherwise derive from your data sources. Leave empty to use the default behavior.
Datatype:
string - discover:maxDocFieldsDisplayed
-
Supported on:
Specifies the maximum number of fields to show in the document column of the Discover table.
Datatype:
intDefault:
200 - discover:sampleSize
-
Supported on:
Sets the maximum number of rows for the entire document table. This is the maximum number of documents fetched from Elasticsearch.
Datatype:
intDefault:
500 - discover:sampleRowsPerPage
-
Supported on:
Limits the number of rows per page in the document table.
Datatype:
intDefault:
100 - discover:sort:defaultOrder
-
Supported on:
The default sort direction for time-based data views.
Datatype:
stringDefault:
Descending - discover:searchOnPageLoad
-
Supported on:
Controls whether a search runs when Discover first loads. This setting does not have an effect when loading a saved Discover session.
Datatype:
boolDefault:
true - doc_table:hideTimeColumn
-
Supported on:
Hides the "Time" column in Discover and in all Discover session panels on dashboards.
Datatype:
boolDefault:
false - context:defaultSize
-
Supported on:
The number of surrounding entries to display in the context view.
Datatype:
intDefault:
5 - context:step
-
Supported on:
The number by which to increment or decrement the context size.
Datatype:
intDefault:
5 - context:tieBreakerFields
-
Supported on:
A comma-separated list of fields to use for breaking a tie between documents that have the same timestamp value. The first field that is present and sortable in the current data view is used.
Datatype:
stringDefault:
_doc - discover:modifyColumnsOnSwitch
-
Supported on:
Removes columns that are not in the newly selected data view when changing data views.
Datatype:
boolDefault:
true - discover:showFieldStatistics
-
Supported on:
Enables the Field statistics view. Examine details such as the minimum and maximum values of a numeric field or a map of a geo field.
Datatype:
boolDefault:
true - discover:showMultiFields
-
Supported on:
Controls the display of multi-fields in the expanded document view. This option is only available when
searchFieldsFromSourceis off.Datatype:
boolDefault:
false - discover:rowHeightOption
-
Supported on:
The number of lines to allow in a row. A value of -1 automatically adjusts the row height to fit the contents. A value of 0 displays the content in a single line.
Datatype:
intDefault:
3
Machine Learning
- ml:anomalyDetection:results:enableTimeDefaults
-
Supported on:
Uses the default time filter in the Single Metric Viewer and Anomaly Explorer when activated. When deactivated, shows results for the full time range.
Datatype:
boolDefault:
false - ml:anomalyDetection:results:timeDefaults
-
Supported on:
The default time filter for viewing anomaly detection job results. Must contain from and to values (refer to accepted formats). Ignored unless the
ml:anomalyDetection:results:enableTimeDefaultssetting is activated.Datatype:
stringDefault:
{"from": "now-15m", "to": "now"}
Notifications
-
Supported on:
A custom banner intended for temporary notices to all users. Supports Markdown syntax.
Datatype:
string -
Supported on:
The duration, in milliseconds, for banner notification displays.
Datatype:
intDefault:
3000000 - notifications:lifetime:error
-
Supported on:
The duration, in milliseconds, for error notification displays.
Datatype:
intDefault:
300000 - notifications:lifetime:warning
-
Supported on:
The duration, in milliseconds, for warning notification displays.
Datatype:
intDefault:
10000 - notifications:lifetime:info
-
Supported on:
The duration, in milliseconds, for information notification displays.
Datatype:
intDefault:
5000
Observability
- ai:anonymizationSettings
-
Supported on:
List of anonymization rules for AI Assistant. Includes rules for Named Entity Recognition (NER) models and regular expression patterns to identify and anonymize sensitive data.
Default configuration{ "rules": [ { "entityClass": "EMAIL", "type": "RegExp", "pattern": "([a-zA-Z0-9._%+-]+@[a-zA-Z0-9.-]+\\.[a-zA-Z]{2,})", "enabled": false }, { "type": "NER", "modelId": "elastic__distilbert-base-uncased-finetuned-conll03-english", "enabled": false, "allowedEntityClasses": [ "PER", "ORG", "LOC" ], "timeoutSeconds": 30 } ] }Datatype:
string - observability:logSources
-
Supported on:
Sources to use for logs data. If the data of these indices is not logs data, you can experience degraded functionality. Changes to this setting can potentially impact the sources queried in Log Threshold rules.
Datatype:
stringDefault:
logs-*-*, logs-*, filebeat-* - observability:streamsEnableContentPacks
-
Supported on:
Enable Streams content packs.
Datatype:
boolDefault:
false - observability:aiAssistantSimulatedFunctionCalling
-
Supported on:
Simulated function calling does not need API support for functions or tools, but it can decrease performance. Currently always activated for connectors that do not have API support for Native function calling.
Datatype:
boolDefault:
false - observability:aiAssistantSearchConnectorIndexPattern
-
Supported on:
Index pattern used by the AI Assistant when querying search connectors indices (part of the knowledge base). Empty by default: the index for every search connector is queried.
Datatype:
string - observability:newLogsOverview
-
Supported on:
Enable the new logs overview experience.
Datatype:
boolDefault:
true - observability:enableInspectEsQueries
-
Supported on:
When activated, allows you to inspect Elasticsearch queries in API responses.
Datatype:
boolDefault:
false - observability:maxSuggestions
-
Supported on:
Maximum number of suggestions fetched in autocomplete selection boxes.
Datatype:
intDefault:
100 - observability:enableComparisonByDefault
-
Supported on:
Enables the comparison feature by default in the APM app.
Datatype:
boolDefault:
true - observability:apmDefaultServiceEnvironment
-
Supported on:
The default environment for the APM app. When left empty, displays data from all environments by default.
Datatype:
string - observability:apmProgressiveLoading
-
Supported on:
Enables progressive loading of some APM views. Data can be requested with a lower sampling rate first, with lower accuracy but faster response times, while the unsampled data loads in the background.
Datatype:
stringDefault:
Off - observability:apmServiceInventoryOptimizedSorting
-
Supported on:
Sort services without anomaly detection rules on the APM Service inventory page by service name.
Datatype:
boolDefault:
false - observability:apmServiceGroupMaxNumberOfServices
-
Supported on:
Limit the number of services in a given service group.
Datatype:
intDefault:
500 - observability:apmTraceExplorerTab
-
Supported on:
Enable the APM Trace Explorer feature, that allows you to search and inspect traces with KQL or EQL.
Datatype:
boolDefault:
true - observability:apmLabsButton
-
Supported on:
Activates the APM Labs button, a quick way to enable and disable technical preview features in APM.
Datatype:
boolDefault:
false - observability:enableInfrastructureProfilingIntegration
-
Supported on:
Enables the Profiling view in Host details within Infrastructure.
Datatype:
boolDefault:
true - observability:enableInfrastructureAssetCustomDashboards
-
Supported on:
Enables the option to link custom dashboards in the Asset Details view.
Datatype:
boolDefault:
false - observability:enableAwsLambdaMetrics
-
Supported on:
Display Amazon Lambda metrics in the service metrics tab.
Datatype:
boolDefault:
true - observability:apmAgentExplorerView
-
Supported on:
Enable the Agent explorer view.
Datatype:
boolDefault:
true - observability:apmEnableTableSearchBar
-
Supported on:
Enables faster searching in APM tables by adding a handy search bar with live filtering. Available for the following tables: Services, Transactions, and Errors.
Datatype:
boolDefault:
true - observability:apmEnableServiceInventoryTableSearchBar
-
Supported on:
Enables faster searching in the APM Service inventory table by adding a handy search bar with live filtering.
Datatype:
boolDefault:
true - observability:apmAWSLambdaPriceFactor
-
Supported on:
Set the price per Gb-second for your AWS Lambda functions.
Datatype:
stringDefault:
{"x86_64": 0.0000166667,"arm": 0.0000133334} - observability:apmAWSLambdaRequestCostPerMillion
-
Supported on:
Set the AWS Lambda cost per million requests.
Datatype:
floatDefault:
0.2 - observability:apmEnableServiceMetrics
-
Supported on:
Enable the usage of service transaction metrics, which are low cardinality metrics that can be used by certain views like the service inventory for faster loading times.
Datatype:
boolDefault:
true - observability:apmEnableContinuousRollups
-
Supported on:
When continuous rollups is activated, the UI selects metrics with the appropriate resolution. On larger time ranges, lower resolution metrics are used, which improves loading times.
Datatype:
boolDefault:
true - observability:apmEnableCriticalPath
-
Supported on:
When activated, displays the critical path of a trace.
Datatype:
boolDefault:
false - observability:syntheticsThrottlingEnabled
-
Supported on:
Enable the throttling setting in Synthetics monitor configurations. Throttling might still not be available for your monitors even if the setting is active.
Datatype:
boolDefault:
falseWarningThis setting is intended for Elastic-internal use only. Learn more
- observability:enableLegacyUptimeApp
-
Supported on:
By default, the legacy Uptime app is hidden from the interface when it doesn't have any data for more than a week. Enabling this option always shows it.
Datatype:
boolDefault:
false - observability:apmEnableProfilingIntegration
-
Supported on:
Enable the Universal Profiling integration in APM.
Datatype:
boolDefault:
true - observability:profilingShowErrorFrames
-
Supported on:
Show error frames in the Universal Profiling views to indicate stack unwinding failures.
Datatype:
boolDefault:
false - observability:profilingPervCPUWattX86
-
Supported on:
The average amortized per-core power consumption (based on 100% CPU utilization) for x86 architecture.
Datatype:
floatDefault:
7 - observability:profilingPervCPUWattArm64
-
Supported on:
The average amortized per-core power consumption (based on 100% CPU utilization) for arm64 architecture.
Datatype:
floatDefault:
2.8 - observability:profilingDatacenterPUE
-
Supported on:
Data center power usage effectiveness (PUE) measures how efficiently a data center uses energy. The average on-premise data center PUE according to the Uptime Institute survey.
Datatype:
floatDefault:
1.7 - observability:profilingCo2PerKWH
-
Supported on:
Carbon intensity measures how clean your data center electricity is. Specifically, it measures the average amount of CO2 emitted per kilowatt-hour (kWh) of electricity consumed in a particular region. Use the cloud carbon footprint data sheet to update this value according to your region. Defaults to US East (N. Virginia).
Datatype:
float - observability:profilingAWSCostDiscountRate
-
Supported on:
If you're enrolled in the AWS Enterprise Discount Program (EDP), enter your discount rate to update the profiling cost calculation.
Datatype:
float - observability:profilingAzureCostDiscountRate
-
Supported on:
If you have an Azure Enterprise Agreement with Microsoft, enter your discount rate to update the profiling cost calculation.
Datatype:
float - observability:profilingCostPervCPUPerHour
-
Supported on:
Default Hourly Cost per CPU Core for machines not on AWS or Azure.
Datatype:
floatDefault:
0,0425 - observability:apmEnableTransactionProfiling
-
Supported on:
Enables Universal Profiling on Transaction view.
Datatype:
boolDefault:
true - observability:profilingFetchTopNFunctionsFromStacktraces
-
Supported on:
Switch to fetch the TopN Functions from the Stacktraces API.
Datatype:
boolDefault:
false - observability:searchExcludedDataTiers
-
Supported on:
Specify the data tiers to exclude from search, such as data_cold or data_frozen. When configured, indices allocated in the selected tiers are ignored from search requests. Affected apps: APM, Infrastructure.
Datatype:
string - observability:enableDiagnosticMode
-
Supported on:
Enable diagnostic mode for debugging and troubleshooting capabilities. Currently available only in the Service map view.
Datatype:
boolDefault:
false - observability:streamsEnableSignificantEvents
-
Supported on:
Enable streams significant events.
Datatype:
boolDefault:
falseNoteFrom this version, you can no longer control Significant Events availability using this setting.
Reporting
- xpackReporting:customPdfLogo
-
Supported on:
A custom image to use in the footer of the PDF.
Datatype:
string
Rollup
- rollups:enableIndexPatterns
-
Supported on:
Enables the creation of data views that capture rollup indices, which in turn enables visualizations based on rollup data. Refresh the page to apply the changes.
Datatype:
bool
Elasticsearch
- query_activity:minRunningTime
-
Supported on:
The minimum time in milliseconds that a query must be running before it appears on the Query activity page. Increase this value to filter out fast-completing queries and focus on long-running ones.
100by default.Datatype:
intDefault:
100 - courier:ignoreFilterIfFieldNotInIndex
-
Supported on:
Enhances support for dashboards containing visualizations accessing several dissimilar data views. When activated, filters are ignored for a visualization when the visualization's data view does not contain the filtering field. When deactivated, all filters are applied to all visualizations.
Datatype:
boolDefault:
false - courier:setRequestPreference
-
Supported on:
Sets which shards handle your search requests.
- Session ID (default): Restricts operations to execute all search requests on the same shards. This has the benefit of reusing shard caches across requests.
- Custom: Allows you to define your own preference. Use
courier:customRequestPreferenceto customize your preference value. - None: Do not set a preference. This might provide better performance because requests can be spread across all shard copies. However, results might be inconsistent because different shards might be in different refresh states.
Datatype:
stringDefault:
Session ID - courier:customRequestPreference
-
Supported on:
Request preference to use when
courier:setRequestPreferenceusescustom.Datatype:
stringDefault:
_local - courier:maxConcurrentShardRequests
-
Supported on:
Controls the max_concurrent_shard_requests setting used for
_msearchrequests sent by Kibana. Set to 0 to disable this config and use the Elasticsearch default.Datatype:
intDefault:
0 - search:includeFrozen
-
Supported on:
Includes frozen indices in results. Searching through frozen indices might increase the search time.
Datatype:
boolDefault:
false - search:timeout
-
Supported on:
The maximum timeout, in milliseconds, for search requests. To deactivate the timeout and allow queries to run to completion, set to
0.Datatype:
intDefault:
600000
Security solution
- securitySolution:refreshIntervalDefaults
-
Supported on:
The default refresh interval for the Elastic Security app time filter. Must include
pauseandvalue. Specifyvaluein milliseconds.Datatype:
jsonDefault:
{"pause": true, "value": 300000}NoteThe UI time filter overrides the default values.
- securitySolution:timeDefaults
-
Supported on:
The default time range for the Elastic Security app time filter. Must include
fromandto.Datatype:
jsonDefault:
{"from": "now/d","to": "now/d"}NoteRefer to Date Math for information about the syntax. The UI time filter overrides the default values.
- securitySolution:defaultIndex
-
Supported on:
A comma-delimited list of Elasticsearch indices from which the Elastic Security app collects events. The Elastic Security app uses this list to generate the default Security data view. The entity store also extracts entities from these indices.
Index patterns can use wildcards. For example,
filebeat-*matches all indices that start withfilebeat-.If you leave the
-*elastic-cloud-logs-*pattern in the list, Elastic Cloud monitoring logs are excluded from Elastic Security app queries.Datatype:
arrayDefault:
apm-*-transaction*, auditbeat-*, endgame-*, filebeat-*, logs-*, packetbeat-*, traces-apm*, winlogbeat-*, -*elastic-cloud-logs-*NoteThe list can include a maximum of 50 items.
- securitySolution:defaultThreatIndex
-
Supported on:
A comma-delimited list of threat intelligence indices from which the Elastic Security app collects indicators. Features that query these indices include the Threat Intelligence view on the Overview dashboard, indicator match rules, and the alert enrichment query.
Do not remove or overwrite the
logs-ti_*index pattern as it is used by Elastic Agent integrations.Datatype:
arrayDefault:
logs-ti_*NoteThe list can include a maximum of 10 items.
- securitySolution:defaultAnomalyScore
-
Supported on:
The threshold above which machine learning job anomalies are displayed in the Elastic Security app. The value must be between
0and100.Datatype:
intDefault:
50 - securitySolution:enableNewsFeed
-
Supported on:
Enables the security news feed on the Security Overview page.
Datatype:
boolDefault:
true - securitySolution:excludeColdAndFrozenTiersInAnalyzer
-
Supported on:
When on, visual event analyzer queries exclude cold and frozen data tiers. Including that data can slow analyzer queries.
Datatype:
boolDefault:
false - securitySolution:excludeColdAndFrozenTiersInPrevalence
-
Supported on:
Skips cold and frozen tiers in Prevalence queries when activated.
Datatype:
boolDefault:
false - securitySolution:enableGraphVisualization
-
Supported on:
Enables the Graph Visualization feature within the Security solution. When enabled, the graph appears in the Visualization section of the alert and event details flyouts for supported event types, and can be viewed in full-screen.
Datatype:
boolDefault:
false - securitySolution:enableVisualizationsInFlyout
-
Supported on:
Allows you to access the event analyzer and Session View in the Visualize tab on the alert or event details flyout. Refer to the Visualizations section for information on how to access these tools.
Datatype:
boolDefault:
true - securitySolution:enableAlertsAndAttacksAlignment
-
Supported on:
Controls whether Attacks appears in the Elastic Security app navigation, so you can triage Attack Discovery findings next to Alerts.
The default value depends on your version:
-
Defaults to true. -
Defaults to false.
Datatype:
boolNoteThe Attacks view is unavailable on the Elastic AI SOC Engine (EASE) feature tier. Use the dedicated Attack Discovery page instead.
-
- securitySolution:enableAttackDiscoveryWorkflows
-
Supported on:
Enables Attack Discovery workflows for the space. When enabled, Attack Discovery uses workflows to collect alerts and run analysis. This turns on flexible alert retrieval on the Attacks view, workflow and Agent Builder triggers, and AI-assisted query editing and troubleshooting.
Datatype:
boolDefault:
falseNoteAfter you turn the setting on, existing schedules keep their previous configuration until you edit and save them. If you turn the setting off:
- Schedules that already used the workflow settings stop generating and temporarily disappear from the schedule list. Turn the setting on again to restore them.
- Manual runs from the Attacks view always follow the setting's current value.
- securitySolution:enableAssetInventory
-
Supported on:
Enables the Asset Inventory experience within the Security solution. When activated, you can access the Inventory feature through the Security solution navigation.
Datatype:
boolDefault:
falseNoteTurning this setting off does not turn off the entity store or clear persisted entity metadata. To manage or turn off the entity store, go to the Entity analytics management page. Refer to Entity store.
- securitySolution:enableCloudConnector
-
Supported on:
Turns on Cloud Connector deployment for the Cloud Security Posture Management (CSPM) and Cloud Asset Discovery integrations.
The default value depends on your version:
-
Defaults to true. -
Defaults to false.
Datatype:
bool -
- securitySolution:rulesTableRefresh
-
Supported on:
Enables auto refresh on the rules and monitoring tables, in milliseconds.
Datatype:
stringDefault:
{"on": true,"value": 60000} - securitySolution:newsFeedUrl
-
Supported on:
The URL to retrieve the security news feed content from.
Datatype:
stringDefault:
https://feeds.elastic.co/security-solution - securitySolution:ipReputationLinks
-
Supported on:
A JSON array of external sites for verifying an IP address's reputation. The links appear on IP details pages.
Each array element must include:
name: The link's display name.url_template: The link's URL. It can include{{ip}}, which is replaced with the IP address you're viewing.
Default array[ { "name": "virustotal.com", "url_template": "https://www.virustotal.com/gui/search/{{ip}}" }, { "name": "talosIntelligence.com", "url_template": "https://talosintelligence.com/reputation_center/lookup?search={{ip}}" } ]Datatype:
json - securitySolution:enableCcsWarning
-
Supported on:
Controls whether detection rules show a privilege warning when they query a remote cross-cluster search (CCS) index pattern.
Each time a detection rule runs using a remote CCS index pattern, it returns a warning saying that the rule may not have the required read privileges to the remote index. Because privileges cannot be checked across remote indices, this warning displays even when the rule actually does have read privileges to the remote index.
If you've ensured that your detection rules have the required privileges across your remote indices, you can use this setting to disable the warning and reduce noise.
Datatype:
boolDefault:
true - securitySolution:suppressionBehaviorOnAlertClosure
-
Supported on:
Controls whether alert suppression continues or restarts after you close a suppressed alert during an active suppression window.
Datatype:
stringDefault:
Restart suppression - securitySolution:showRelatedIntegrations
-
Supported on:
Shows the related integrations badge on the rules and monitoring tables. If you turn this setting off, related integrations still appear on rule details pages.
Datatype:
boolDefault:
true -
Supported on:
The list of tag options available when you apply tags to detection alerts.
Datatype:
arrayDefault:
Duplicate, False Positive, Further investigation required - securitySolution:detectionsCloseReasons
-
Supported on:
Additional close reason options shown in the closing reason menu when you close an alert or an attack. The same options appear in the closing reason menu when you close a case with Sync alert status with case status turned on. Custom reasons supplement the predefined options (
Duplicate,False positive,True positive,Benign positive, andOther) and must be unique. To learn more, refer to Change an alert's status and Set an alert closing reason when closing a case.Datatype:
arrayDefault:
[] - securitySolution:maxUnassociatedNotes
-
Supported on:
The maximum number of unassociated notes (notes that are not assigned to a Timeline) that can be created. Values must be between
1and10000.Datatype:
intDefault:
1000 - securitySolution:excludedDataTiersForRuleExecution
-
Supported on:
Specifies data tiers to exclude from detection rule queries. Allowed values are
data_coldanddata_frozen. If you specify more than one, separate them with commas. For example:data_frozen,data_cold. Excluding this data might improve rule performance or reduce execution time. This setting does not apply to machine learning rules.Datatype:
arrayDefault:
[]NoteEven when this setting is on, indicator match, event correlation, and ES|QL rules can still fail if a cold or frozen shard that matches the rule's index pattern is unavailable. If that happens, change the rule's index patterns to match only hot-tier data.
- securitySolution:includedDataStreamNamespacesForRuleExecution
-
Supported on:
Restricts which documents detection rules search. Only events whose
data_stream.namespacefield matches one of the specified namespaces are queried. This applies to all detection rules in the Kibana space.Specify namespace strings separated by commas (for example:
namespace1,namespace2). You can include up to 50 namespaces. Leave the setting empty to search all namespaces.Datatype:
arrayDefault:
[]NoteIf rules aren't creating expected alerts or are missing data, check that this setting isn't filtering out the namespaces where your data is stored. Refer to Troubleshoot missing alerts.
- securitySolution:enablePrivilegedUserMonitoring
-
Supported on:
Turns on access to the Entity analytics page and privileged user monitoring.
The default value depends on your version:
-
Defaults to true. -
Defaults to false.
Datatype:
bool -
- securitySolution:enableEsqlRiskScoring
-
Supported on:
When on, entity risk scoring uses ES|QL queries. Turn this setting off to use scripted metrics instead.
Datatype:
boolDefault:
true - securitySolution:defaultAIConnector
-
Supported on:
Default AI connector for serverless AI features (Elastic AI SOC Engine).
Datatype:
stringDefault:
Elastic Managed LLM - securitySolution:defaultValueReportMinutes
-
Supported on:
The average review time in minutes for an analyst to review an alert. Used for calculations in the Value report.
Datatype:
intDefault:
8 - securitySolution:defaultValueReportRate
-
Supported on:
The average hourly rate for a security analyst. Used for calculations in the Value report.
Datatype:
intDefault:
75 - securitySolution:defaultValueReportTitle
-
Supported on:
The title of the Value report.
Datatype:
stringDefault:
Elastic AI value report - securitySolution:enableNewFlyout
-
Supported on:
Enables the new flyout system for document (alert and event), attack, host, user, rule, network, indicator of compromise, misconfigurations, and vulnerabilities details.
Turn this setting off to use the previous flyout layout, which uses right, left, and preview panels instead of a single flyout with child flyouts.
Datatype:
boolDefault:
true - securitySolution:enableRuleChangesHistory
-
Supported on:
Controls whether you can view a chronological history of changes made to a detection rule, compare revisions, and restore a rule to a previous state.
Datatype:
boolDefault:
trueNoteIf you turn the setting off and later turn it back on, any gap in rule revisions from while it was off isn't filled. Capturing rule change history might add a small amount of overhead when rules are created or updated.
Timelion
- timelion:es.timefield
-
Supported on:
The default field containing a timestamp when using the
.es()query.Datatype:
stringDefault:
@timestamp - timelion:es.default_index
-
Supported on:
The default index when using the
.es()query.Datatype:
stringDefault:
_all - timelion:target_buckets
-
Supported on:
Used for calculating automatic intervals in visualizations, this is the number of buckets to try to represent.
Datatype:
intDefault:
200 - timelion:max_buckets
-
Supported on:
The maximum number of buckets a single data source can return. This value is used for calculating automatic intervals in visualizations.
Datatype:
intDefault:
2000 - timelion:min_interval
-
Supported on:
The smallest interval to calculate when using "auto".
Datatype:
stringDefault:
1ms
Visualization
- visualization:heatmap:maxBuckets
-
Supported on:
The maximum number of buckets a datasource can return. High numbers can have a negative impact on your browser rendering performance.
Datatype:
intDefault:
50 - visualization:visualize:legacyHeatmapChartsLibrary
-
Supported on:
Enables legacy charts library for heatmap charts in visualize.
Datatype:
boolDefault:
false - visualization:useLegacyTimeAxis
-
Supported on:
Enables the legacy time axis for charts in Lens, Discover, Visualize, and TSVB.
Datatype:
boolDefault:
true
Developer tools
- devTools:enablePersistentConsole
-
Supported on:
Enables a persistent console in the Kibana UI. This setting does not affect the standard Console in Dev Tools.
Datatype:
boolDefault:
true
Workflows
- workflows:ui:enabled
-
Supported on:
Enables Elastic Workflows and related experiences.
Datatype:
boolDefault:
trueNoteIn this version, the default is
false. - workflows:ui:showManagedWorkflows
-
Supported on:
Shows managed workflows and their executions in workflow experiences.
Datatype:
boolDefault:
false
Change the settings that apply to all of Kibana.
- Go to the Advanced settings page using the navigation menu or the global search field.
- Click Global Settings.
- Scroll or search for the setting.
- Make your change, then click Save changes.
General
- hideAnnouncements
-
Supported on:
Stops showing messages and tours that highlight new features.
Datatype:
boolDefault:
false
Custom branding
Custom branding is a subscription feature.
- xpackCustomBranding:logo
-
Supported on:
A custom image that appears in the header of all Kibana pages. Images must have a transparent background, and 128x128 pixels or smaller.
Datatype:
image - xpackCustomBranding:customizedLogo
-
Supported on:
The custom image that replaces the text next to the logo in the header of all Kibana pages. Images look best when they are no larger than 200 x 84 pixels and have a transparent background.
Datatype:
image - xpackCustomBranding:pageTitle
-
Supported on:
The custom text that appears on Kibana browser tabs.
Datatype:
string - xpackCustomBranding:faviconSVG
-
Supported on:
The URL of a custom SVG image that appears on Kibana browser tabs. Images must be 16x16 pixels.
Datatype:
string - xpackCustomBranding:faviconPNG
-
Supported on:
The URL of a custom PNG image that appears on Kibana browser tabs.
Datatype:
string