Create and manage rules for Elastic Observability
Alerting enables you to define rules, which detect complex conditions within different apps and trigger actions when those conditions are met. Alerting provides a set of built-in connectors and rules for you to use.
All of your alerting rules appear in one list on the Rules page. Open the page from Stack Management → Alerts and insights → Rules, or from Manage rules (or the equivalent link) in Observability, Discover, or Stack Monitoring. Each of these opens the same Rules page, where you can view and manage rules.
Rules use an API key to authorize all background tasks, including condition checks and triggered actions. The key type depends on your deployment. For details on how API keys authorize rules, refer to API keys.
Rules: To create and manage Observability rules, assign
Allprivileges for the relevant Observability features, which vary by rule type, for example, APM, Logs, Infrastructure, or Synthetics. Anomaly detection rules also require Analytics → Machine Learning privileges. For more information, refer to Alerting security requirements.On serverless, assign the Editor role or higher instead. For more information, refer to Assign user roles and privileges. Alerts: To read Observability alerts and perform per-alert actions (such as snooze, unsnooze, and acknowledge) without allowing users to manage rules—assign the Observability Alerts feature privilege (
Allfor full access, orReadfor view and snooze state only). Assign this through Kibana roles on the Elastic Stack, or through a custom role on serverless. For more information, refer to Give access to triage alerts without managing rules.
Learn more about Observability rules and how to create them:
| Rule type | Name | Detects when… |
|---|---|---|
| AIOps | Anomaly detection | Anomalies match specific conditions. |
| APM | APM anomaly | The latency, throughput, or failed transaction rate of a service is abnormal. |
| Observability | Custom threshold | An Observability data type reaches or exceeds a given value. |
| Data set quality | Degraded docs | The percentage of degraded documents for a data view exceeds a threshold |
| Stack | Elasticsearch query | Matches are found during the latest query run. |
| APM | Error count threshold | The number of errors in a service exceeds a defined threshold. |
| APM | Failed transaction rate threshold | The rate of transaction errors in a service exceeds a defined threshold. |
| Metrics | Inventory | The infrastructure inventory exceeds a defined threshold. |
| Logs | Log threshold | An Observability data type reaches or exceeds a given value. |
| Metrics | Metric threshold | An Observability data type reaches or exceeds a given value. |
| APM | Latency threshold | The latency of a specific transaction type in a service exceeds a defined threshold. |
| SLO | SLO burn rate rule | The burn rate is above a defined threshold. |
You start by defining the rule and how often it should be evaluated. You can extend these rules by adding an appropriate action (for example, send an email or create an issue) to be triggered when the rule conditions are met. These actions are defined within each rule and implemented by the appropriate connector for that action e.g. Slack, Jira. You can create any rules from scratch using the Manage Rules page, or you can create specific rule types from their respective UIs and benefit from some of the details being pre-filled (for example, Name and Tags).
- For APM alert types, you can select Alerts and rules and create rules directly from the Services, Traces, and Dependencies UIs.
- For SLO alert types, from the SLOs page open the More actions menu
 for an SLO and select Create new alert rule. Alternatively, when you create a new SLO, the Create new SLO burn rate alert rule checkbox is enabled by default and will prompt you to Create SLO burn rate rule upon saving the SLO.
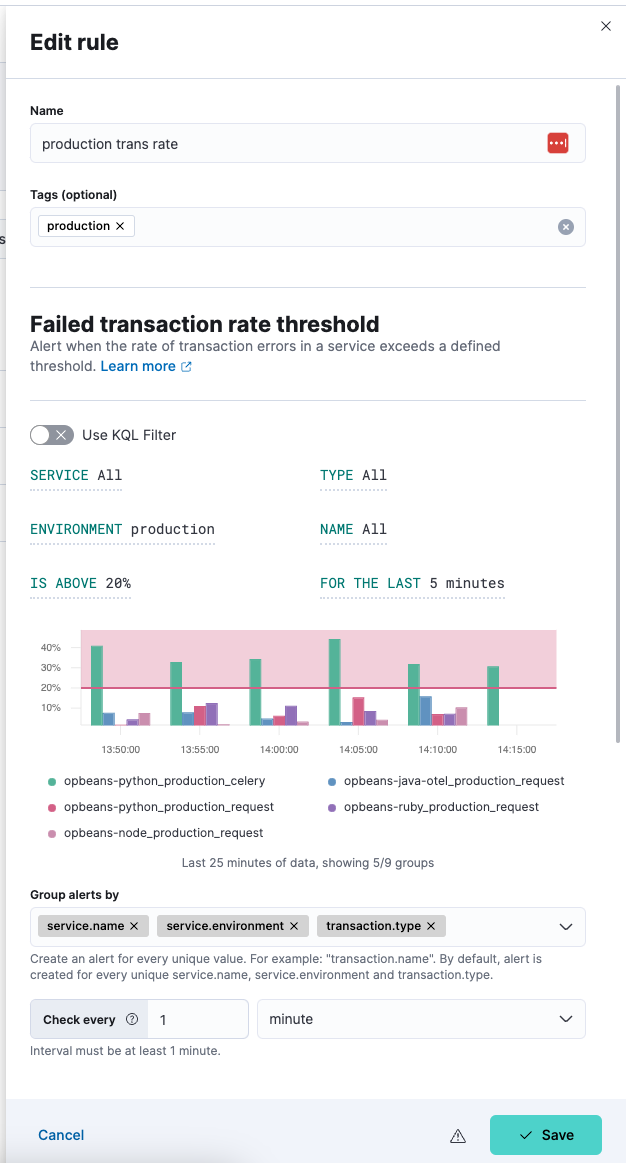
After a rule is created, you can open the More actions menu and select Edit rule to check or change the definition, and/or add or modify actions.
From the action menu you can also:
- Disable or delete rule
- Clone rule
- Snooze rule notifications
- Run rule (without waiting for next scheduled check)
- Update API keys
Click on an individual rule on the Rules page to view details including the rule name, status, definition, execution history, related alerts, and more.
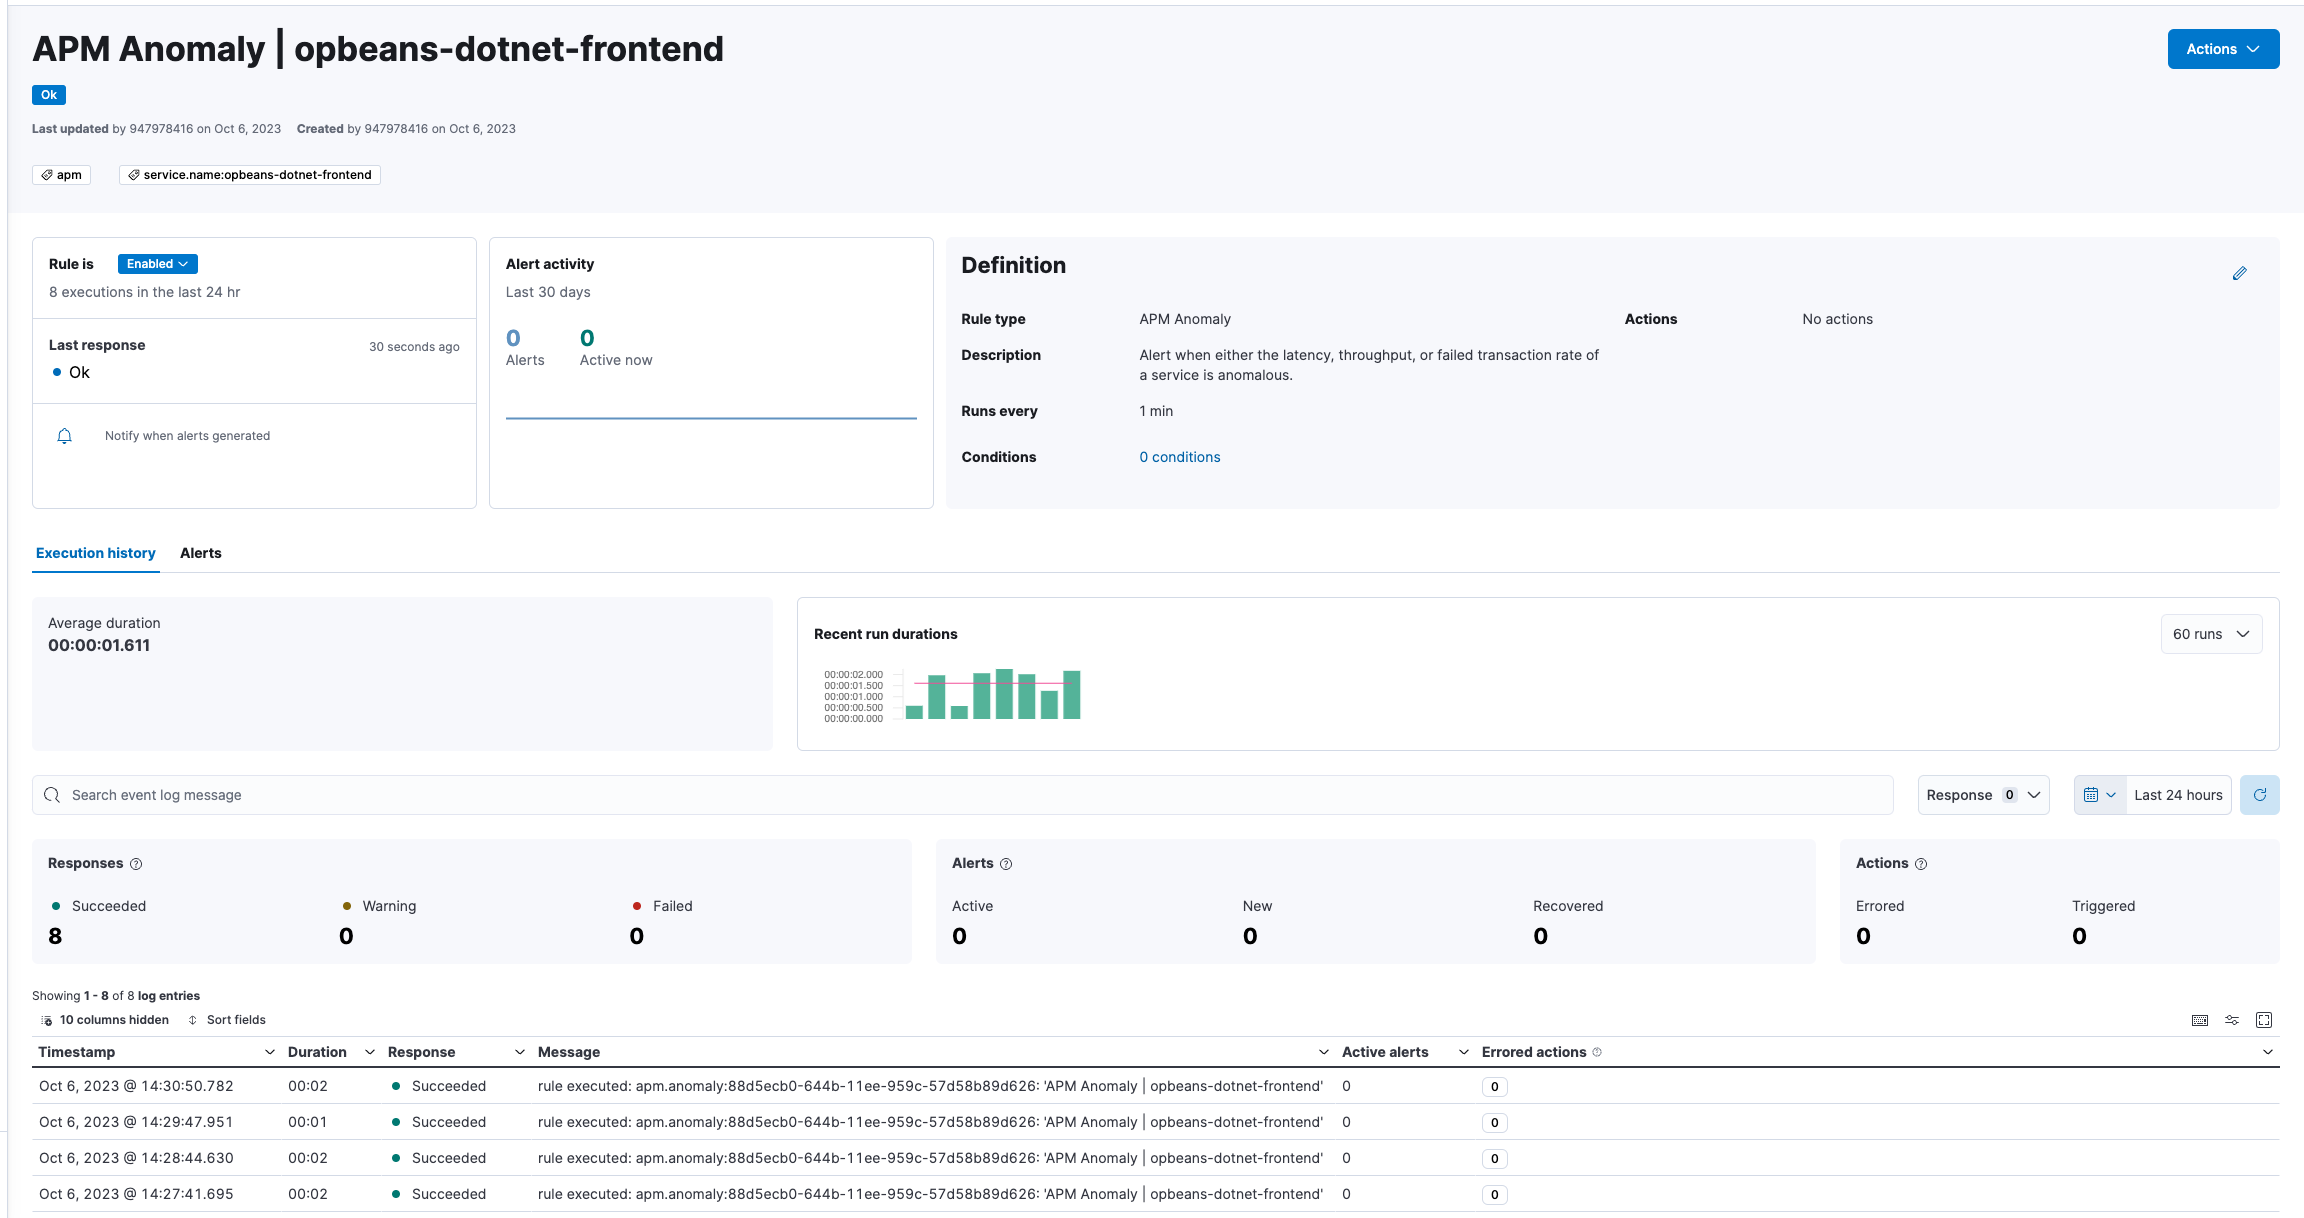
A rule can have one of the following responses:
failed- The rule ran with errors.
succeeded- The rule ran without errors.
warning- The rule ran with some non-critical errors.
The rule listing enables you to quickly snooze, disable, enable, or delete individual rules.
When you snooze a rule, the rule checks continue to run on a schedule but the alert will not trigger any actions. You can snooze for a specified period of time, indefinitely, or schedule single or recurring downtimes.
When a rule is in a snoozed state, you can cancel or change the duration of this state.
To temporarily suppress notifications for all rules, create a maintenance window.
To import and export rules, use Saved Objects.
Rules are disabled on export. You are prompted to re-enable the rule on successful import.
When creating or editing a rule, add the following resources to help you get started with investigating alerts:
Investigation guide: Investigation guides can help you respond to alerts more efficiently and consistently. When creating them, you can include instructions for responding to alerts, links to external supporting materials, and more. When the rule generates an alert, the investigation guide can be accessed from the Investigation guide tab on the alert's details page.
TipUse Markdown to format and structure text in your investigation guide.
Related and suggested dashboards: Link to dashboards that provide useful insights about your environment, active events, and any other information that might be relevant during your investigations. When the rule generates an alert, linked dashboards can be accessed from the Related dashboards tab on the alert's details page. From the tab, you can also review and add suggested dashboards (available for custom threshold rules only).
You can modify the criteria for changing an alert's status to flapping state by configuring the Alert flapping detection settings, which are turned on by default. When configuring flapping settings, you must set a look back window and threshold for alert status changes. For example, you can specify that alerts with at least 6 status changes in the last 10 runs are flapping.
When cross-project search is enabled and you have linked projects, rules query data across linked projects based on the space-level cross-project search scope.
The CPS scope selector in the header is read-only when you create or edit a rule. To change that default, update the cross-project search scope configured for the space.
To link projects and configure that default, refer to Cross-project search and Manage access and scope for cross-project search.
These rule types can override the space-level scope:
- ES|QL rules: Add
SET project_routingat the start of the rule query. - Rules that use index patterns: Use qualified index expressions in the index pattern to target specific projects.
- Machine learning rules: These rules alert on anomaly detection job results, so the job's scope determines what the rule can detect. Set
project_routingon the job's datafeed.
The rule writes every alert it generates to the origin project, no matter which project the matching data came from. The origin project's Alerts page shows those alerts. It doesn't show alerts generated by rules defined in other projects.