Customize the Discover view
Discover offers flexible customization options to optimize your data exploration experience. Adjust the document table layout, modify column arrangements, control chart, results table, and sidebar visibility, and configure display density to focus on the data that matters most. These customizations persist across sessions and help you work more efficiently with your Elasticsearch data.
Discover provides default context-aware experiences tailored to the type of data that you're exploring, and you can further customize your Discover view on top of them.
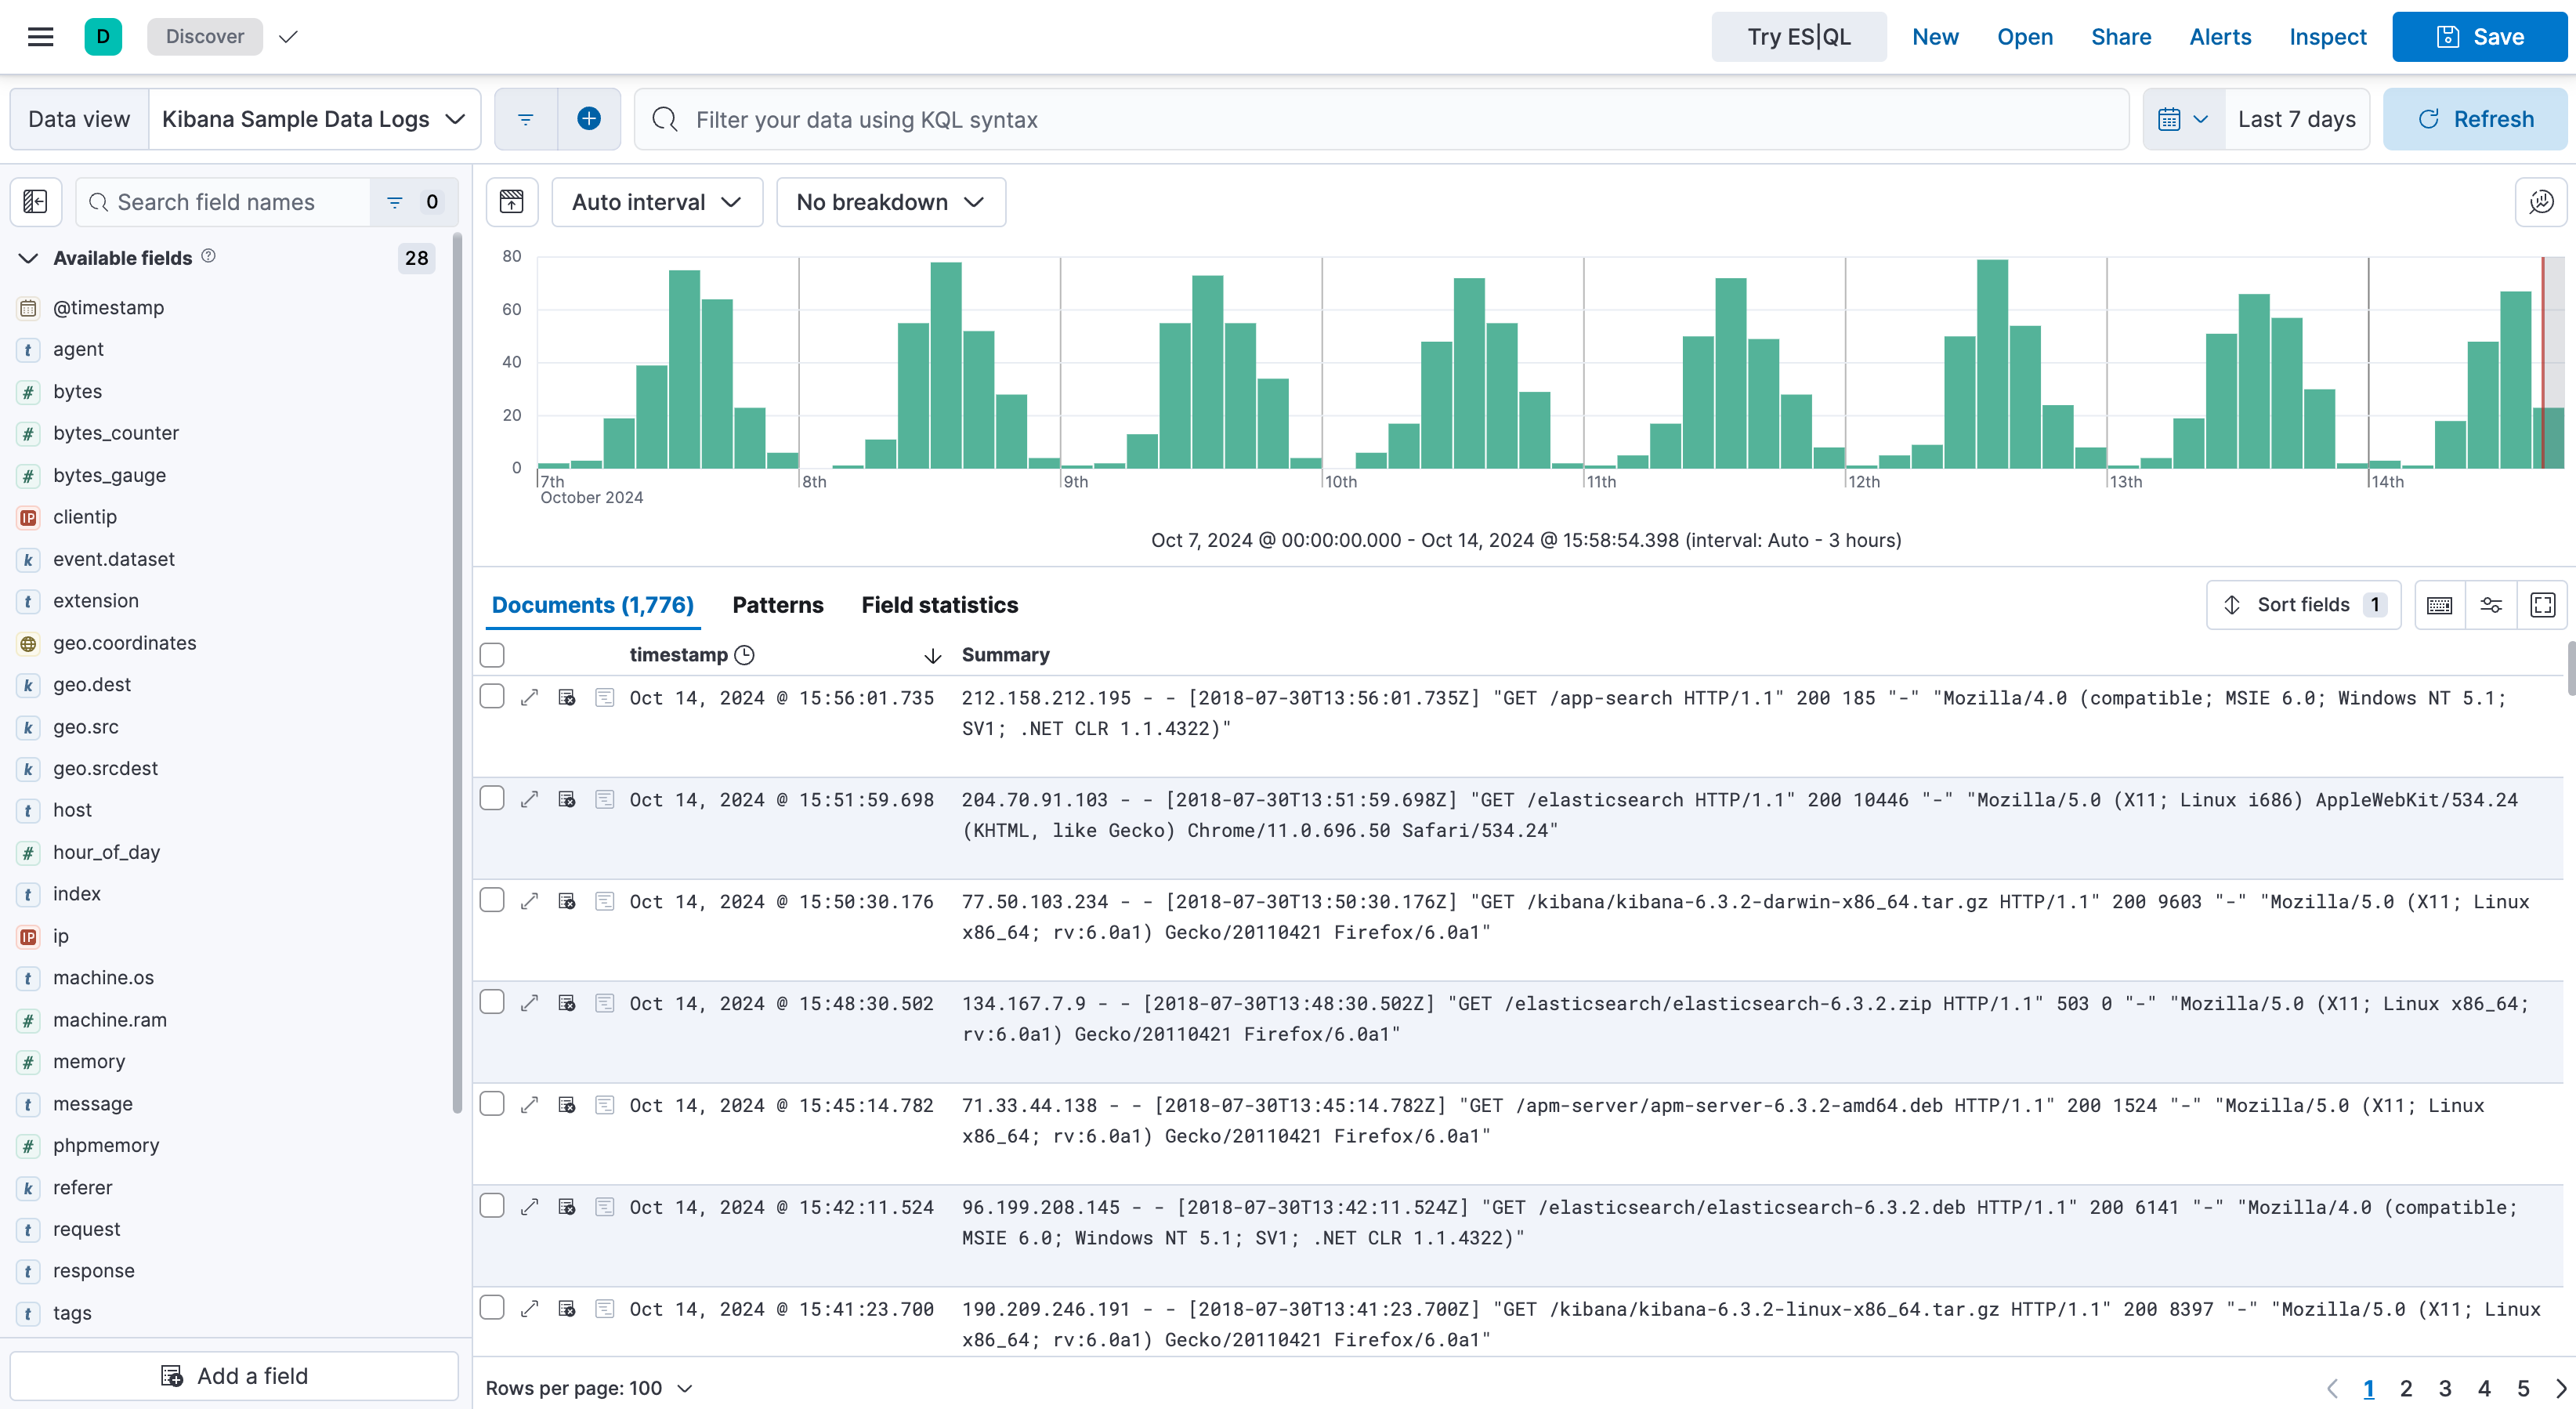
- To show or hide sections of the Discover view:
-
Use the Panels visibility button group to show or hide areas of Discover independently. The button group stays in a fixed position regardless of which sections are shown or hidden. - / to show or hide the chart
- / to show or hide the results table
- / to show or hide the fields list
-
Use the available collapse and expand button in the corresponding area to show or hide the chart and the fields list.
-
- Adjust the width and height of each area by dragging their border to the size you want. The size of each area is saved in your browser for the next time you open Discover.
Customize the appearance of the document table and its contents to your liking.
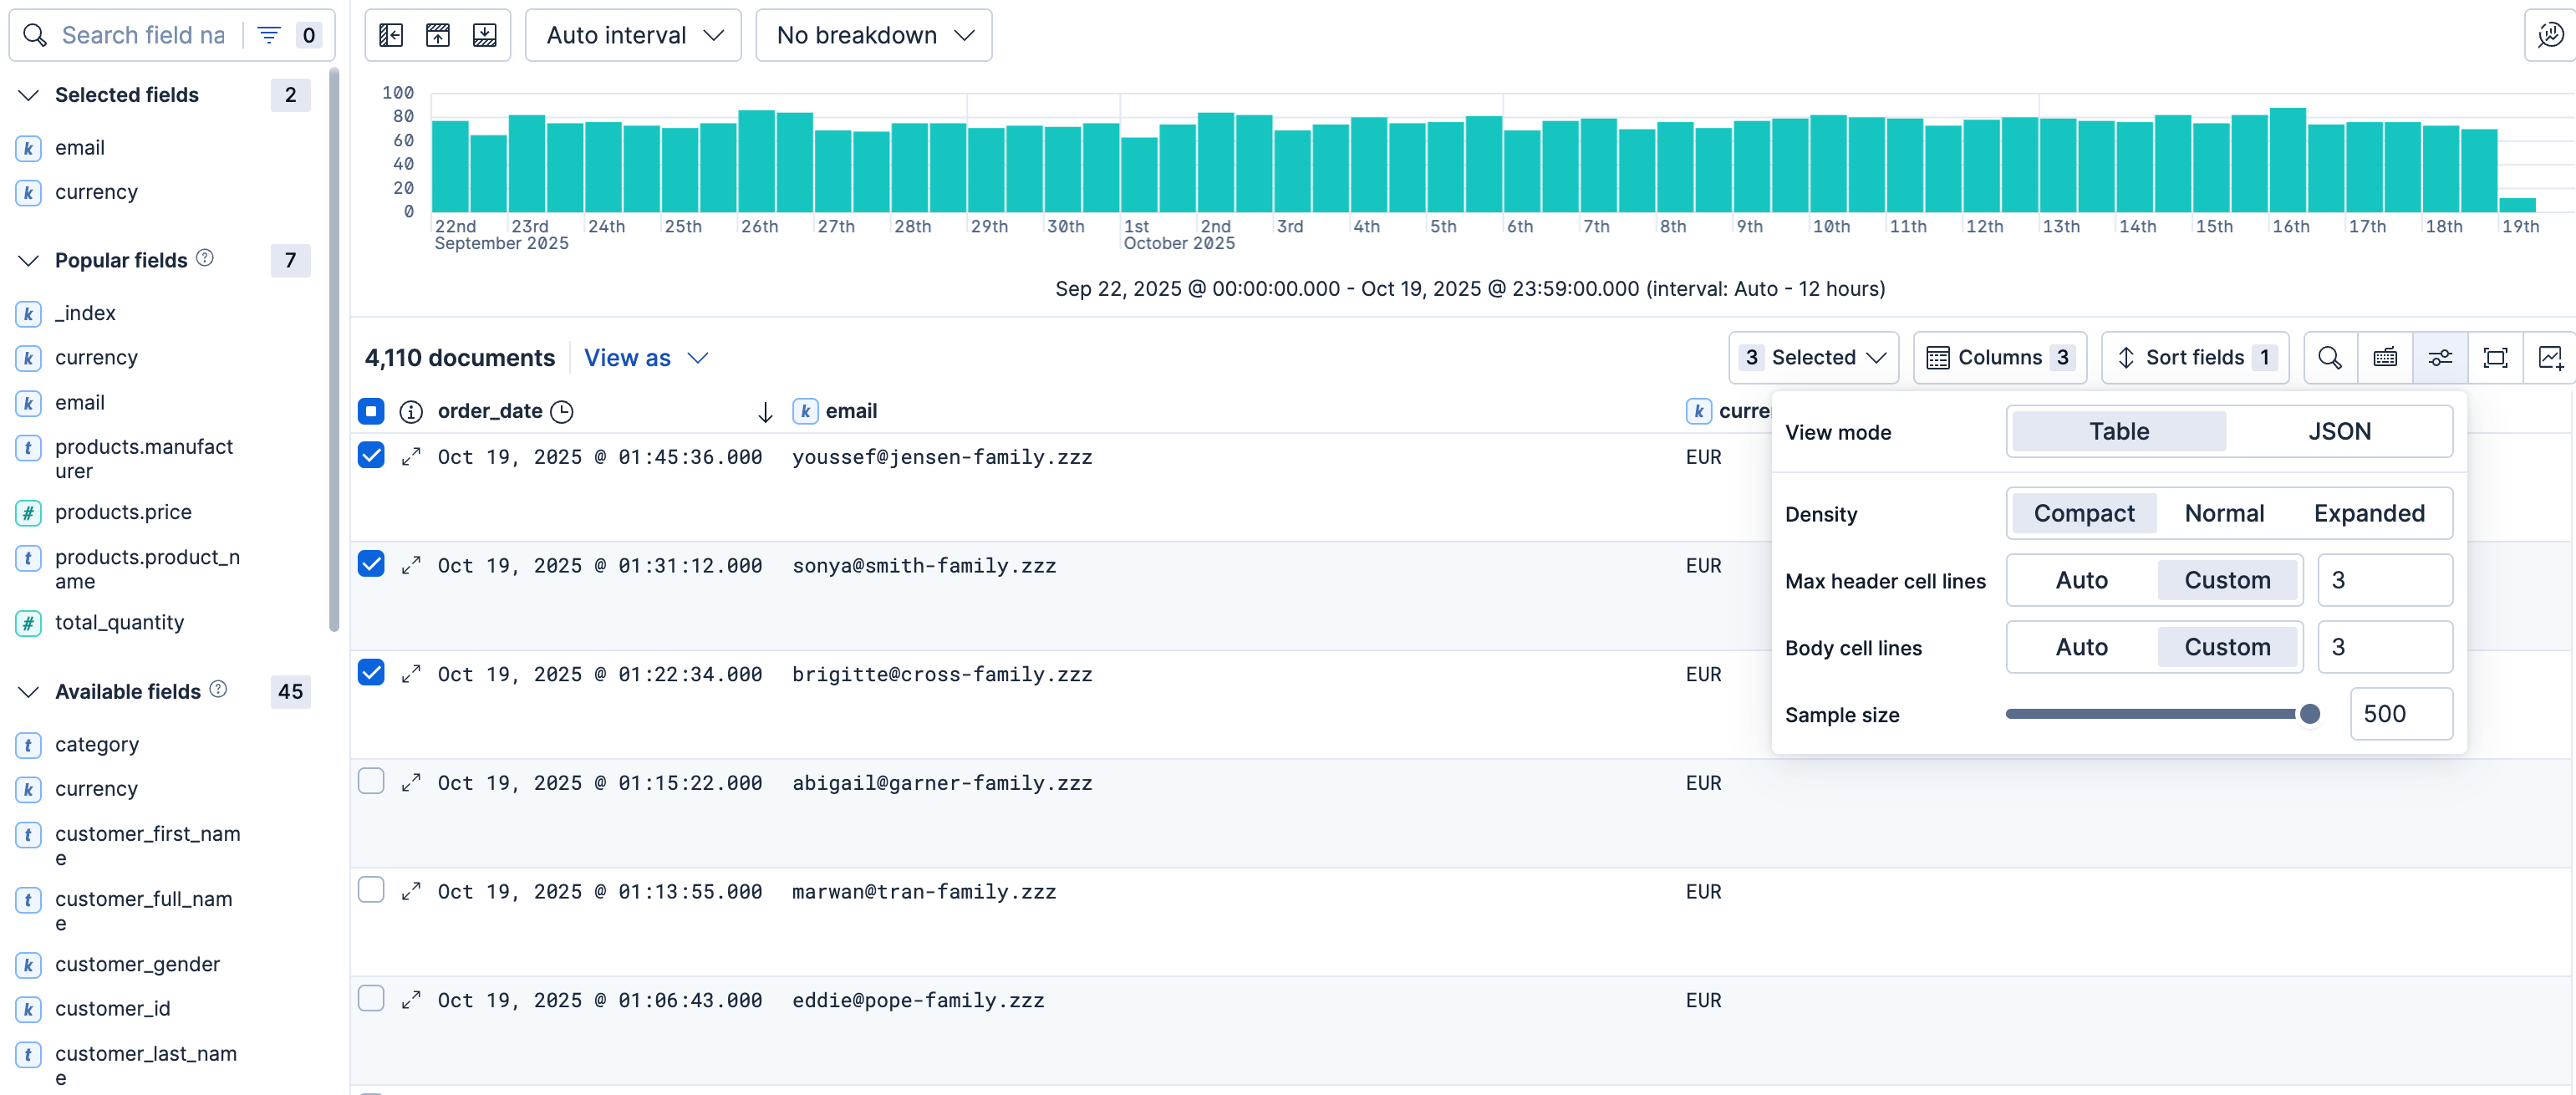
- To move a single column, drag its header and drop it to the position you want. You can also open the column’s contextual options, and select Move left or Move right in the available options.
- To move multiple columns, click Columns. In the pop-up, drag the column names to their new order.
- To resize a column, drag the right edge of the column header until the column is the width that you want.
Tip
Column widths are stored with a Discover session. When you add a Discover session as a dashboard panel, it appears the same as in Discover.
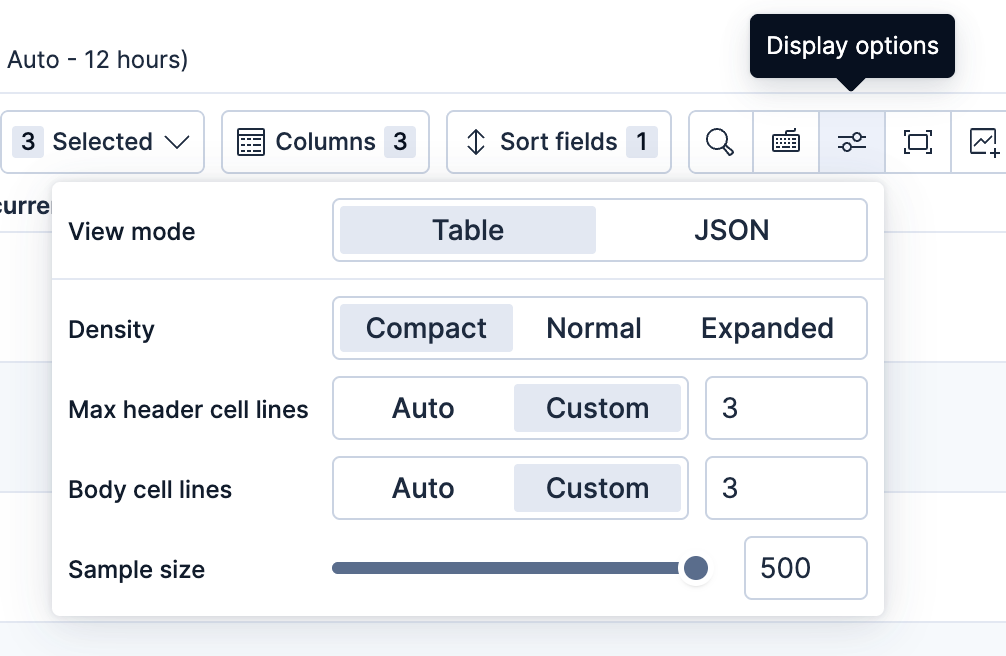
You can adjust the density of the table from the Display options located in the table toolbar. This can be particularly useful when scrolling through many results.
Open Display options in the table toolbar. Set Max header cell lines and Body cell lines to Auto to fit the contents, or to Custom and enter a line count.
When the number of results returned by your search query (displayed at the top of the Documents or Results tab) is greater than the value of discover:sampleSize, the number of results displayed in the table is limited to the configured value by default. You can adjust the initial sample size for searches to any number between 10 and discover:sampleSize from the Display options located in the table toolbar.
On the last page of the table, a message indicates that you’ve reached the end of the loaded search results. From that message, you can choose to load more results to continue exploring.
Sort the data by one or more fields, in ascending or descending order. The default sort is based on the time field, from new to old.
To add or remove a sort on a single field, click the column header, and then select the sort order.
To sort by multiple fields:
Click the Sort fields option.
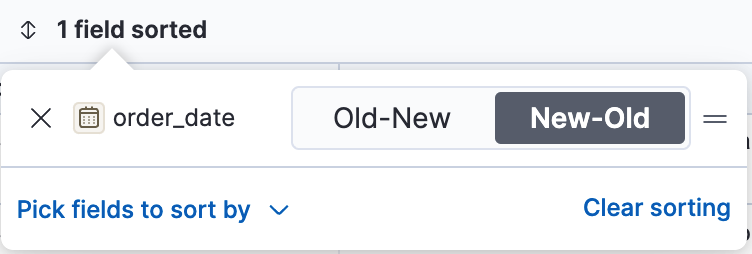
To add fields to the sort, select their names from the dropdown menu. By default, columns are sorted in the order they are added.
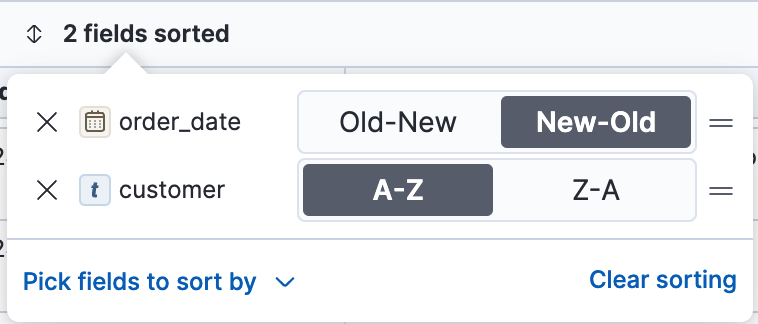
To change the sort order, select a field in the pop-up, and then drag it to the new location.
Change how Kibana displays a field.
- Click the column header for the field, and then select Edit data view field.
- In the Edit field form, change the field name and format. For detailed information on formatting options, refer to Format data fields.
Narrow your results to a subset of documents so you're comparing the data of interest.
- Select the documents you want to compare.
- Click the Selected option, and then select Show selected documents only.
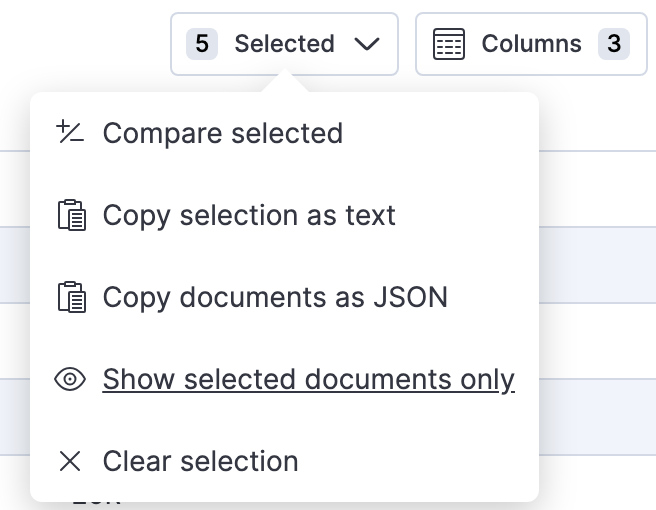
You can also compare individual field values using the Compare selected option.
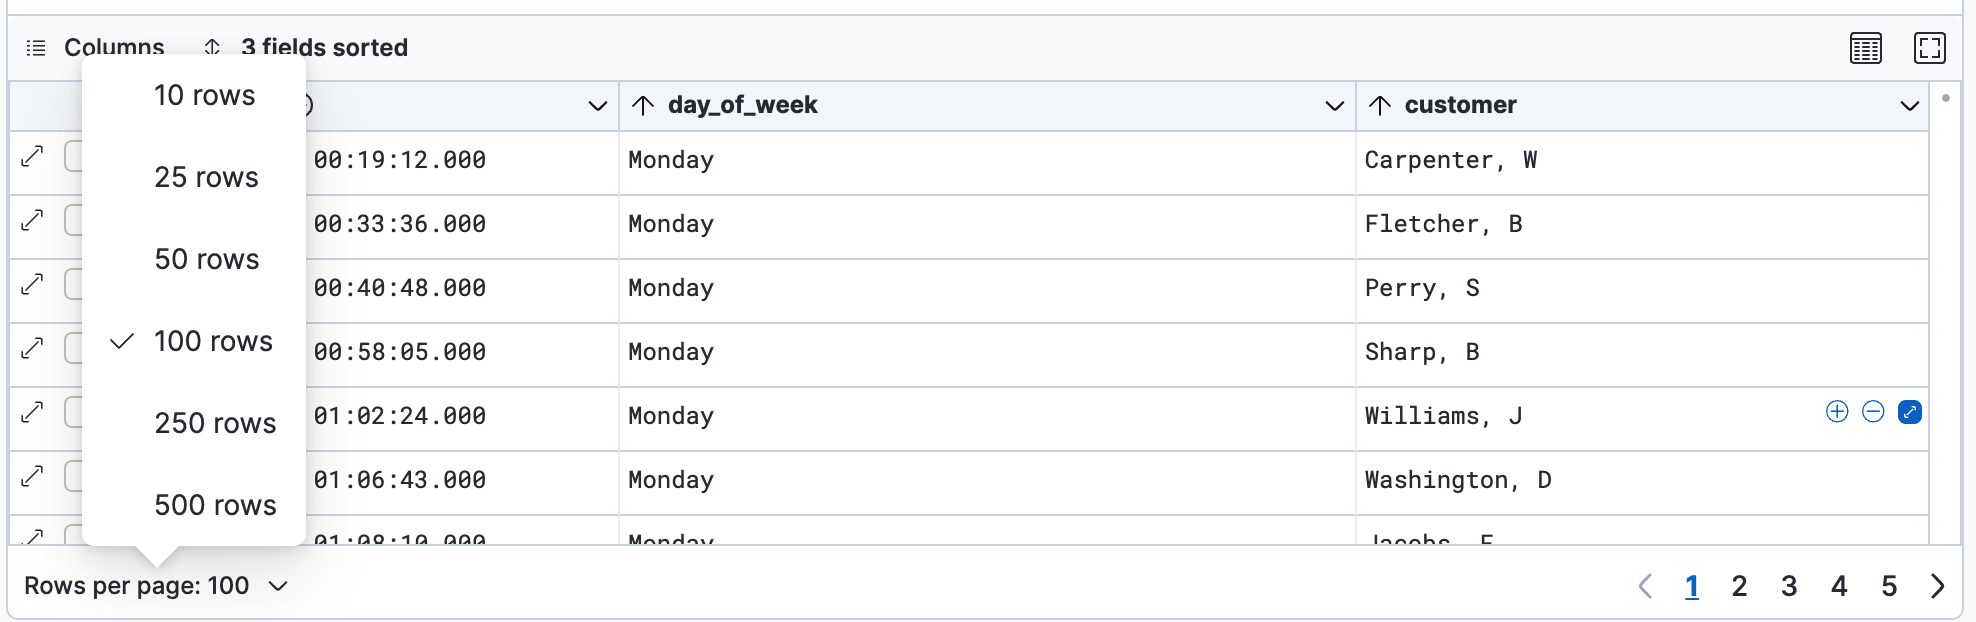
To change the numbers of results you want to display on each page, use the Rows per page menu. The default is 100 results per page.
JSON view shows each document as a collapsible tree in the table. Use it to inspect nested fields, copy a value or the whole document, and filter without opening the flyout.
Open Display options in the table toolbar, then set View mode to JSON. If you add fields to the table, the tree shows only those fields. If you don't, it shows the full document.
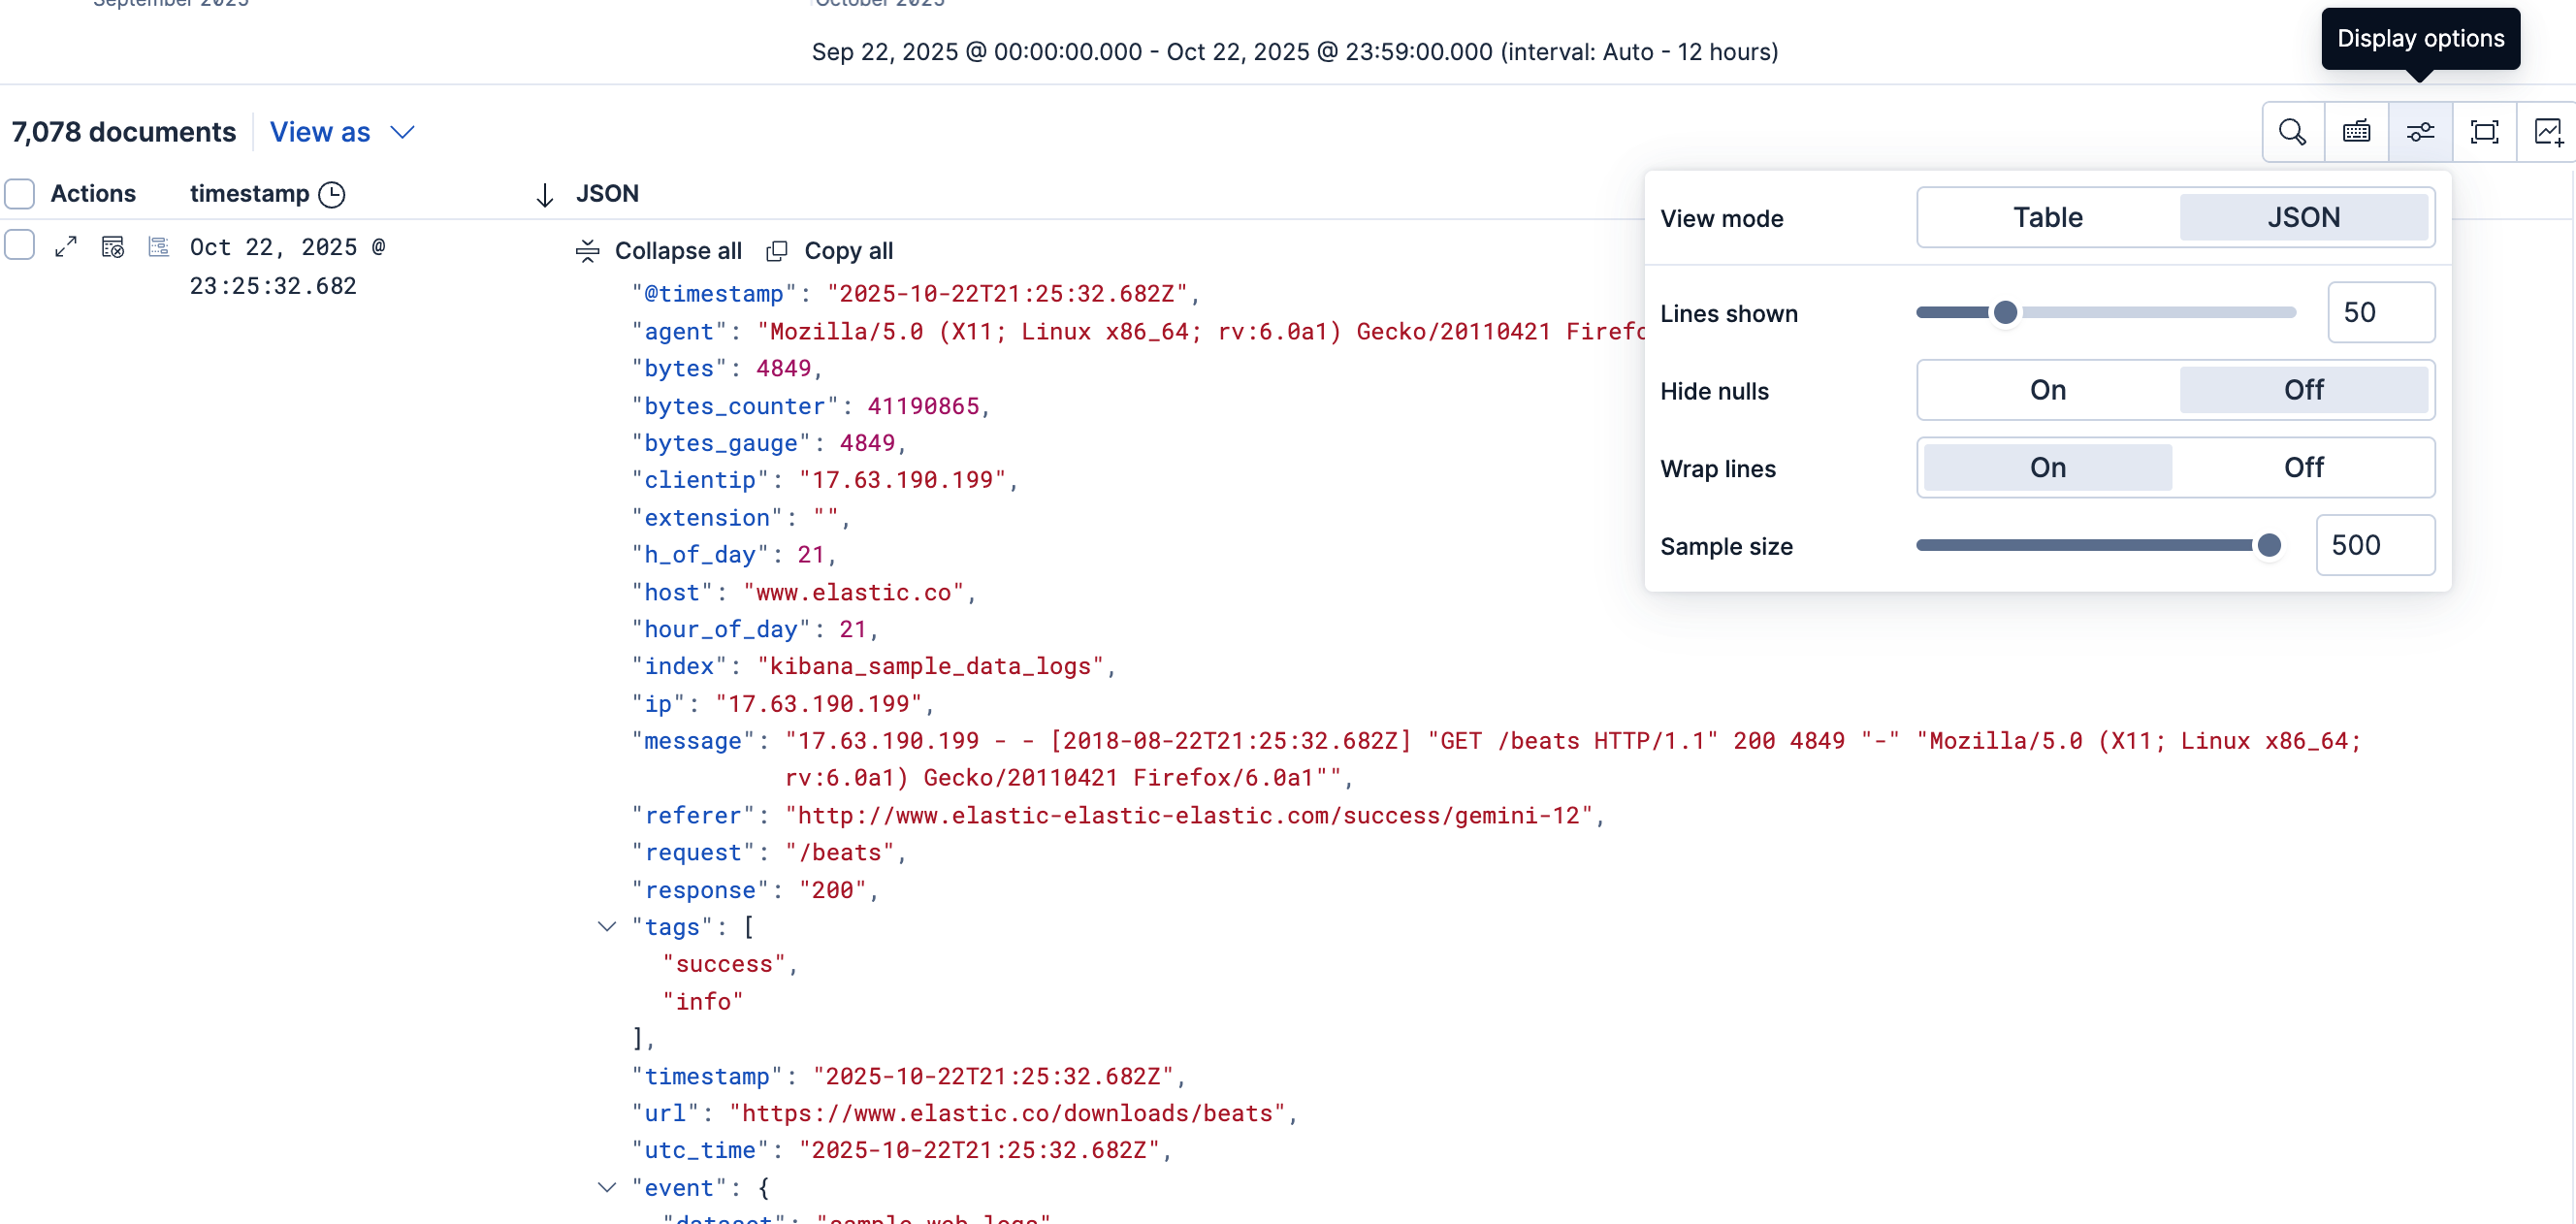
Use Expand all and Collapse all to open or close nested objects and arrays. Hover a field or value to copy it, or to filter for or filter out that value. Select Copy all to copy the document as JSON. To expand only one object's children, hold Command (or Ctrl) and select that object or array.
Use Display options to change how each tree looks, and how many documents the table loads:
- Lines shown: How much of the tree is open in each cell. The range is 10 to 200. The default is 50.
- Hide nulls: When On, Discover omits null values from the tree. The default is Off.
- Wrap lines: When On, long values wrap onto more lines. When Off, each value is truncated to one line. The default is On.
- Sample size: How many documents the table loads. To page through one document and the documents around it, use the document flyout.
You can't filter on values Elasticsearch ignored at index time, or on values inside a JSON string that Discover expanded in the tree. If a document is too large to render in full, Discover shows a warning and displays the first 10,000 values.
To go back to columns, set View mode to Table. You can then change Density and header and body row height.
If you save the session in JSON view, you get the same tree and the same Lines shown, Hide nulls, and Wrap lines values when you open it again. A dashboard panel from that session, or from Save table to dashboard, looks the same.