Save a Discover session for reuse
Saved Discover sessions preserve your queries, filters, column selections, and view configurations for reuse. Save sessions to return to specific data explorations, share search results with team members, add searches to dashboards, or use them as a foundation for building visualizations. This guide shows how to save, reopen, duplicate, export, and manage Discover sessions.
To save searches, you need Create and Edit permissions for the Saved Objects feature in Kibana. If you don't have these permissions, the Save button won't be visible. For more information, refer to Read-only access.
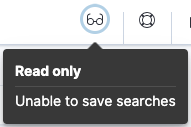
If you don’t have sufficient privileges to save Discover sessions, the following indicator is displayed and the Save button is not visible. For more information, refer to Granting access to Kibana.
- Once you’ve created a view worth saving, select Save in the application menu. A dialog with several options opens:
- Enter a Title for the session, and optionally a Description and Tags.
- If the session is time-based, turn on Store time with Discover session to save the current time filter and refresh interval with it.
-
In Add to dashboard, choose whether to also add the session as a panel on a dashboard. Select New to create a dashboard, Existing to choose one, or None to skip. The session is saved to the library in all cases.
- Select Save.
- To reload your search results in Discover, select Open session in the application menu, and select the saved Discover session.
A Discover session stores the following elements for each of its tabs:
- The query mode (ES|QL or Classic)
- The query text and filters
- The data view
- If you turned on Store time with Discover session, the selected time filter and refresh interval
- The current view of Discover, including the document table layout, the chart, and any ES|QL variable controls
-
The JSON view of the document table, including how each tree is displayed. Refer to View documents as JSON. -
The Fast mode setting in ES|QL mode. Refer to Use Fast mode.
If the saved Discover session is associated with a different data view than is currently selected, opening the saved Discover session changes the selected data view. The query language used for the saved Discover session is also automatically selected.
To analyze the rows of a session in a spreadsheet or another tool, export them as a CSV file. To start, select More → Export → Tab results as CSV, then generate the report.
Your CSV file might not contain every row of your results. The export stops at the first limit that it reaches, either a number of rows or a file size.
- ES|QL mode: 10,000 rows or 250 MB, whichever comes first. The Kibana limit is 10,000 rows by default. The row limit is the lower value of the Kibana limit and the Elasticsearch cap on the rows that an ES|QL query returns, which is also 10,000 by default. For queries that start with
TSorPROMQL, the Elasticsearch cap is 10,000,000 rows, so the Kibana limit of 10,000 rows applies instead. ALIMITin your query can lower the row limit. The report doesn't warn you when it reaches the row limit. Refer to Result set size limit. - Classic mode: 100,000 rows or 250 MB, whichever comes first. When the results reach the row limit, the export flyout warns you before you generate the report, and the report completes with a warning.
You can't change the limits in either mode.
- ES|QL mode: 10,000 rows or 250 MB by default, whichever comes first. The Kibana limit is 10,000 rows by default. The row limit is the lower value of the Kibana limit and the Elasticsearch cap on the rows that an ES|QL query returns, which is also 10,000 by default. For queries that start with
TSorPROMQL, the Elasticsearch cap is 10,000,000 rows, so only the Kibana limit applies. ALIMITin your query can lower the row limit. The report doesn't warn you when it reaches the row limit. Refer to Result set size limit. - Classic mode: 10,000 rows or 250 MB by default, whichever comes first. When the results reach the row limit, the export flyout warns you before you generate the report, and the report completes with a warning.
In self-managed and Elastic Cloud Hosted deployments, you can change the Kibana limits with the xpack.reporting.csv.maxRows and xpack.reporting.csv.maxSizeBytes settings. Higher limits can affect performance. In ES|QL mode, you can also raise the Elasticsearch cap with the esql.query.result_truncation_max_size cluster setting. Refer to Reporting settings.
- ES|QL mode: 10,000 rows or 250 MB by default, whichever comes first. The row limit is the Elasticsearch cap on the rows that an ES|QL query returns. A
LIMITin your query can lower it. In 9.2, for queries that start withTS, the Elasticsearch cap is 10,000,000 rows, so the file size limit usually comes first. The report doesn't warn you when it reaches the row limit. Refer to Result set size limit. - Classic mode: 250 MB by default. There is no row limit.
In self-managed and Elastic Cloud Hosted deployments, you can change the file size limit with the xpack.reporting.csv.maxSizeBytes setting. In ES|QL mode, you can change the row limit with the esql.query.result_truncation_max_size cluster setting. Refer to Reporting settings.
If you need more rows than the limit allows, use filters to create several smaller reports, or query Elasticsearch directly.
An export can also time out or return incomplete data for reasons unrelated to these limits, such as slow storage, an unavailable shard, or high network latency. For the common causes, refer to CSV report limitations.
To generate the same export automatically, from a script, Watcher, or on a schedule, refer to Automatically generate reports.
Export the session as JSON to inspect its definition, or to use that JSON as the starting point for managing the session as code. For each tab you include, the JSON contains the query, the filters, the data view, and the current view, including the columns and the chart. It does not include the query results. The rows in the document table are not in the file. To export those rows, refer to Save a Discover session for reuse > Export Discover session results as CSV.
In Discover, in the application menu, select More → Export → Export JSON.
Set what the JSON includes:
- To include every open tab, leave Export only the current tab off. Turn it on to include only the tab you are viewing.
- If the session is not saved, turn on Include current time settings to include the current time filter and refresh interval. The setting is off by default.
- If the session is saved, Include current time settings is not available. The JSON includes the current time filter and refresh interval only when you saved the session with Store time with Discover session.
Review the JSON. If a property can't be included, Kibana removes it and lists it under Unsupported properties were removed. Select Show details to see what was removed. If Kibana can't export the session, the flyout shows Unable to export and the error. Select Retry to try again.
Copy, download, or open the JSON:
- Select Copy to clipboard to copy it.
- Select Open in Console to open Kibana Dev Tools with a request that contains the JSON. This option is available if you have access to Dev Tools.
- Select Download JSON to save the file. The file name is the session title. For an unsaved session, the file is named
Untitled Discover session.json.
To duplicate an existing Discover session as a new one, the workflow depends on the version you're using.
- In Discover, open the Discover session that you want to duplicate.
- In the application menu, from the menu next to Save, select Save as. The Save Discover session dialog opens.
- Enter a Title for the new session, and optionally a Description and Tags.
-
In Add to dashboard, choose whether to also add the session as a panel on a dashboard. Select New to create a dashboard, Existing to choose one, or None to skip. The session is saved to the library in all cases. - Select Save.
- In Discover, open the Discover session that you want to duplicate.
- In the application menu, select Save.
- Enter a new name for the session.
- Turn on Save as new Discover session.
- Select Save.
You can add different pieces of a Discover session to a dashboard, and manage how they appear:
- Add Discover visualizations to dashboards: save the chart generated by your query as a visualization panel.
- Add Discover tables to dashboards: save the table from a Discover session as a panel. Several paths exist, depending on whether you start from Discover or from the dashboard.
- Manage Discover session panels on a dashboard: edit a session panel from a dashboard, save your edits as a new session, or choose which tab to display.
When a query in Discover produces a chart, you can save that chart as a visualization panel on a new or existing dashboard, without saving the Discover session itself. The exact flow depends on the query mode you're using in Discover.
You need permission to view and create dashboards.
- In Discover, run an ES|QL query that produces a chart.
- Next to the chart, select Save visualization to dashboard. In earlier versions, select Save visualization.
- Enter a title for the panel, and optionally a description.
- In Add to dashboard, select New to create a dashboard, or Existing to choose one from the list.
- Select Save and go to dashboard.
In that version, if your ES|QL query defines variable controls, they aren't added to the dashboard when using this method. To preserve them, follow Import a Discover query along with its controls into a dashboard instead.
In classic mode there's no direct save button next to the chart. Instead, you open the chart in Lens, edit it as needed, and save from there.
The Edit visualization button only appears when the data view you're querying is time-based and its time field can be visualized. If those conditions aren't met, the chart isn't shown and the button isn't available.
- In Discover, run a query that produces a chart.
- Next to the chart, select Edit visualization. The chart opens in Lens, prefilled with your current query and time range.
- In Lens, adjust the visualization as needed.
- Select Save in the Lens application menu.
- Enter a Title for the panel, and optionally a Description.
- In Add to dashboard, select New to create a dashboard, or Existing to choose one from the list.
- Select Save and go to dashboard.
You can add the table from a Discover session to a dashboard in several ways. They differ in where you start and in the lifecycle of the resulting panel: whether the session is saved to the library or only lives on a specific dashboard, and whether the panel displays a single table or lets you switch between the tables of each tab in your Discover session.
You need permission to view and create dashboards.
The flow you choose depends on where you start:
- From Discover:
- From a dashboard:
From Discover, save the current view of the table to a new or existing dashboard, without saving the Discover session to the library. The resulting panel stores its configuration with the dashboard, so later changes to the Discover session don't affect the panel. If the session has multiple tabs, only the current table is saved.
The button isn't available when Discover is opened from another application, such as when editing a session panel from a dashboard.
- In the documents table toolbar, select Save table to dashboard.
- Enter a title for the panel, and optionally a description.
- In Add to dashboard, select New to create a dashboard, or Existing to choose one from the list.
- Select Save and go to dashboard.
From Discover, save the entire Discover session, including all its tabs, columns, sort order, and other settings.
When you save a Discover session, it is saved to the library. The Add to dashboard option of the dialog lets you choose whether to also add it as a panel on a dashboard:
- Existing: The session is also added as a panel on a dashboard you choose.
- New: The session is also added as a panel on a new dashboard.
- None: The session is saved to the library only. To add it as a panel later, add it from the dashboard library.
If the session has multiple tabs, you can choose which tab the panel displays on the dashboard.
Follow the steps under Save a Discover session, and select the Add to dashboard option that matches what you want.
Saving from Discover saves the session to the library only. To put it on a dashboard, follow the steps under Save a Discover session, then add the session from the dashboard library.
From a dashboard, add a Discover session that's already saved to the library. The same session can be added to multiple dashboards, and each panel stays linked to the library, so updates to the session are reflected on all dashboards. You can break that link by unlinking a panel from the library after adding it from the panel's contextual menu.
This option requires that the session has already been saved to the library.
- Go to Dashboards.
- Open or create the dashboard, then switch to Edit mode if necessary.
- Depending on the version you're using, select Add from library, or Add → From library.
- From the Types dropdown, select Discover session.
- Select the Discover session that you want to add, then select X to close the list.
If the session has multiple tabs, you can choose which tab the panel displays on the dashboard.
Use this option to create a single-tab Discover session directly on the dashboard, without first saving it to the library. The session is stored only with the dashboard.
You need permission to access Discover, and the dashboard must be in Edit mode.
- From the application menu, add a new Discover session panel.
- Configure the session: enter a query, adjust columns, sort, and apply other view settings as needed.
- Select Save and return in the application menu to add the configured panel to the dashboard.
When editing a Discover session panel from a dashboard, you can save your changes as a new Discover session, instead of updating the panel in place. This works whether the panel was added from the library or created directly on the dashboard.
On the dashboard, hover over the panel and select Edit Discover session configuration. Discover opens in embedded editor mode.
Make your changes in Discover.
In the application menu, from the menu next to Save and return, select Save as.
In the Save Discover session dialog, enter a Title for the new session, and optionally a Description and Tags.
In Add to dashboard, choose whether to also add the new session as a panel on a dashboard. The session is saved to the library in all cases. - Existing: The session is also added as a panel on a dashboard you choose.
- New: The session is also added as a panel on a new dashboard.
- None: The session is saved to the library only.
Select Save.
A Discover session panel displays one tab at a time. When the underlying session has multiple tabs, you can change which tab the panel shows.
On the dashboard, open the panel menu and select Edit.
From the tab selector, select the tab you want to display.
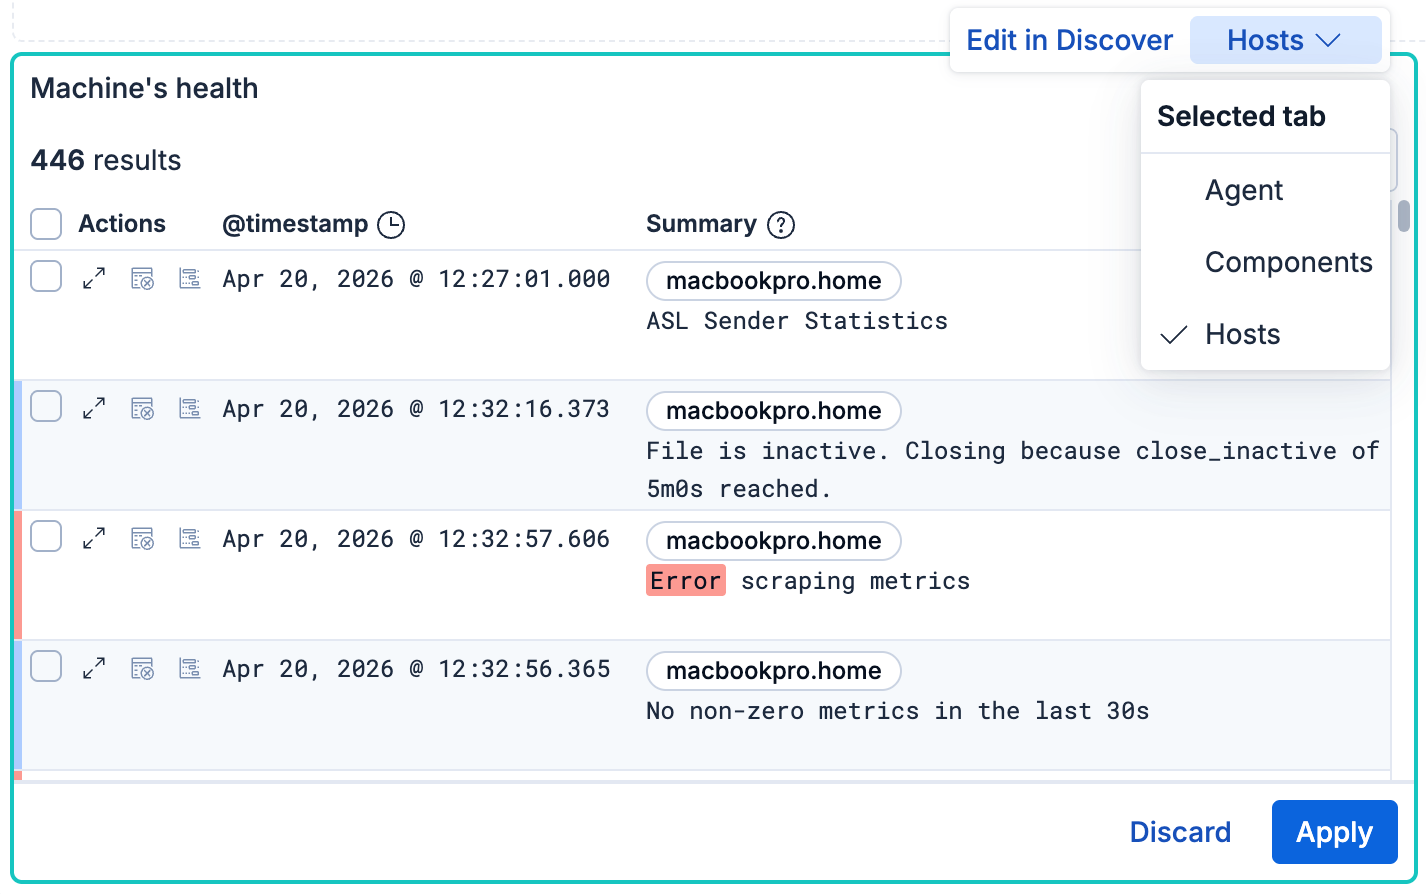
Select Apply.