Share and export dashboards
Kibana provides several ways to share dashboards with others and export their content:
- Share with a link: Copy a direct link to the dashboard.
- Embed in a webpage: Embed an interactive dashboard as an iframe on external web pages.
- Export as PDF or PNG: Generate a report file of your dashboard.
- Download visualization data as CSV: Download the data behind individual Lens visualizations.
- Export dashboard configuration: Export as NDJSON for backup or migration, or as JSON for the dashboards API.
You can also set who can edit the dashboard.
Most options start from the Share button in the dashboard toolbar. CSV download and dashboard configuration export use different entry points; see each section for details.
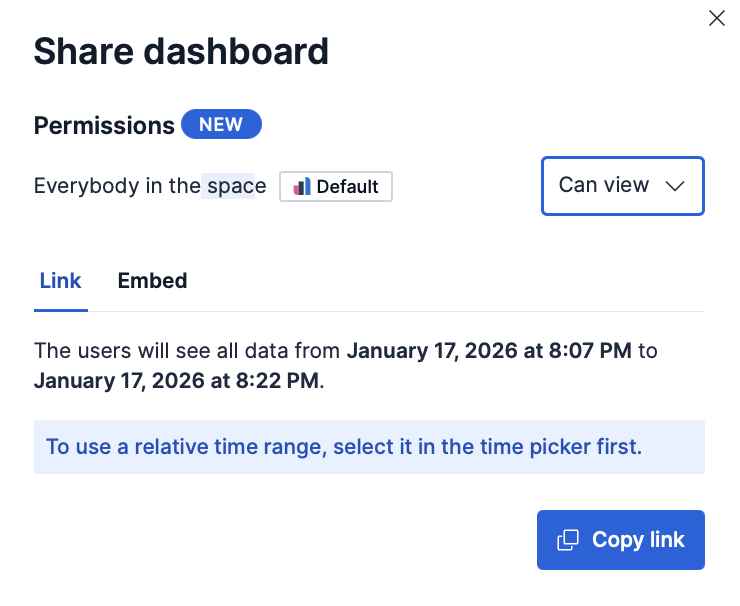
Share a direct link to your dashboard so that others can access it in Kibana.
- Open the dashboard, then click Share.
- On the Link tab, click Copy link.
The link requires authentication. To access the dashboard, users must log in to Kibana with an account that has the necessary permissions. Anonymous users can also access the link if you have configured Anonymous authentication and your anonymous service account has the necessary privileges.
If the dashboard has unsaved changes, you get a temporary link that might break later, for example after an upgrade. Save the dashboard first to get a permanent link. If you share a link while a panel is maximized, the link reopens the dashboard with that same panel maximized.
- Relative time range: The link shows current data. For example, if you share a "Last 7 days" view, users always see the most recent 7 days when they open the link.
- Absolute time range (default): The link shows a fixed time period. For example, if you share a "Last 7 days" view on January 7, 2025, the link always shows that exact week of January 1-7, 2025, regardless of when users open the link.
Embed a fully interactive dashboard as an iframe on an internal company website or personal web page.
- Open the dashboard, then click Share.
- Go to the Embed tab.
- Under Include, select which parts of the dashboard to display in the embedded view:
- Top menu
- Query
- Time filter
- Filter bar (enabled by default)
- Click Copy embed code.
- Paste the iframe code into your web page HTML.
For information about granting access to embedded dashboards, refer to Authentication.
Save the dashboard before generating the embed code. Embedding a dashboard with unsaved changes might result in an embed code that does not work properly.
Generate and download a PDF or PNG file of your dashboard. PDF and PNG reports are a subscription feature.
- Open the dashboard, then click Export in the toolbar.
- Select PDF or PNG.
- Optional: For PDF exports, enable Print format to create a printer-friendly report with multiple A4 portrait pages and two visualizations per page.
- Click the button to generate the report.
A notification confirms that the report is queued. When it is ready, download it from the Reporting page under Stack Management → Alerts and Insights → Reporting.
For more information on how to configure reporting in Kibana, refer to Configure reporting in Kibana.
When you create a dashboard report that includes a data table or Discover session, the PDF includes only the visible data.
For general information about reporting across all Kibana apps, known limitations, and troubleshooting, refer to Reporting and sharing.
You can download the data displayed in individual Lens visualizations on your dashboard as CSV files.
- On the dashboard, open the Lens visualization you want to export.
- Click Export, then select CSV Download.
- The CSV file is downloaded to your machine.
If the visualization contains data that starts with characters that spreadsheet applications might interpret as formulas (such as =, +, -, or @), a warning is displayed.
You can export a dashboard from Kibana in two formats. Use the table to choose the one that fits your goal.
| Format | Use it to | What it includes |
|---|---|---|
| NDJSON | Move dashboards between spaces or clusters, back them up, or share them in bulk. | The selected dashboards along with their related objects, such as data views and visualizations. Supports exporting multiple dashboards at once. |
| JSON
|
Manage a single dashboard as code, version-control it, recreate it through the dashboards API, or inspect its state. | One dashboard, with the panel types and properties that the dashboards API supports. Any panel types and properties not supported by the API are listed in the export flyout and removed from the export. |
Export dashboards as NDJSON files to migrate them to other Kibana instances, back them up, or share them with other teams. You can export dashboards from Stack Management → Saved Objects. To configure and start the export:
- Select the dashboard that you want, then click Export.
- Enable Include related objects if you want objects associated with the selected dashboard, such as data views and visualizations, to also be exported. This option is enabled by default and recommended if you plan to import that dashboard again in a different space or cluster.
- Select Export.

To automate Kibana, you can export dashboards as NDJSON using the Export saved objects API. It is important to export dashboards with all necessary references.
Export the JSON source of a dashboard in a format that the Kibana dashboards API can consume. Use this option when you want to inspect the state of a dashboard, save it to a file, or send it to the API to recreate the dashboard in another space or instance.
To export a dashboard as JSON:
Open the dashboard you want to export.
From the toolbar, select Export → Export JSON.
In the flyout, review the JSON source. If a panel type or property is not yet supported by the dashboards API, it is removed from the export and listed under Unsupported properties were removed. Expand Show details to see what was removed.
Choose how to use the JSON source:
- Select Copy to clipboard to copy the JSON.
- Select Open in Console to open Kibana Dev Tools Console with a Create dashboard API request pre-populated with the JSON source. This option is available if you have access to Dev Tools.
- Select Download JSON to save the JSON source to a file.
From the Share dialog, you can choose whether others in the space can edit your dashboard, or only view it:
- Can edit: Everybody in the space can edit, delete, and fully manage the dashboard.
- Can view: Everybody in the space can view the dashboard, but cannot edit or delete it. They can duplicate it. This read-only setting can be changed at any time by the dashboard owner or a Kibana administrator.
The dashboard owner cannot be changed and is not visible from the UI. Note that if user A creates a dashboard, exports it, and user B re-imports it in the same space (overwriting the existing dashboard), user A remains the owner but user B becomes the creator.
Kibana administrators always have write access to all dashboards.