Troubleshoot detection rules
This topic covers common troubleshooting issues when creating or managing detection rules.
Machine learning rule is failing and a required machine learning job is stopped
If a machine learning rule is failing, check to make sure the required machine learning jobs are running and start any jobs that have stopped.
Go to Rules → Detection rules (SIEM), then select the machine learning rule. The required machine learning jobs and their statuses are listed in the Definition section.
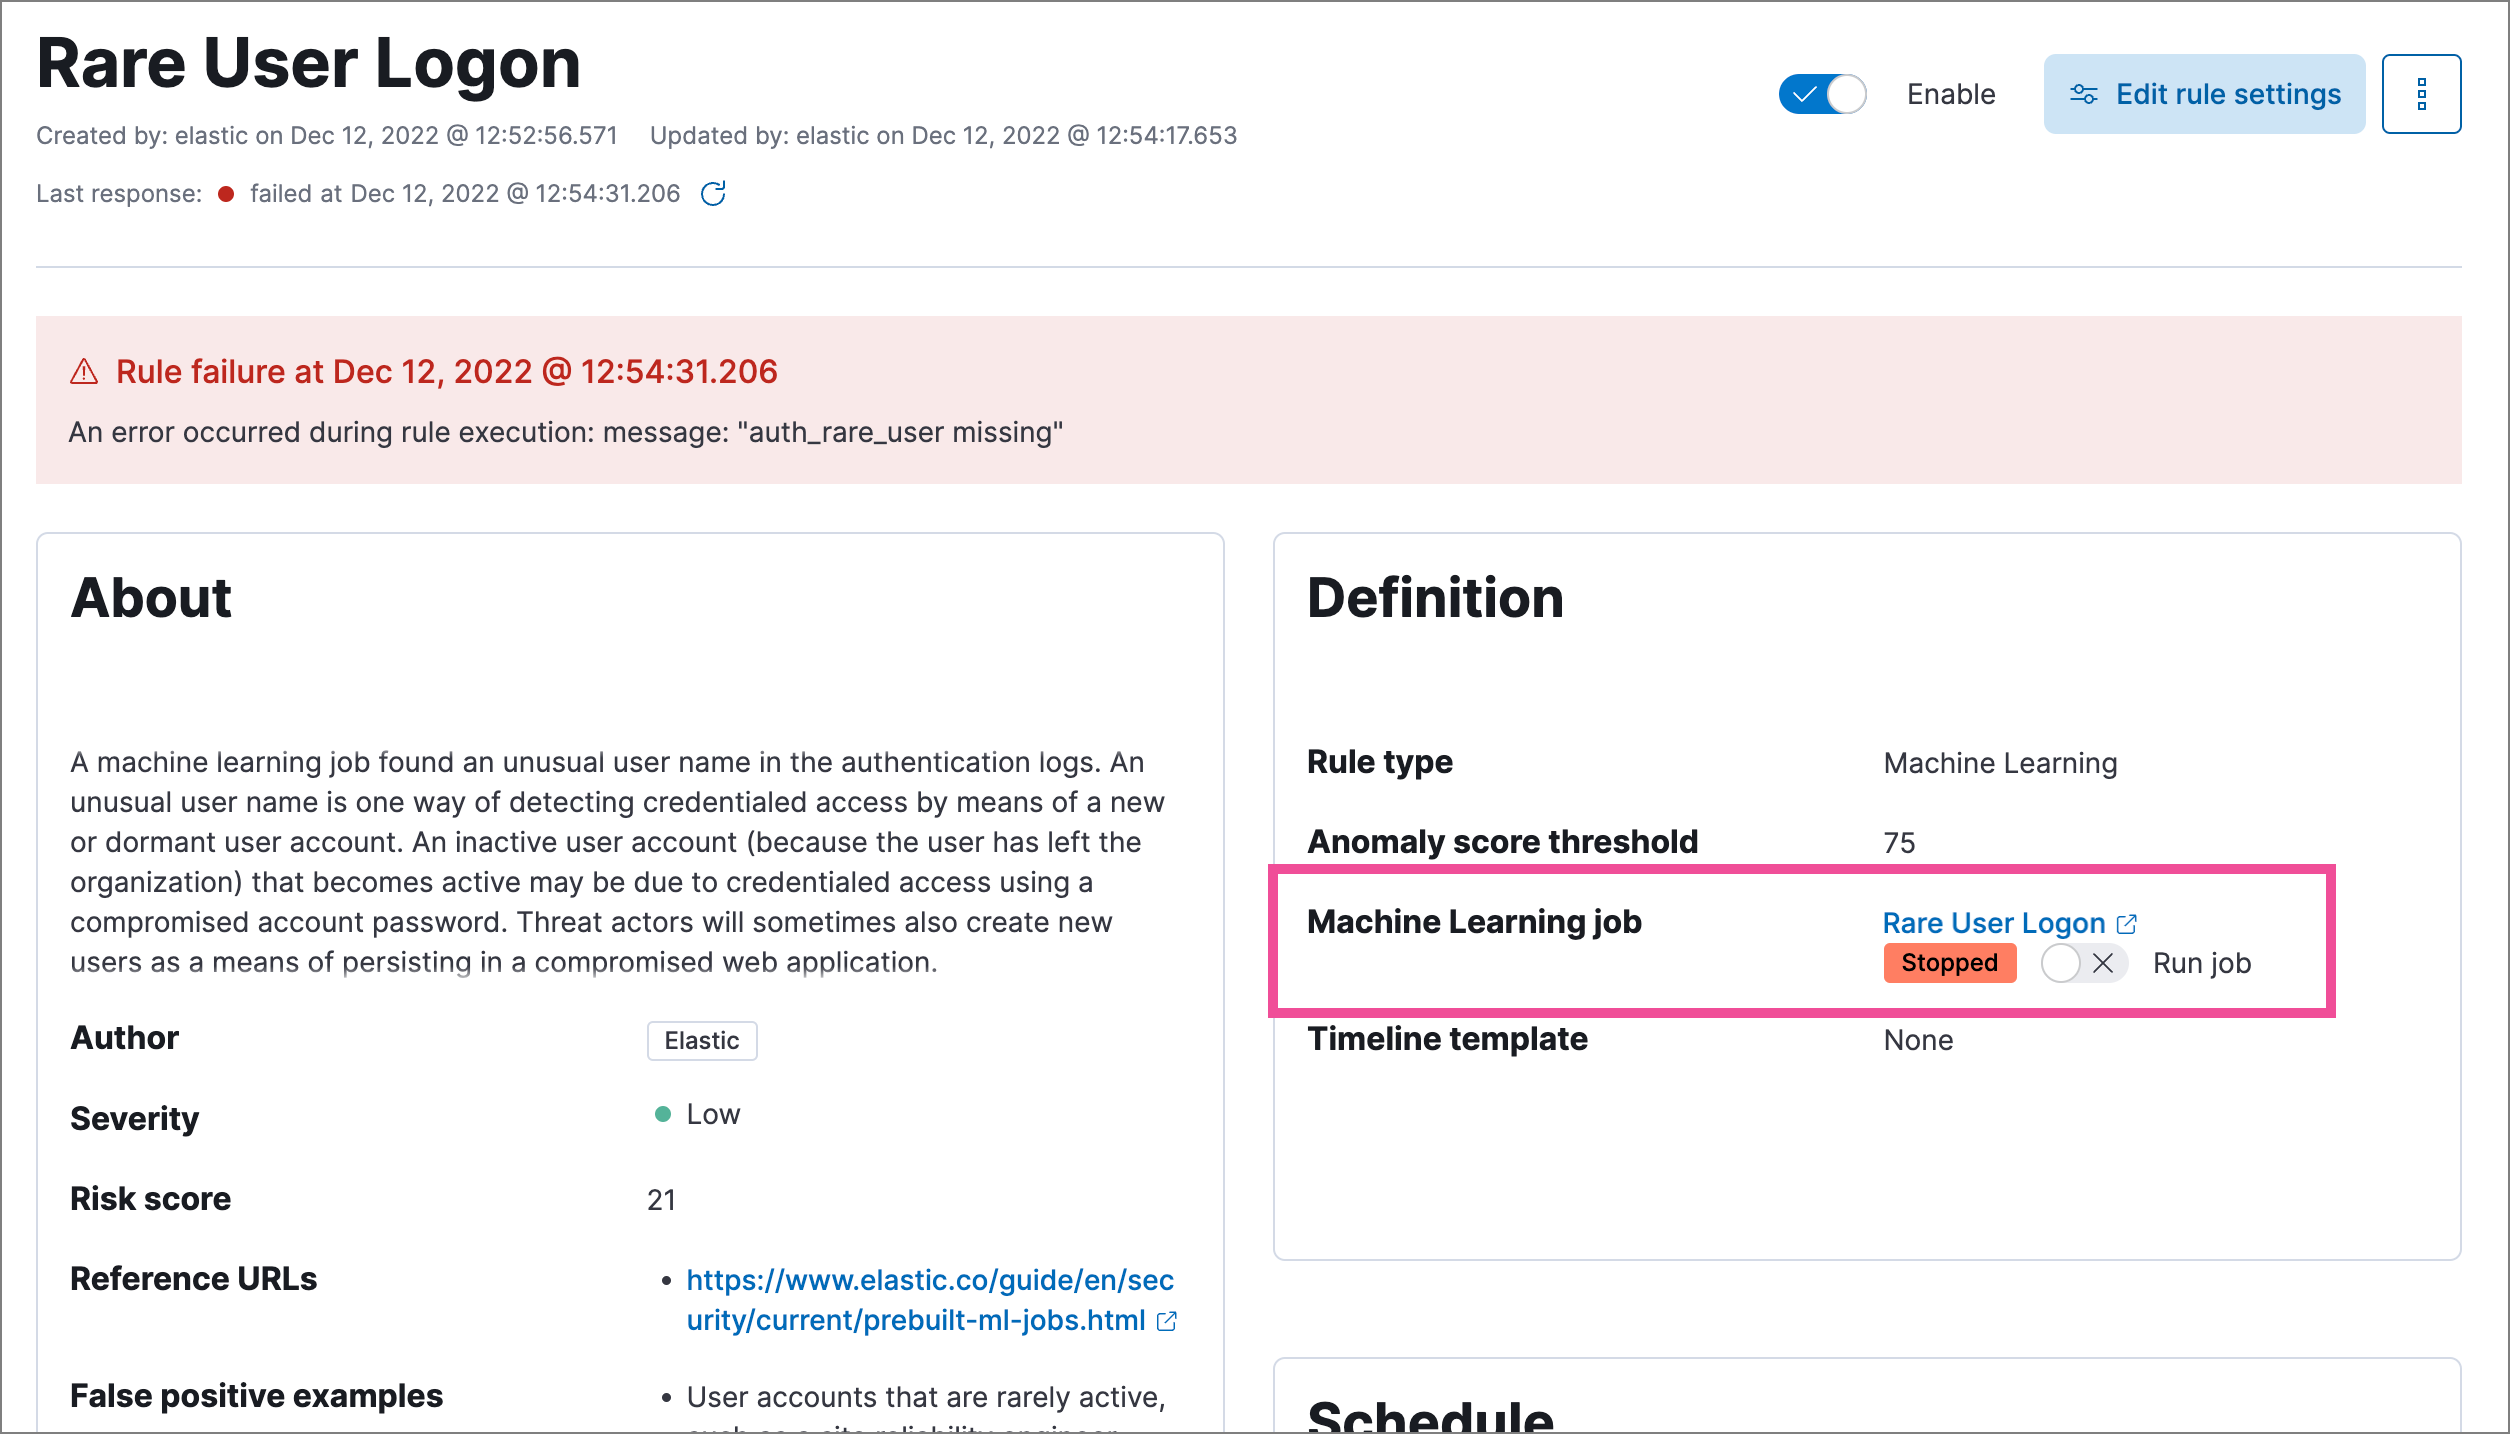
- If a required machine learning job isn’t running, turn on the Run job toggle next to it.
- Rerun the machine learning detection rule.
Rules are failing due to number of alerts
If you receive the following rule failure: "Bulk Indexing of signals failed: [parent] Data too large", this indicates that the alerts payload was too large to process.
This can be caused by bad indicator data, a misconfigured rule, or too many event matches. Review your indicator data or rule query. If nothing obvious is misconfigured, try executing the rule against a subset of the original data and continue diagnosis.
Indicator match rules are timing out
If you receive the following rule failure: "An error occurred during rule execution: message: "Request Timeout after 90000ms", this indicates that the query phase is timing out. Try refining the time frame or dividing the data defined in the query into multiple rules.
Indicator match rules are failing because the `maxClauseCount` limit is too low
If you receive the following rule failure: Bulk Indexing of signals failed: index: ".index-name" reason: "maxClauseCount is set to 1024" type: "too_many_clauses", this indicates that the limit for the total number of clauses that a query tree can have is too low. To update your maximum clause count, increase the size of your Elasticsearch JVM heap memory. 1 GB of Elasticsearch JVM heap size or more is sufficient.
General slowness
If you notice rule delays, review the suggestions above to troubleshoot, and also consider limiting the number of rules that run simultaneously, as this can cause noticeable performance implications in Kibana.
No autocomplete suggestions
When you’re creating detection rule exceptions, autocomplete might not provide suggestions in the Value field if the values don’t exist in the current page’s time range.
You can resolve this by expanding the time range, or by configuring Kibana's autocomplete feature to get suggestions from your full data set instead. Go to Kibana → Stack Management → Advanced Settings, then turn off autocomplete:useTimeRange.
Turning off autocomplete:useTimeRange could cause performance issues if the data set is especially large.
Warning about type conflicts and unmapped fields
A warning icon (![]() ) and message appear for fields with type conflicts across multiple indices or fields that are unmapped. You can learn more about the conflict by clicking the warning message.
) and message appear for fields with type conflicts across multiple indices or fields that are unmapped. You can learn more about the conflict by clicking the warning message.
A field can have type conflicts and be unmapped in specified indices.
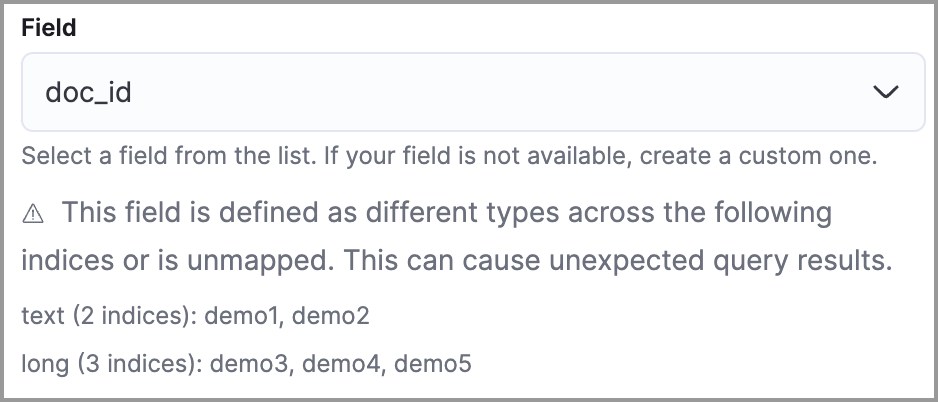
Type conflicts occur when a field is mapped to different types across multiple indices. To resolve this issue, you can create new indices with matching field type mappings and reindex your data. Otherwise, use the information about a field’s type mappings to ensure you’re entering compatible field values when defining exception conditions.
In the following example, the selected field has been defined as different types across five indices.
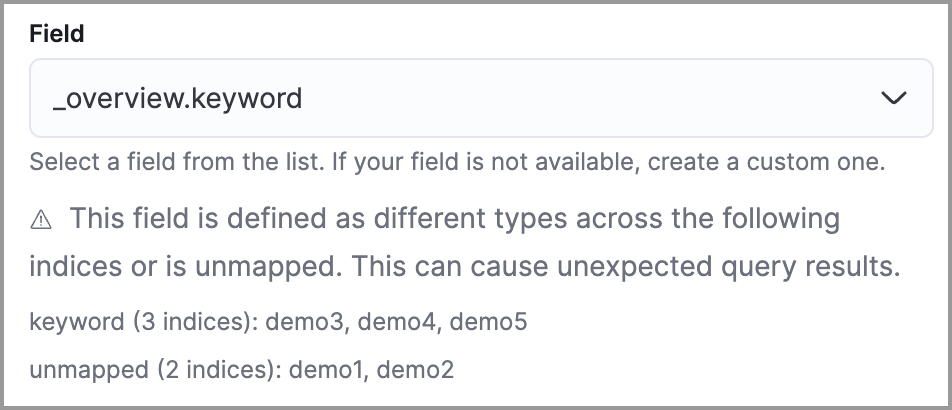
Unmapped fields are undefined within an index’s mapping definition. Using unmapped fields to define an exception can prevent it from working as expected, and lead to false positives or unexpected alerts. To fix unmapped fields, add them to your indices' mapping definitions.
In the following example, the selected field is unmapped across two indices.
Troubleshoot missing alerts
When a rule fails to run close to its scheduled time, some alerts may be missing. There are a number of ways to try to resolve this issue:
- Troubleshoot gaps
- Troubleshoot ingestion pipeline delay
- Troubleshoot missing alerts for machine learning jobs
You can also use Task Manager in Kibana to troubleshoot background tasks and processes that may be related to missing alerts:
When a rule reaches the maximum number of alerts it can generate during a single rule execution, the following warning appears on the rule’s details page and in the rule execution log: This rule reached the maximum alert limit for the rule execution. Some alerts were not created.
If you receive this warning, go to the rule’s Alerts tab and check for anything unexpected. Unexpected alerts might be created from data source issues or queries that are too broadly scoped. To further reduce alert volume, you can also add rule exceptions or suppress alerts.
If you see values in the Gaps column in the Rule Monitoring table or on the Rule details page for a small number of rules, you can edit those rules and increase their additional look-back time.
It’s recommended to set the Additional look-back time to at least 1 minute. This ensures there are no missing alerts when a rule doesn’t run exactly at its scheduled time.
Elastic Security prevents duplication. Any duplicate alerts that are discovered during the Additional look-back time are not created.
If the rule that experiences gaps is an indicator match rule, see how to tune indicator match rules. Also please note that Elastic Security provides limited support for indicator match rules.
If you see gaps for numerous rules:
- If you restarted Kibana when many rules were activated, try deactivating them and then reactivating them in small batches at staggered intervals. This ensures Kibana does not attempt to run all the rules at the same time.
- Consider adding another Kibana instance to your environment.
Even if your rule runs at its scheduled time, there might still be missing alerts if your ingestion pipeline delay is greater than your rule interval + additional look-back time. Prebuilt rules have a minimum interval + additional look-back time of 6 minutes in Elastic Stack version >=7.11.0. To avoid missed alerts for prebuilt rules, use caution to ensure that ingestion pipeline delays remain below 6 minutes.
In addition, use caution when creating custom rule schedules to ensure that the specified interval + additional look-back time is greater than your deployment’s ingestion pipeline delay.
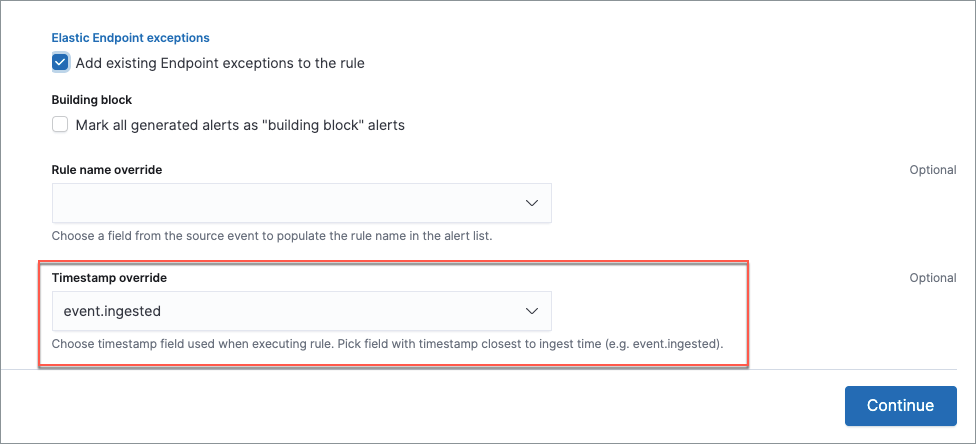
You can reduce the number of missed alerts due to ingestion pipeline delay by specifying the Timestamp override field value to event.ingested in advanced settings during rule creation or editing. The detection engine uses the value from the event.ingested field as the timestamp when executing the rule.
For example, say an event occurred at 10:00 but wasn’t ingested into Elasticsearch until 10:10 due to an ingestion pipeline delay. If you created a rule to detect that event with an interval + additional look-back time of 6 minutes, and the rule executes at 10:12, it would still detect the event because the event.ingested timestamp was from 10:10, only 2 minutes before the rule executed and well within the rule’s 6-minute interval + additional look-back time.
Elastic Stack
Machine learning detection rules use machine learning jobs that have dependencies on data fields populated by the Beats and Elastic Agent integrations. In Elastic Stack version 8.3, new machine learning jobs (prefixed with v3) were released to operate on the ECS fields available at that time.
If you’re using 8.2 or earlier versions of Beats or Elastic Agent with Elastic Stack version 8.3 or later, you may need to duplicate prebuilt rules or create new custom rules before you update the Elastic prebuilt rules. Once you update the prebuilt rules, they will only use v3 machine learning jobs. Duplicating the relevant prebuilt rules before updating them ensures continued coverage by allowing you to keep using v1 or v2 jobs (in the duplicated rules) while also running the new v3 jobs (in the updated prebuilt rules).
- Duplicated rules may result in duplicate anomaly detections and alerts.
- Ensure that the relevant
v3machine learning jobs are running before you update the Elastic prebuilt rules.
- If you only have 8.3 or later versions of Beats and Elastic Agent: You can download or update your prebuilt rules and use the latest
v3machine learning jobs. No additional action is required. - If you only have 8.2 or earlier versions of Beats or Elastic Agent, or a mix of old and new versions: To continue using the
v1andv2machine learning jobs specified by pre-8.3 prebuilt detection rules, you must duplicate affected prebuilt rules before updating them to the latest rule versions. The duplicated rules can continue using the samev1andv2machine learning jobs, and the updated prebuilt machine learning rules will use the newv3machine learning jobs. - If you have a non-Elastic data shipper that gathers ECS-compatible events: You can use the latest
v3machine learning jobs with no additional action required, as long as your data shipper uses the latest ECS specifications. However, if you’re migrating from machine learning rules usingv1/v2jobs, ensure that you start the relevantv3jobs before updating the Elastic prebuilt rules.
The following Elastic prebuilt rules use the new v3 machine learning jobs to generate alerts. Duplicate their associated v1/v2 prebuilt rules before updating them if you need continued coverage from the v1/v2 machine learning jobs:
- Unusual Linux Network Port Activity:
v3_linux_anomalous_network_port_activity - Unusual Linux Network Connection Discovery:
v3_linux_anomalous_network_connection_discovery - Anomalous Process For a Linux Population:
v3_linux_anomalous_process_all_hosts - Unusual Linux Username:
v3_linux_anomalous_user_name - Unusual Linux Process Calling the Metadata Service:
v3_linux_rare_metadata_process - Unusual Linux User Calling the Metadata Service:
v3_linux_rare_metadata_user - Unusual Process For a Linux Host:
v3_rare_process_by_host_linux - Unusual Process For a Windows Host:
v3_rare_process_by_host_windows - Unusual Windows Network Activity:
v3_windows_anomalous_network_activity - Unusual Windows Path Activity:
v3_windows_anomalous_path_activity - Anomalous Windows Process Creation:
v3_windows_anomalous_process_creation - Anomalous Process For a Windows Population:
v3_windows_anomalous_process_all_hosts - Unusual Windows Username:
v3_windows_anomalous_user_name - Unusual Windows Process Calling the Metadata Service:
v3_windows_rare_metadata_process - Unusual Windows User Calling the Metadata Service:
v3_windows_rare_metadata_user