Stream any log file
The Admin role or higher is required to onboard log data. To learn more, refer to Assign user roles and privileges.
<div style="display:none">
</div>
This guide shows you how to send a log file to your Observability project using a standalone Elastic Agent and configure the Elastic Agent and your data streams using the elastic-agent.yml file, and query your logs using the data streams you’ve set up.
The quickest way to get started is using the Monitor hosts with Elastic Agent quickstart. Refer to the quickstart documentation for more information.
To install and configure the Elastic Agent manually, refer to Manually install and configure the standalone Elastic Agent.
If you’re not using the guided instructions, follow these steps to manually install and configure your the Elastic Agent.
On your host, download and extract the installation package that corresponds with your system:
curl -L -O https://artifacts.elastic.co/downloads/beats/elastic-agent/elastic-agent-8.16.1-darwin-x86_64.tar.gz
tar xzvf elastic-agent-8.16.1-darwin-x86_64.tar.gz
curl -L -O https://artifacts.elastic.co/downloads/beats/elastic-agent/elastic-agent-8.16.1-linux-x86_64.tar.gz
tar xzvf elastic-agent-8.16.1-linux-x86_64.tar.gz
# PowerShell 5.0+
wget https://artifacts.elastic.co/downloads/beats/elastic-agent/elastic-agent-8.16.1-windows-x86_64.zip -OutFile elastic-agent-8.16.1-windows-x86_64.zip
Expand-Archive .\elastic-agent-8.16.1-windows-x86_64.zip
Or manually:
- Download the Elastic Agent Windows zip file from the download page.
- Extract the contents of the zip file.
To simplify upgrading to future versions of Elastic Agent, we recommended that you use the tarball distribution instead of the DEB distribution.
curl -L -O https://artifacts.elastic.co/downloads/beats/elastic-agent/elastic-agent-8.16.1-amd64.deb
sudo dpkg -i elastic-agent-8.16.1-amd64.deb
To simplify upgrading to future versions of Elastic Agent, we recommended that you use the tarball distribution instead of the RPM distribution.
curl -L -O https://artifacts.elastic.co/downloads/beats/elastic-agent/elastic-agent-8.16.1-x86_64.rpm
sudo rpm -vi elastic-agent-8.16.1-x86_64.rpm
After downloading and extracting the installation package, you’re ready to install the Elastic Agent. From the agent directory, run the install command that corresponds with your system:
On macOS, Linux (tar package), and Windows, run the install command to install and start Elastic Agent as a managed service and start the service. The DEB and RPM packages include a service unit for Linux systems with systemd, For these systems, you must enable and start the service.
You must run this command as the root user because some integrations require root privileges to collect sensitive data.
sudo ./elastic-agent install
You must run this command as the root user because some integrations require root privileges to collect sensitive data.
sudo ./elastic-agent install
Open a PowerShell prompt as an Administrator (right-click the PowerShell icon and select Run As Administrator).
From the PowerShell prompt, change to the directory where you installed Elastic Agent, and run:
.\elastic-agent.exe install
You must run this command as the root user because some integrations require root privileges to collect sensitive data.
sudo systemctl enable elastic-agent   1
sudo systemctl start elastic-agent
- The DEB package includes a service unit for Linux systems with systemd. On these systems, you can manage Elastic Agent by using the usual systemd commands. If you don’t have systemd, run
sudo service elastic-agent start.
You must run this command as the root user because some integrations require root privileges to collect sensitive data.
sudo systemctl enable elastic-agent   1
sudo systemctl start elastic-agent
- The RPM package includes a service unit for Linux systems with systemd. On these systems, you can manage Elastic Agent by using the usual systemd commands. If you don’t have systemd, run
sudo service elastic-agent start.
During installation, you’ll be prompted with some questions:
- When asked if you want to install the agent as a service, enter
Y. - When asked if you want to enroll the agent in Fleet, enter
n.
After your agent is installed, configure it by updating the elastic-agent.yml file.
You’ll find the elastic-agent.yml in one of the following locations according to your system:
Main Elastic Agent configuration file location:
/Library/Elastic/Agent/elastic-agent.yml
Main Elastic Agent configuration file location:
/opt/Elastic/Agent/elastic-agent.yml
Main Elastic Agent configuration file location:
C:\Program Files\Elastic\Agent\elastic-agent.yml
Main Elastic Agent configuration file location:
/etc/elastic-agent/elastic-agent.yml
Main Elastic Agent configuration file location:
/etc/elastic-agent/elastic-agent.yml
Update the default configuration in the elastic-agent.yml file manually. It should look something like this:
outputs:
  default:
    type: elasticsearch
    hosts: '<your-elasticsearch-endpoint>:<port>'
    api_key: 'your-api-key'
inputs:
  - id: your-log-id
    type: filestream
    streams:
      - id: your-log-stream-id
        data_stream:
          dataset: example
        paths:
          - /var/log/your-logs.log
You need to set the values for the following fields:
hosts-
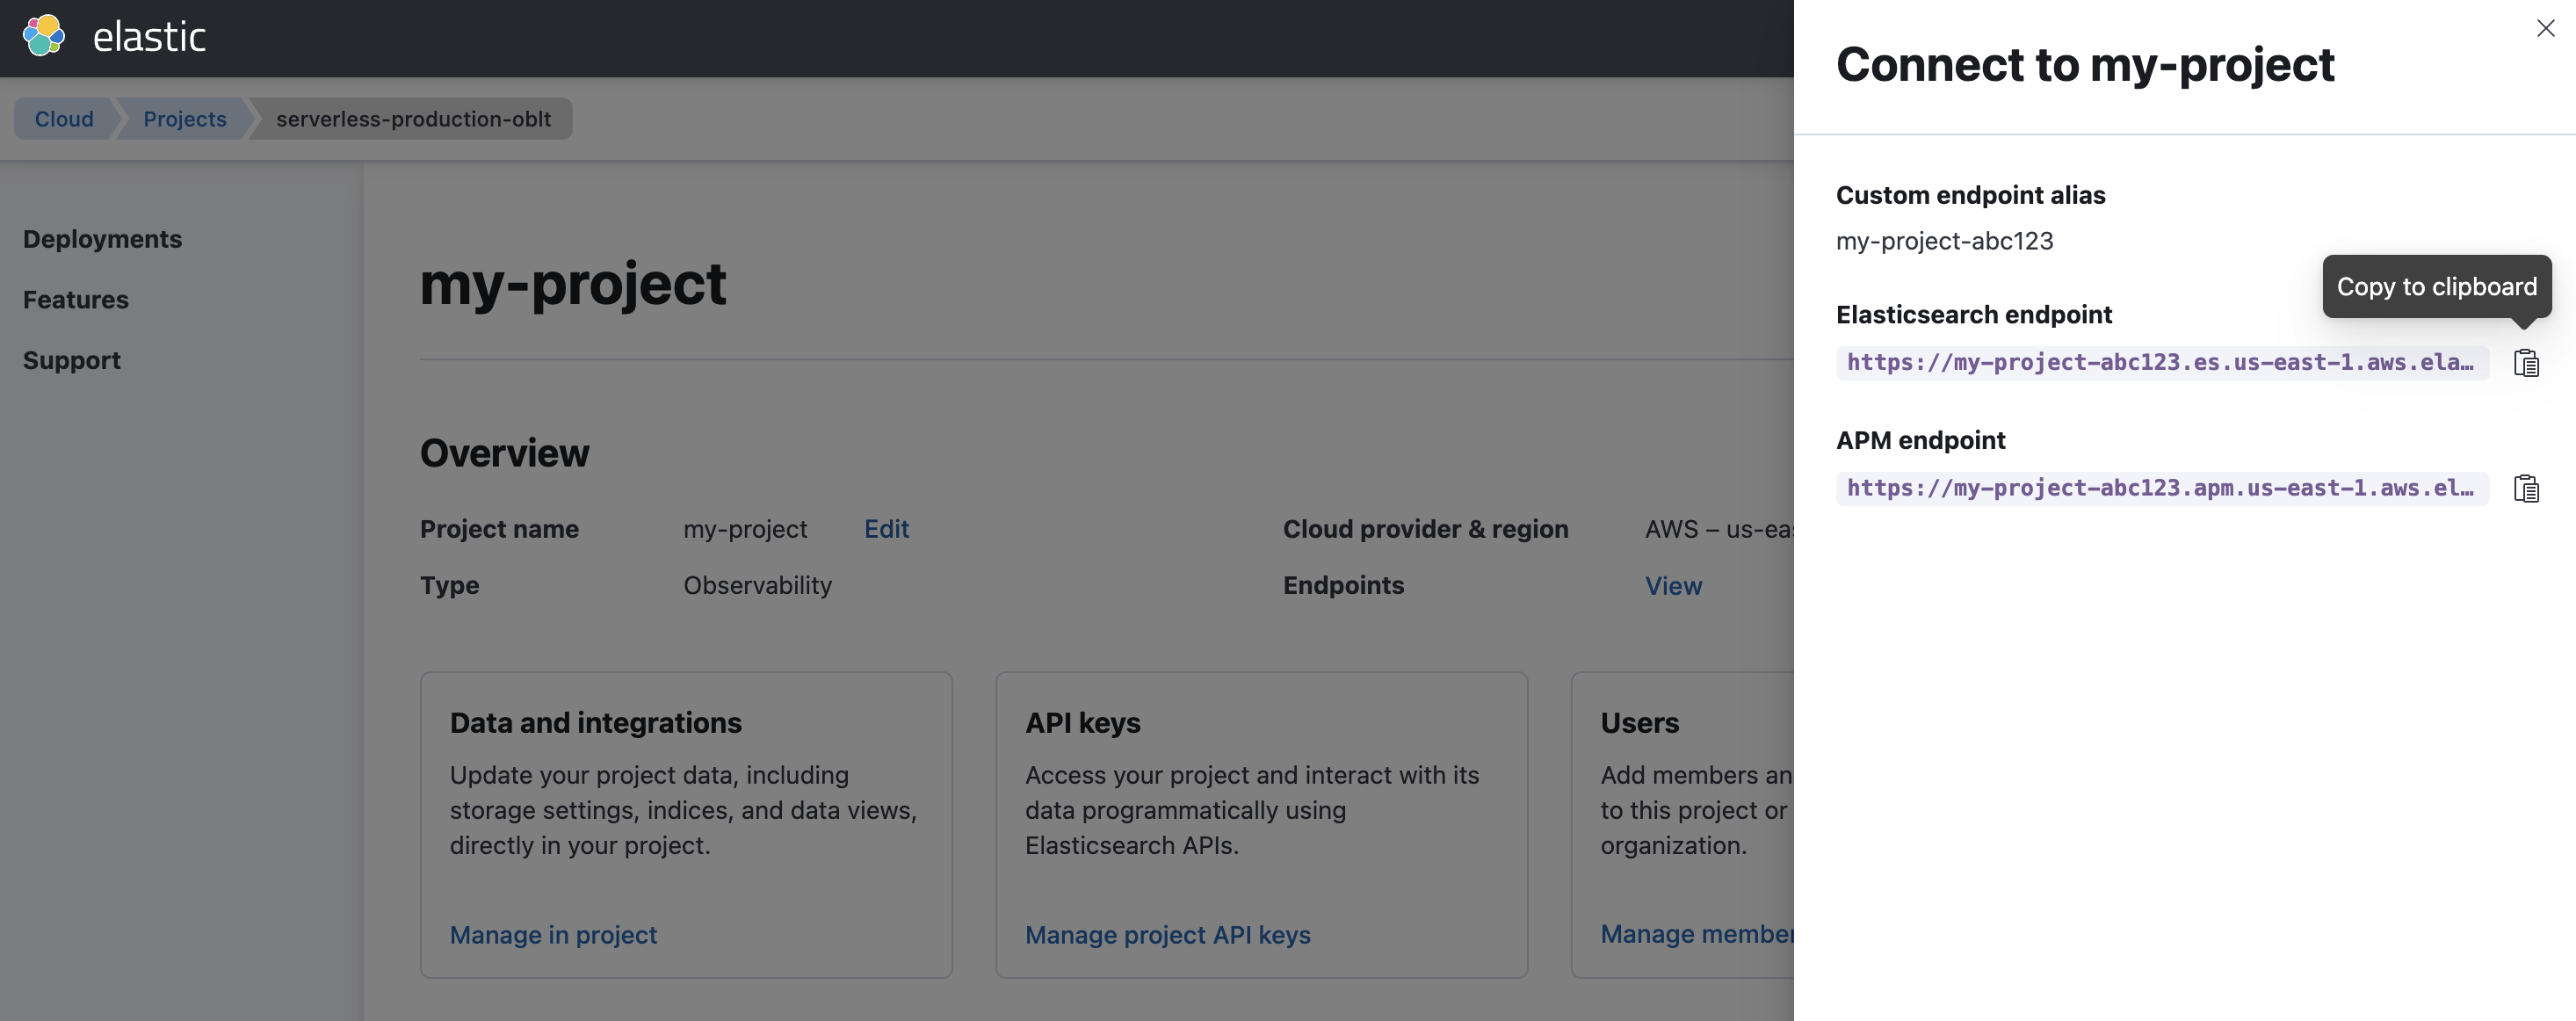
Copy the Elasticsearch endpoint from your project’s page and add the port (the default port is
443). For example,https://my-deployment.es.us-central1.gcp.cloud.es.io:443.If you’re following the guided instructions in your project, the Elasticsearch endpoint will be prepopulated in the configuration file.
TipIf you need to find your project’s Elasticsearch endpoint outside the guided instructions:
- Go to the Projects page that lists all your projects.
- Click Manage next to the project you want to connect to.
- Click View next to Endpoints.
- Copy the Elasticsearch endpoint.
api-key-
Use an API key to grant the agent access to your project. The API key format should be
<id>:<key>.If you’re following the guided instructions in your project, an API key will be autogenerated and will be prepopulated in the downloadable configuration file.
If configuring the Elastic Agent manually, create an API key:
- Navigate to Project settings → Management* → *API keys and click Create API key.
- Select Restrict privileges and add the following JSON to give privileges for ingesting logs.
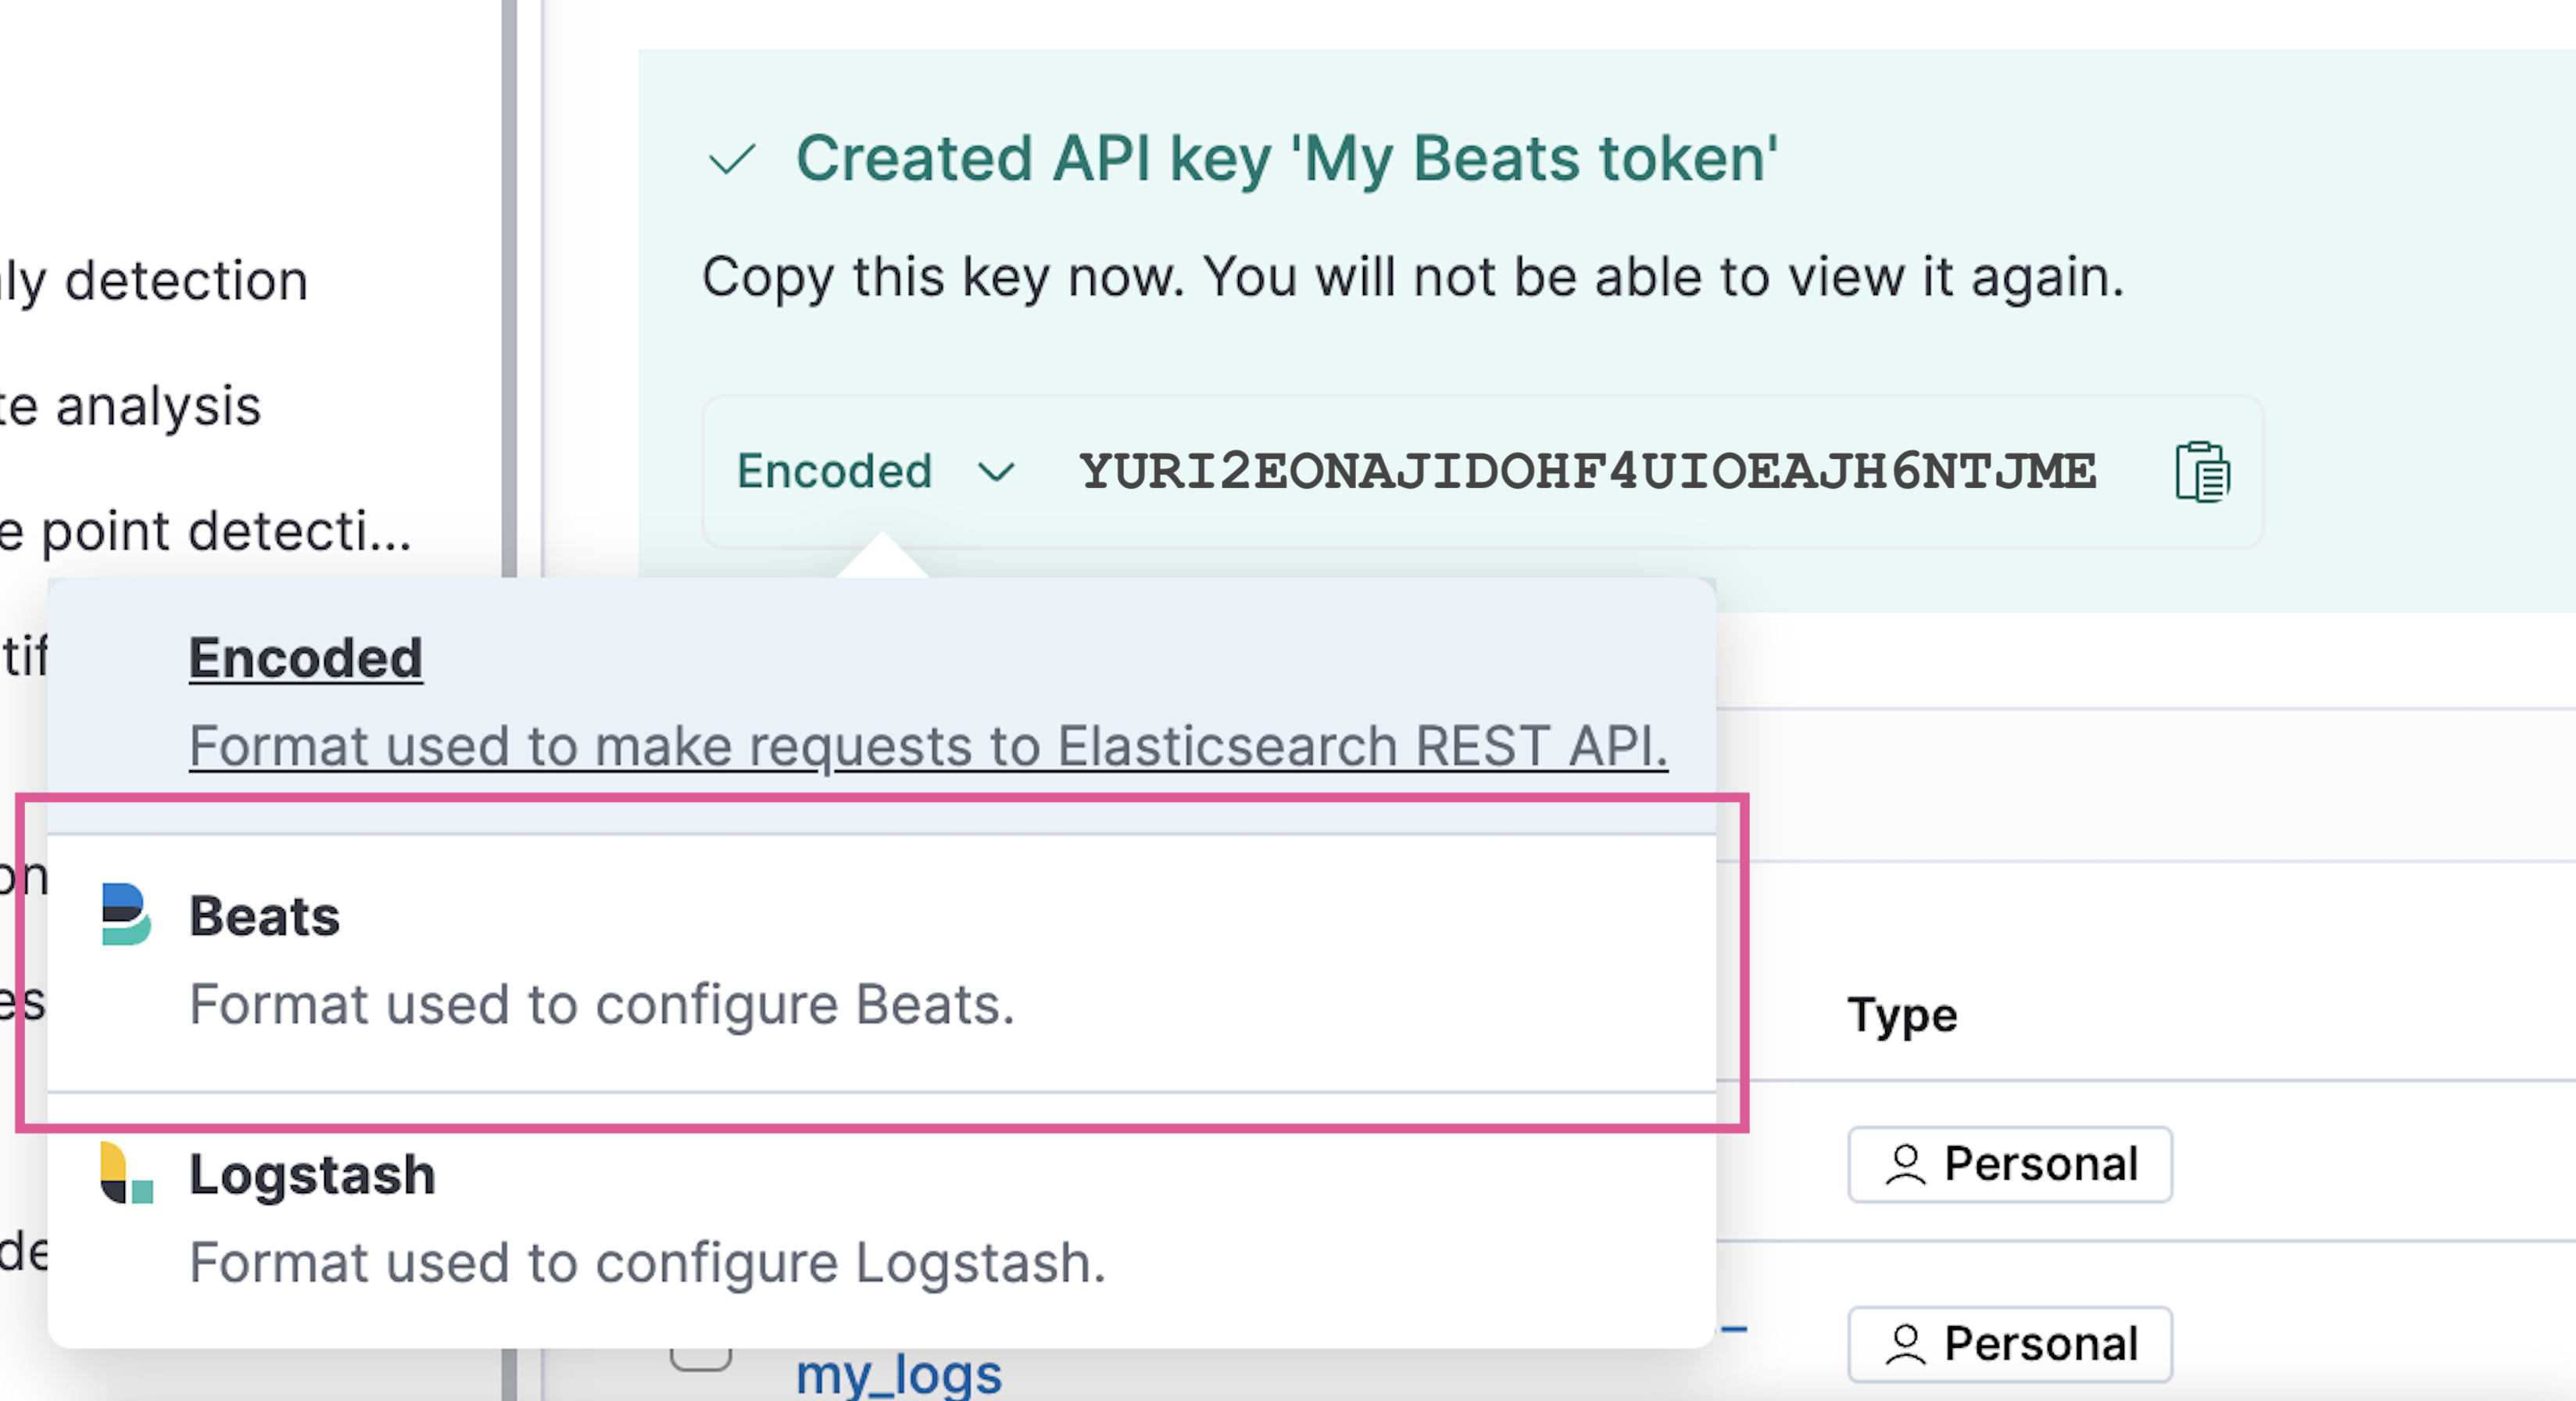
json { "standalone_agent": { "cluster": [ "monitor" ], "indices": [ { "names": [ "logs-*-*" ], "privileges": [ "auto_configure", "create_doc" ] } ] } }- You must set the API key to configure Beats. Immediately after the API key is generated and while it is still being displayed, click the Encoded button next to the API key and select Beats from the list in the tooltip. Base64 encoded API keys are not currently supported in this configuration.
inputs.id- A unique identifier for your input.
type- The type of input. For collecting logs, set this to
filestream. streams.id- A unique identifier for your stream of log data.
data_stream.dataset- The name for your dataset data stream. Name this data stream anything that signifies the source of the data. In this configuration, the dataset is set to
example. The default value isgeneric. paths- The path to your log files. You can also use a pattern like
/var/log/your-logs.log*.
After updating your configuration file, you need to restart the Elastic Agent.
First, stop the Elastic Agent and its related executables using the command that works with your system:
sudo launchctl unload /Library/LaunchDaemons/co.elastic.elastic-agent.plist
Elastic Agent will restart automatically if the system is rebooted.
sudo service elastic-agent stop
Elastic Agent will restart automatically if the system is rebooted.
Stop-Service Elastic Agent
If necessary, use Task Manager on Windows to stop Elastic Agent. This will kill the elastic-agent process and any sub-processes it created (such as Beats).
Elastic Agent will restart automatically if the system is rebooted.
The DEB package includes a service unit for Linux systems with systemd. On these systems, you can manage Elastic Agent by using the usual systemd commands.
Use systemctl to stop the agent:
sudo systemctl stop elastic-agent
Otherwise, use:
sudo service elastic-agent stop
Elastic Agent will restart automatically if the system is rebooted.
The RPM package includes a service unit for Linux systems with systemd. On these systems, you can manage Elastic Agent by using the usual systemd commands.
Use systemctl to stop the agent:
sudo systemctl stop elastic-agent
Otherwise, use:
sudo service elastic-agent stop
Elastic Agent will restart automatically if the system is rebooted.
Next, restart the Elastic Agent using the command that works with your system:
sudo launchctl load /Library/LaunchDaemons/co.elastic.elastic-agent.plist
sudo service elastic-agent start
Start-Service Elastic Agent
The DEB package includes a service unit for Linux systems with systemd. On these systems, you can manage Elastic Agent by using the usual systemd commands.
Use systemctl to start the agent:
sudo systemctl start elastic-agent
Otherwise, use:
sudo service elastic-agent start
The RPM package includes a service unit for Linux systems with systemd. On these systems, you can manage Elastic Agent by using the usual systemd commands.
Use systemctl to start the agent:
sudo systemctl start elastic-agent
Otherwise, use:
sudo service elastic-agent start
If you’re not seeing your log files in your project, verify the following in the elastic-agent.yml file:
- The path to your logs file under
pathsis correct. - Your API key is in
<id>:<key>format. If not, your API key may be in an unsupported format, and you’ll need to create an API key in Beats format.
If you’re still running into issues, refer to Elastic Agent troubleshooting and Configure standalone Elastic Agents.
After you have your agent configured and are streaming log data to your project:
- Refer to the Parse and organize logs documentation for information on extracting structured fields from your log data, rerouting your logs to different data streams, and filtering and aggregating your log data.
- Refer to the Filter and aggregate logs documentation for information on filtering and aggregating your log data to find specific information, gain insight, and monitor your systems more efficiently.