Detect change points in Discover
Use an ES|QL CHANGE_POINT query in Discover to find statistically significant changes in time series data, such as spikes, dips, and shifts in distribution or trend. Discover charts each analyzed series, marks detected changes, and keeps the results table available for investigation.
- You need a Platinum or Enterprise subscription or an active trial for Elastic Stack. On Elastic Cloud Serverless,
CHANGE_POINTis available for all project types. - To analyze your own data, you need a date field and values that you can aggregate into a numeric metric. The
CHANGE_POINTcommand requires at least 22 values per series. - To follow the example, add the Sample web logs data.
In this example, you use the sample web logs data to detect changes in the average number of bytes transferred for each destination country.
Find Discover in the navigation menu or use the global search field.
Switch to ES|QL mode. Refer to Using ES|QL for the available options.
Set the time range to All time, or select a range that covers at least one month of the sample data.
Enter the following query:
FROM kibana_sample_data_logs
| STATS avg_bytes = AVG(bytes) BY geo.dest, day = BUCKET(timestamp, 1d)
| CHANGE_POINT avg_bytes ON day BY geo.dest
| WHERE type IS NOT NULL
The query calculates the average number of bytes transferred each day for every destination country, then returns the detected change points.
Select Search.
Discover shows a separate chart for each destination country with a detected change point. The results table lists the detected changes. A lower p-value indicates a more significant change.
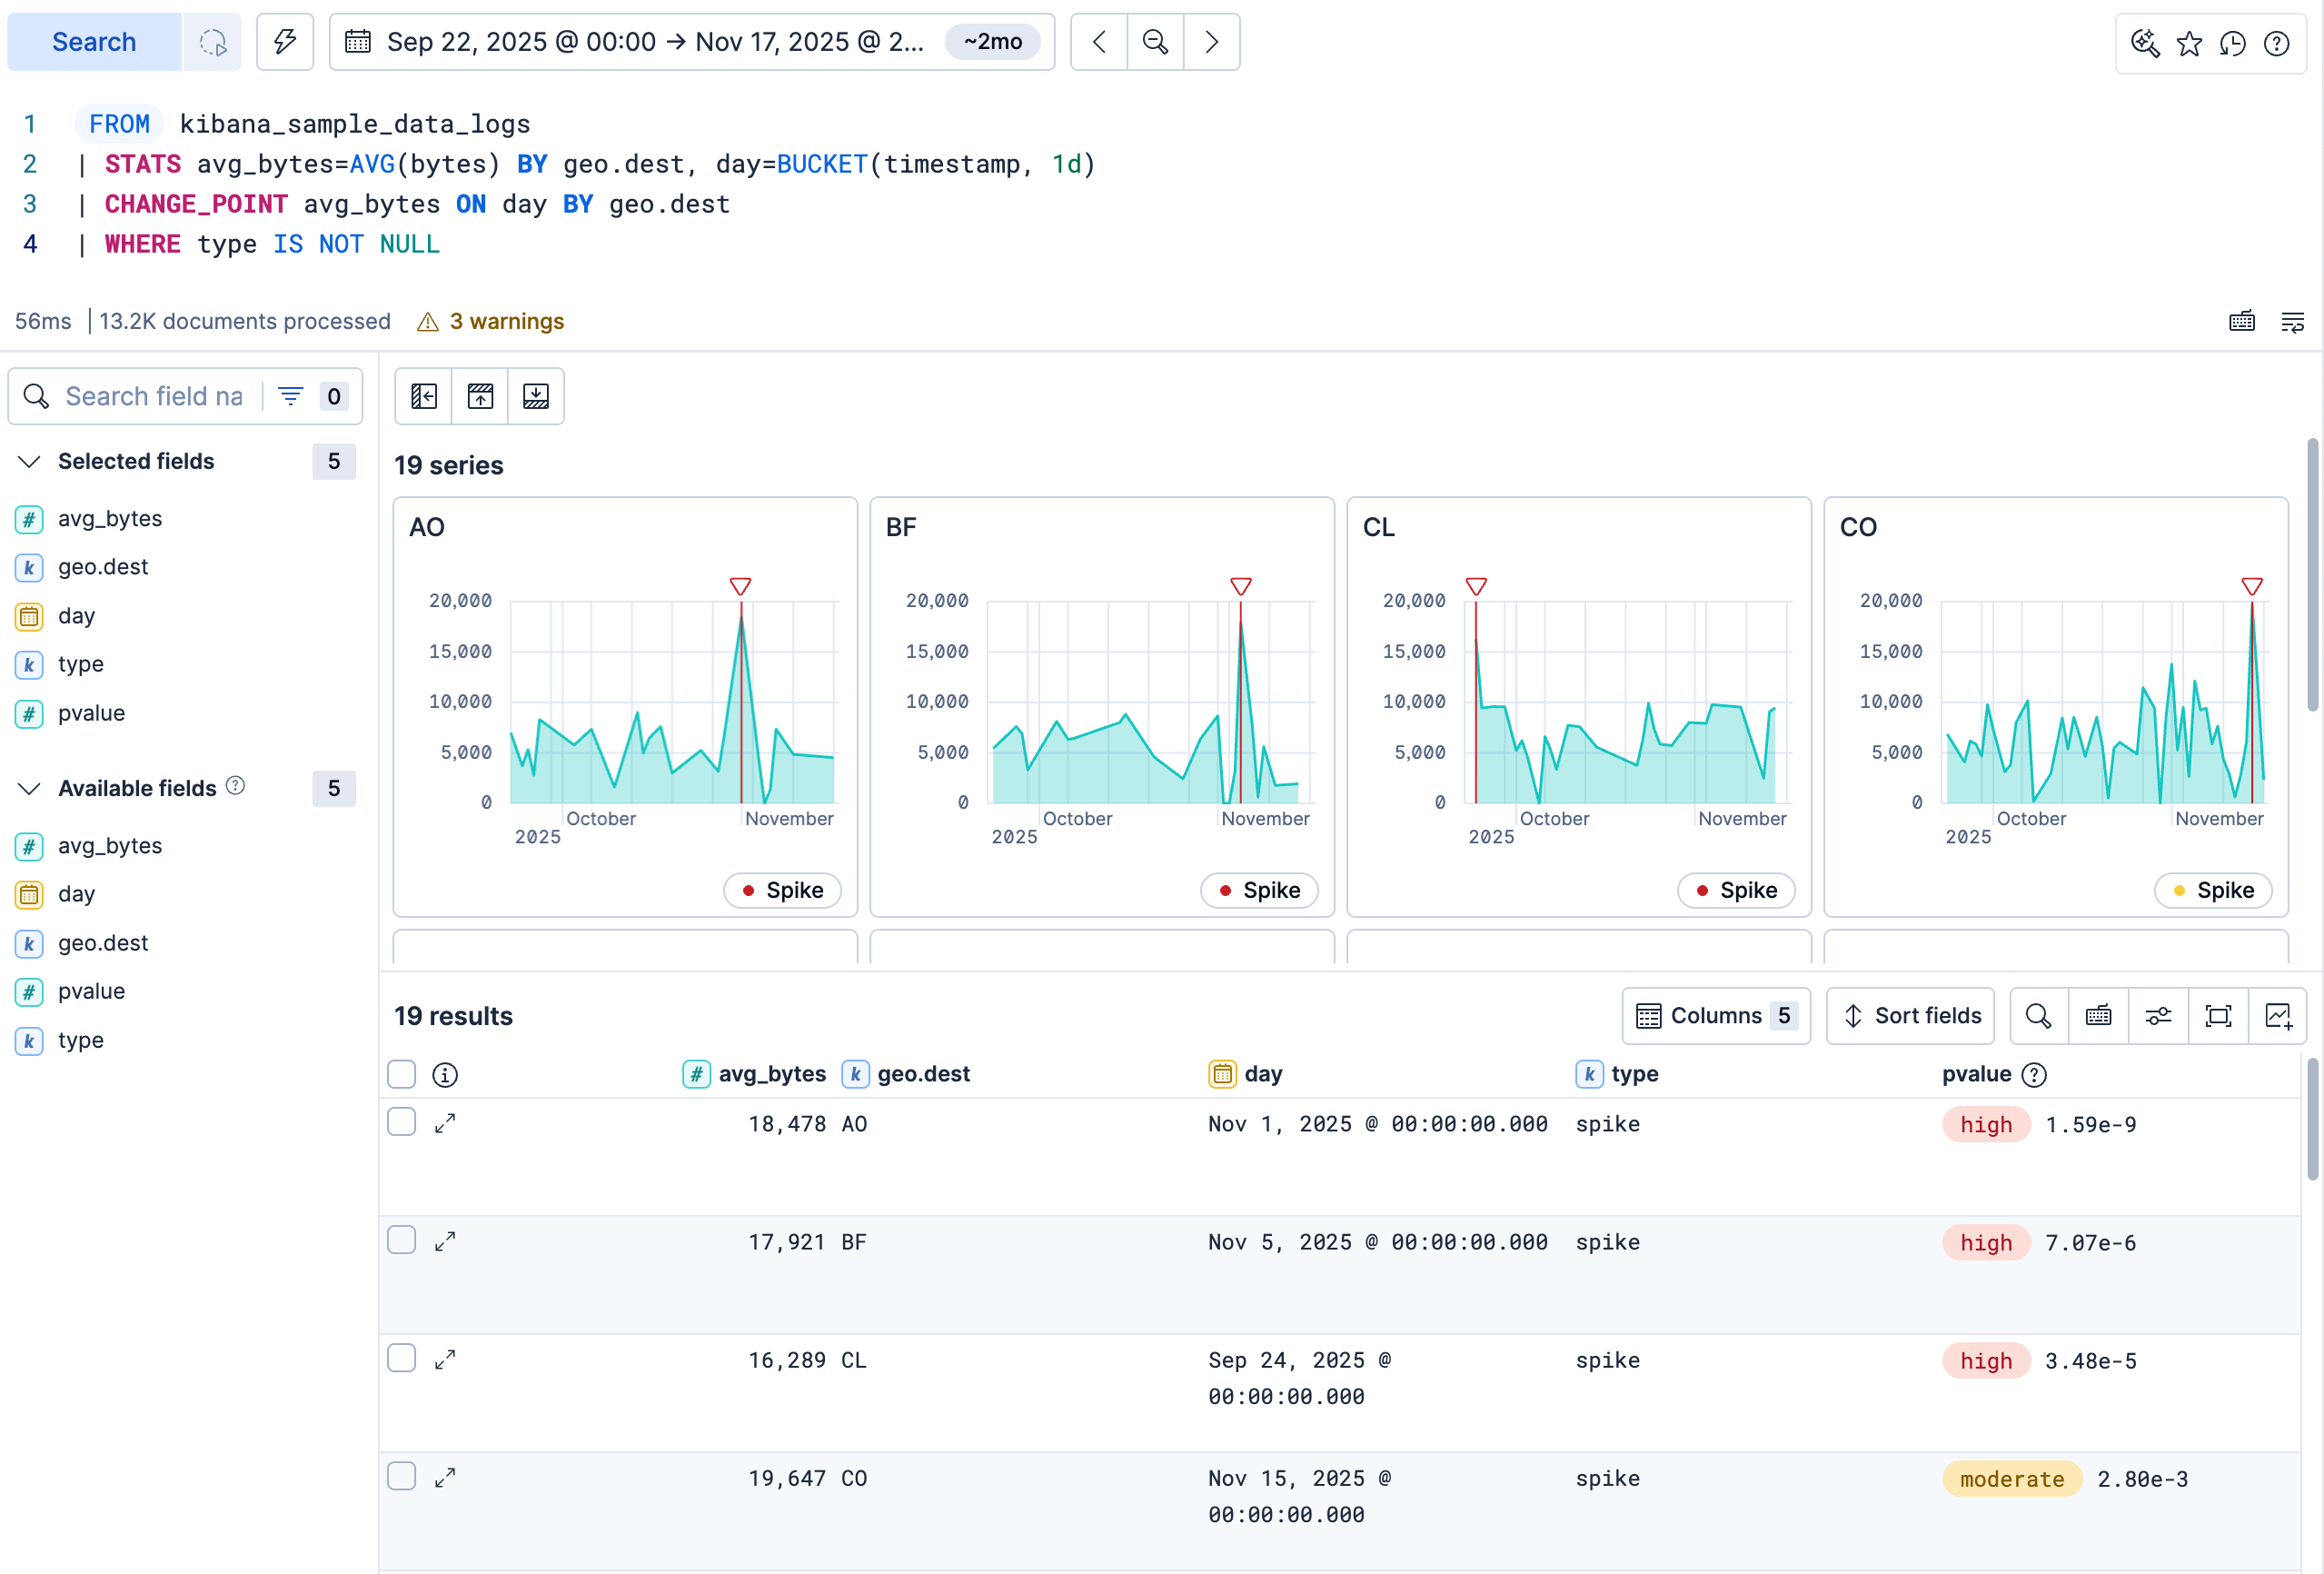
After Discover shows the results, you can:
Attach a chart to a case: Hover over the chart and select Add to case. Then select an existing case or create a case. You need the
AllCases privilege to use this action.Inspect a change point: Expand a change point in the results table. The Overview tab shows its chart, time, metric, type, p-value, and description.
Open a focused view: From the chart actions, select Open in a new Discover tab to open the series in a focused time range around the detected change.
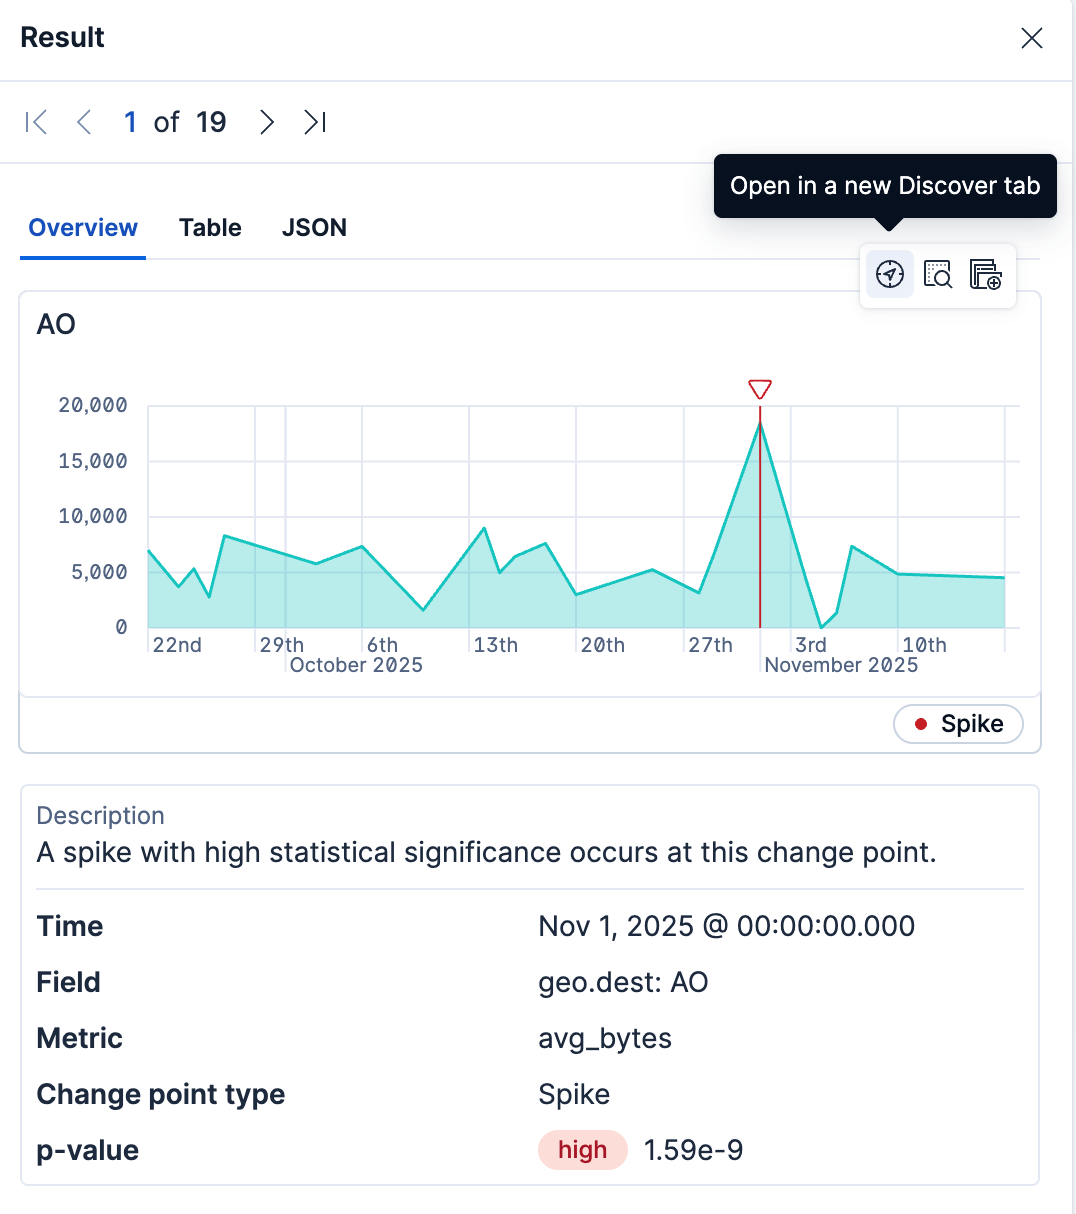
Save the session: Save the Discover session to preserve the query and time range.
For indexed data, structure your query so that it produces one numeric metric value per time bucket before calling CHANGE_POINT. For example, the following query analyzes changes in log volume over the selected time range:
FROM logs-*
| WHERE @timestamp <= ?_tend AND @timestamp > ?_tstart
| STATS event_count = COUNT(*) BY time_bucket = BUCKET(@timestamp, 50, ?_tstart, ?_tend)
| SORT time_bucket
| CHANGE_POINT event_count ON time_bucket
| WHERE type IS NOT NULL
- Adapt the query to your data: Replace the index, time field, and aggregation with values appropriate for your data.
- If no change points are detected: The data either has no statistically significant change or doesn't provide the 22 values required for analysis. Widen the time range or adjust the bucket size to provide more values.
- Inspect source documents: For queries that read from an index, Open in a new Discover tab opens the source documents in a focused time range around the detected change.
Add fields to BY to analyze each unique combination as a separate series. For example, the following query analyzes the sum of transferred bytes for each host and response code in the sample web logs data:
FROM kibana_sample_data_logs
| STATS sum_bytes = SUM(bytes) BY host, response.keyword, day = BUCKET(timestamp, 1d)
| CHANGE_POINT sum_bytes ON day BY host, response.keyword
| WHERE type IS NOT NULL
Discover displays a separate chart for each group that contains a detected change point. Use the chart grid to compare where each series changed.