Kubernetes observability with Elastic OpenTelemetry
The quickstart guides for Kubernetes install a set of different Elastic Agents and Elastic OTel SDKs to cover collection of OpenTelemetry data for infrastructure monitoring, logs collection and application monitoring.
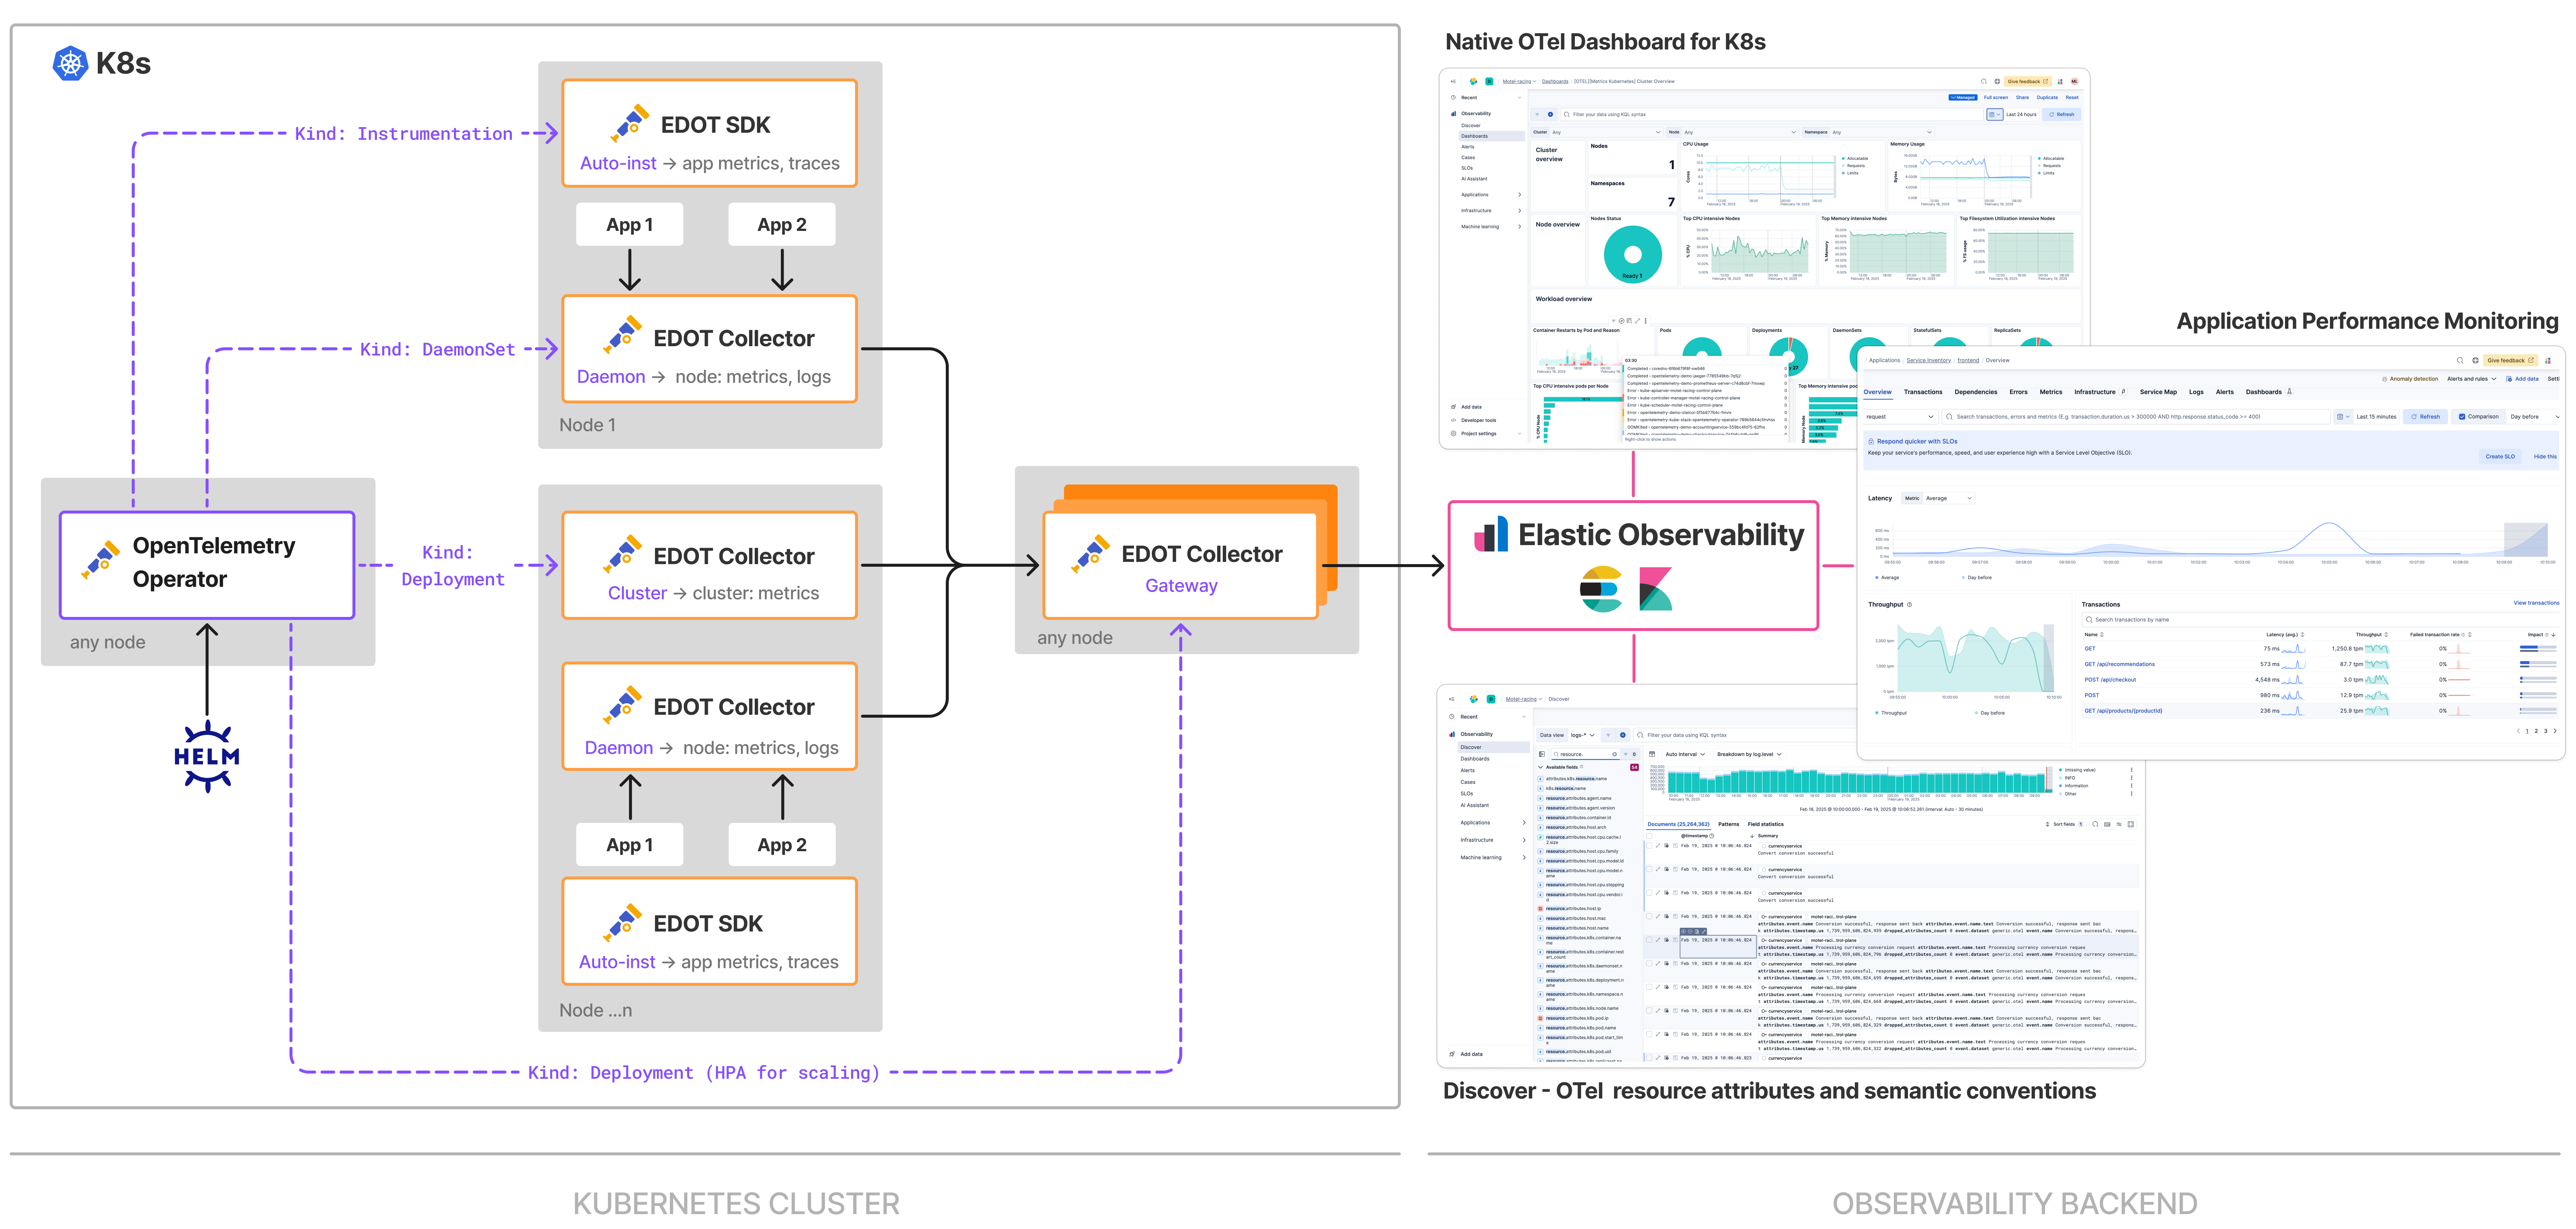
The Kubernetes setup relies on the OpenTelemetry Operator, configured to automate orchestration of Elastic OpenTelemetry as follows:
- Elastic Agent Cluster: Collection of cluster metrics.
- Elastic Agent Daemon: Collection of node metrics, logs, and application telemetry.
- Elastic Agent Gateway: Preprocessing, aggregation, and ingestion of data into Elastic.
- Elastic OTel SDKs: Annotated applications are auto-instrumented with Elastic OTel SDKs.
The following diagram summarizes the previous components and how they interact with Elastic:
Read on to learn how to:
- Install the OpenTelemetry Operator using the kube-stack Helm chart.
- Use the Elastic Agents to send Kubernetes logs, metrics, and application traces to an Elasticsearch cluster.
- Use the operator for applications auto-instrumentation in all supported languages.