Collect Elastic Agent Builder traces
Elastic Agent Builder can collect agent execution traces into your Elasticsearch deployment. Traces record how each agent round runs, including model calls, tool calls, latency, and token usage, so you can monitor agent activity, debug behavior, and build dashboards on the data.
Traces are stored in Elasticsearch, but you do not have to query the data stream to read them. Elastic Agent Builder gives you three ways to work with collected traces:
| To do this | Use |
|---|---|
| Debug a single agent response, step by step | The View Trace waterfall on a conversation round in Agent Chat |
| Monitor token usage, latency, and tool errors across all agents | The prebuilt overview dashboard |
| Ask questions about trace data in natural language | The built-in traces skill |
You can also explore the raw spans yourself in Discover or with ES|QL, as described in Build dashboards on trace data.
When an agent runs, Elastic Agent Builder records the run as OpenTelemetry (OTel) traces. Each trace covers one conversation round. A trace is made up of spans that map to the work the agent did, such as model calls and tool calls.
Trace collection is space-aware. Each Kibana space writes its traces to its own data stream, named with the space id, such as traces-agent_builder.otel-default for the default space. Use the traces-agent_builder.otel-* wildcard to work with every space's traces at once.
Elastic Agent Builder ingests this data into managed OpenTelemetry data streams in your Elasticsearch deployment. Execution spans, such as model calls and tool calls, are stored in traces-agent_builder.otel-*, with their timings, token usage, model, and status.
When you opt in to capturing conversation content, that content is stored as span attributes in traces-agent_builder.otel-*. The chat spans contain the chat history, the model responses, and the system prompt, and the execute_tool spans contain the arguments and results of each tool call. Content is captured only when you enable it in Trace privacy settings.
These data streams are OTel-compatible and use the standard OTel index templates, so they inherit the mappings, settings, and data lifecycle that Elasticsearch maintains for OTel data.
These are regular data streams, not system or hidden indices. You can explore and analyze the data with the same tools you use for any other data in Elasticsearch, including Discover, Dashboards, Lens, and ES|QL.
Each trace is a set of spans that follow a run from the overall conversation round down to its individual steps, including:
- Each agent execution.
- Each model call.
- Each tool call.
Spans follow OpenTelemetry semantic conventions for generative AI (currently experimental) and contain generative AI attributes for the model, the provider, and token usage. Use them to break down usage and latency by model, agent, or tool. For the exact fields and the prebuilt visualizations that use them, refer to Build dashboards on trace data.
By default, traces record structural metadata only. Conversation content such as prompts and responses is excluded unless an administrator opts in. For details, refer to Trace privacy settings.
Trace collection is on by default. To manage it, go to Stack Management → GenAI Settings and open the Agent Builder Traces section.
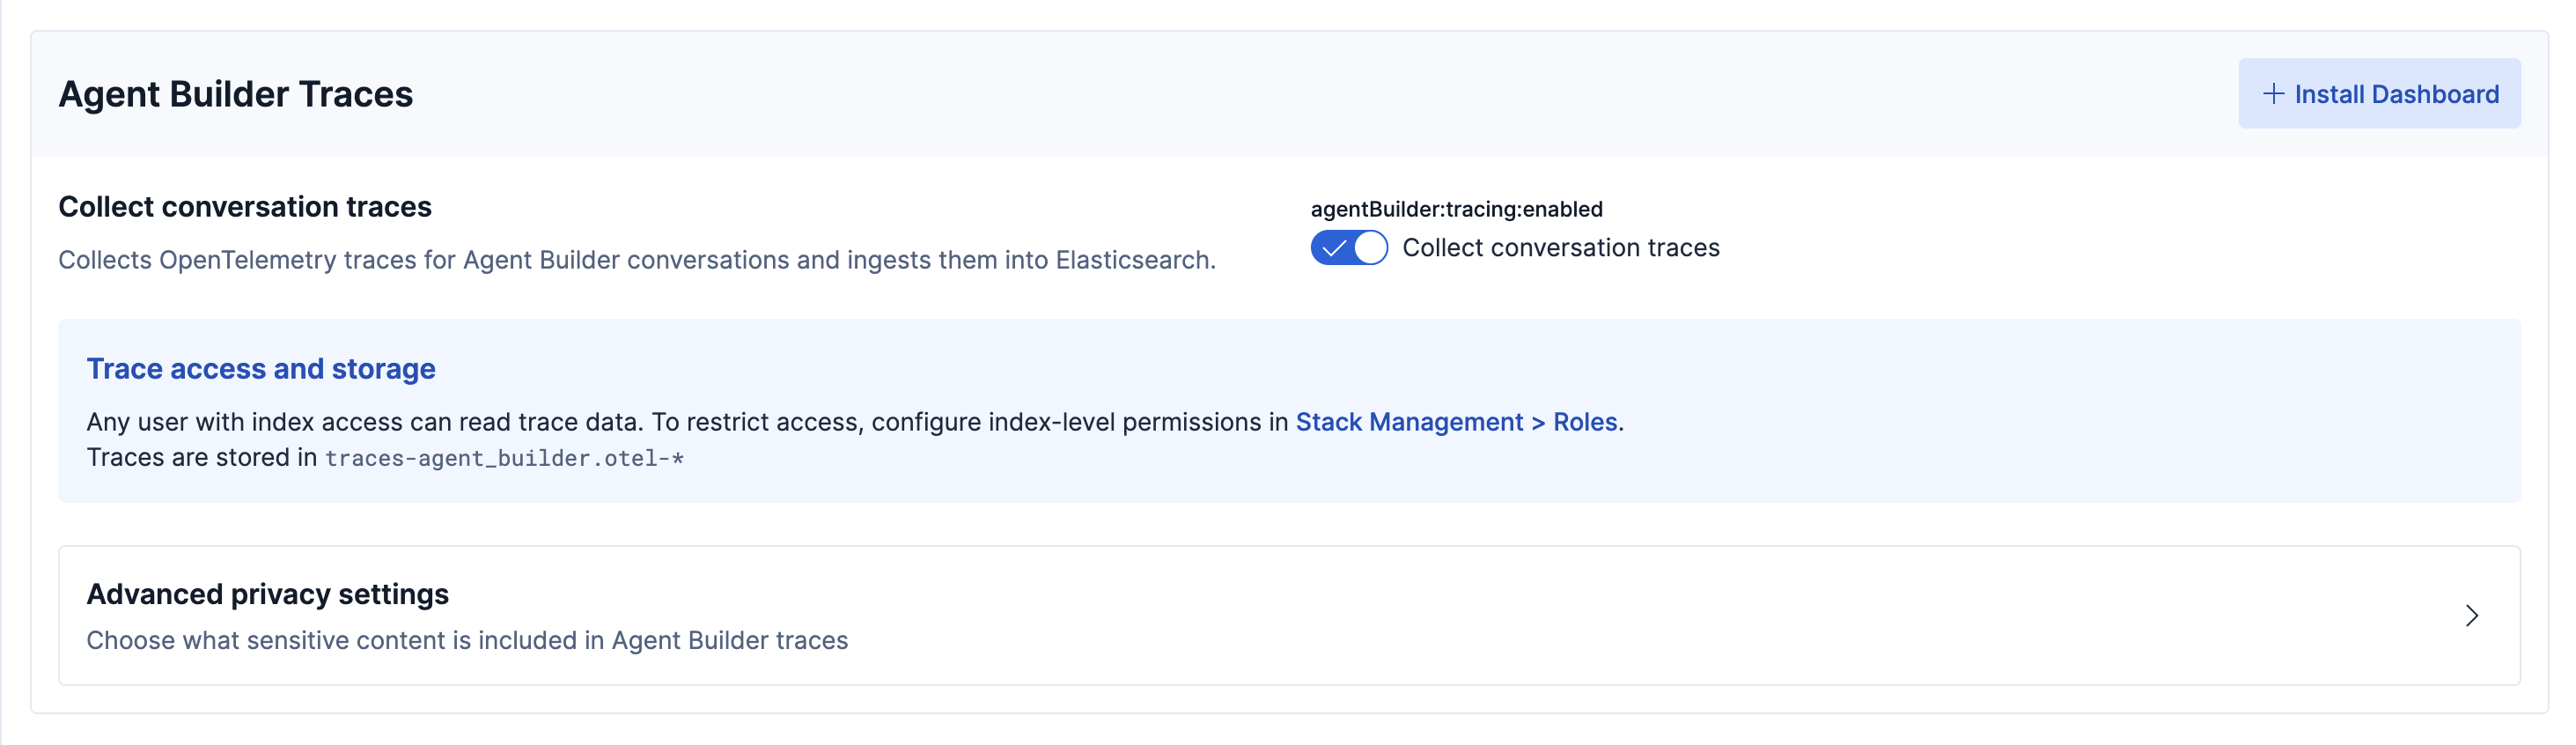
The Collect conversation traces setting turns collection on and off. When it is on, Elastic Agent Builder collects OpenTelemetry traces for agent conversations and ingests them into Elasticsearch. From the same section, you can install a prebuilt overview dashboard for the current Kibana space.
Any user with index access can read trace data. To restrict access, configure index-level privileges in Stack Management → Roles. For details, refer to Grant access to trace data.
By default, traces record structural metadata only, such as token counts, latency, and model names. Conversation content is not captured unless an administrator opts in.
To change what is captured, expand Advanced privacy settings in the Agent Builder Traces section. Each option is off by default.
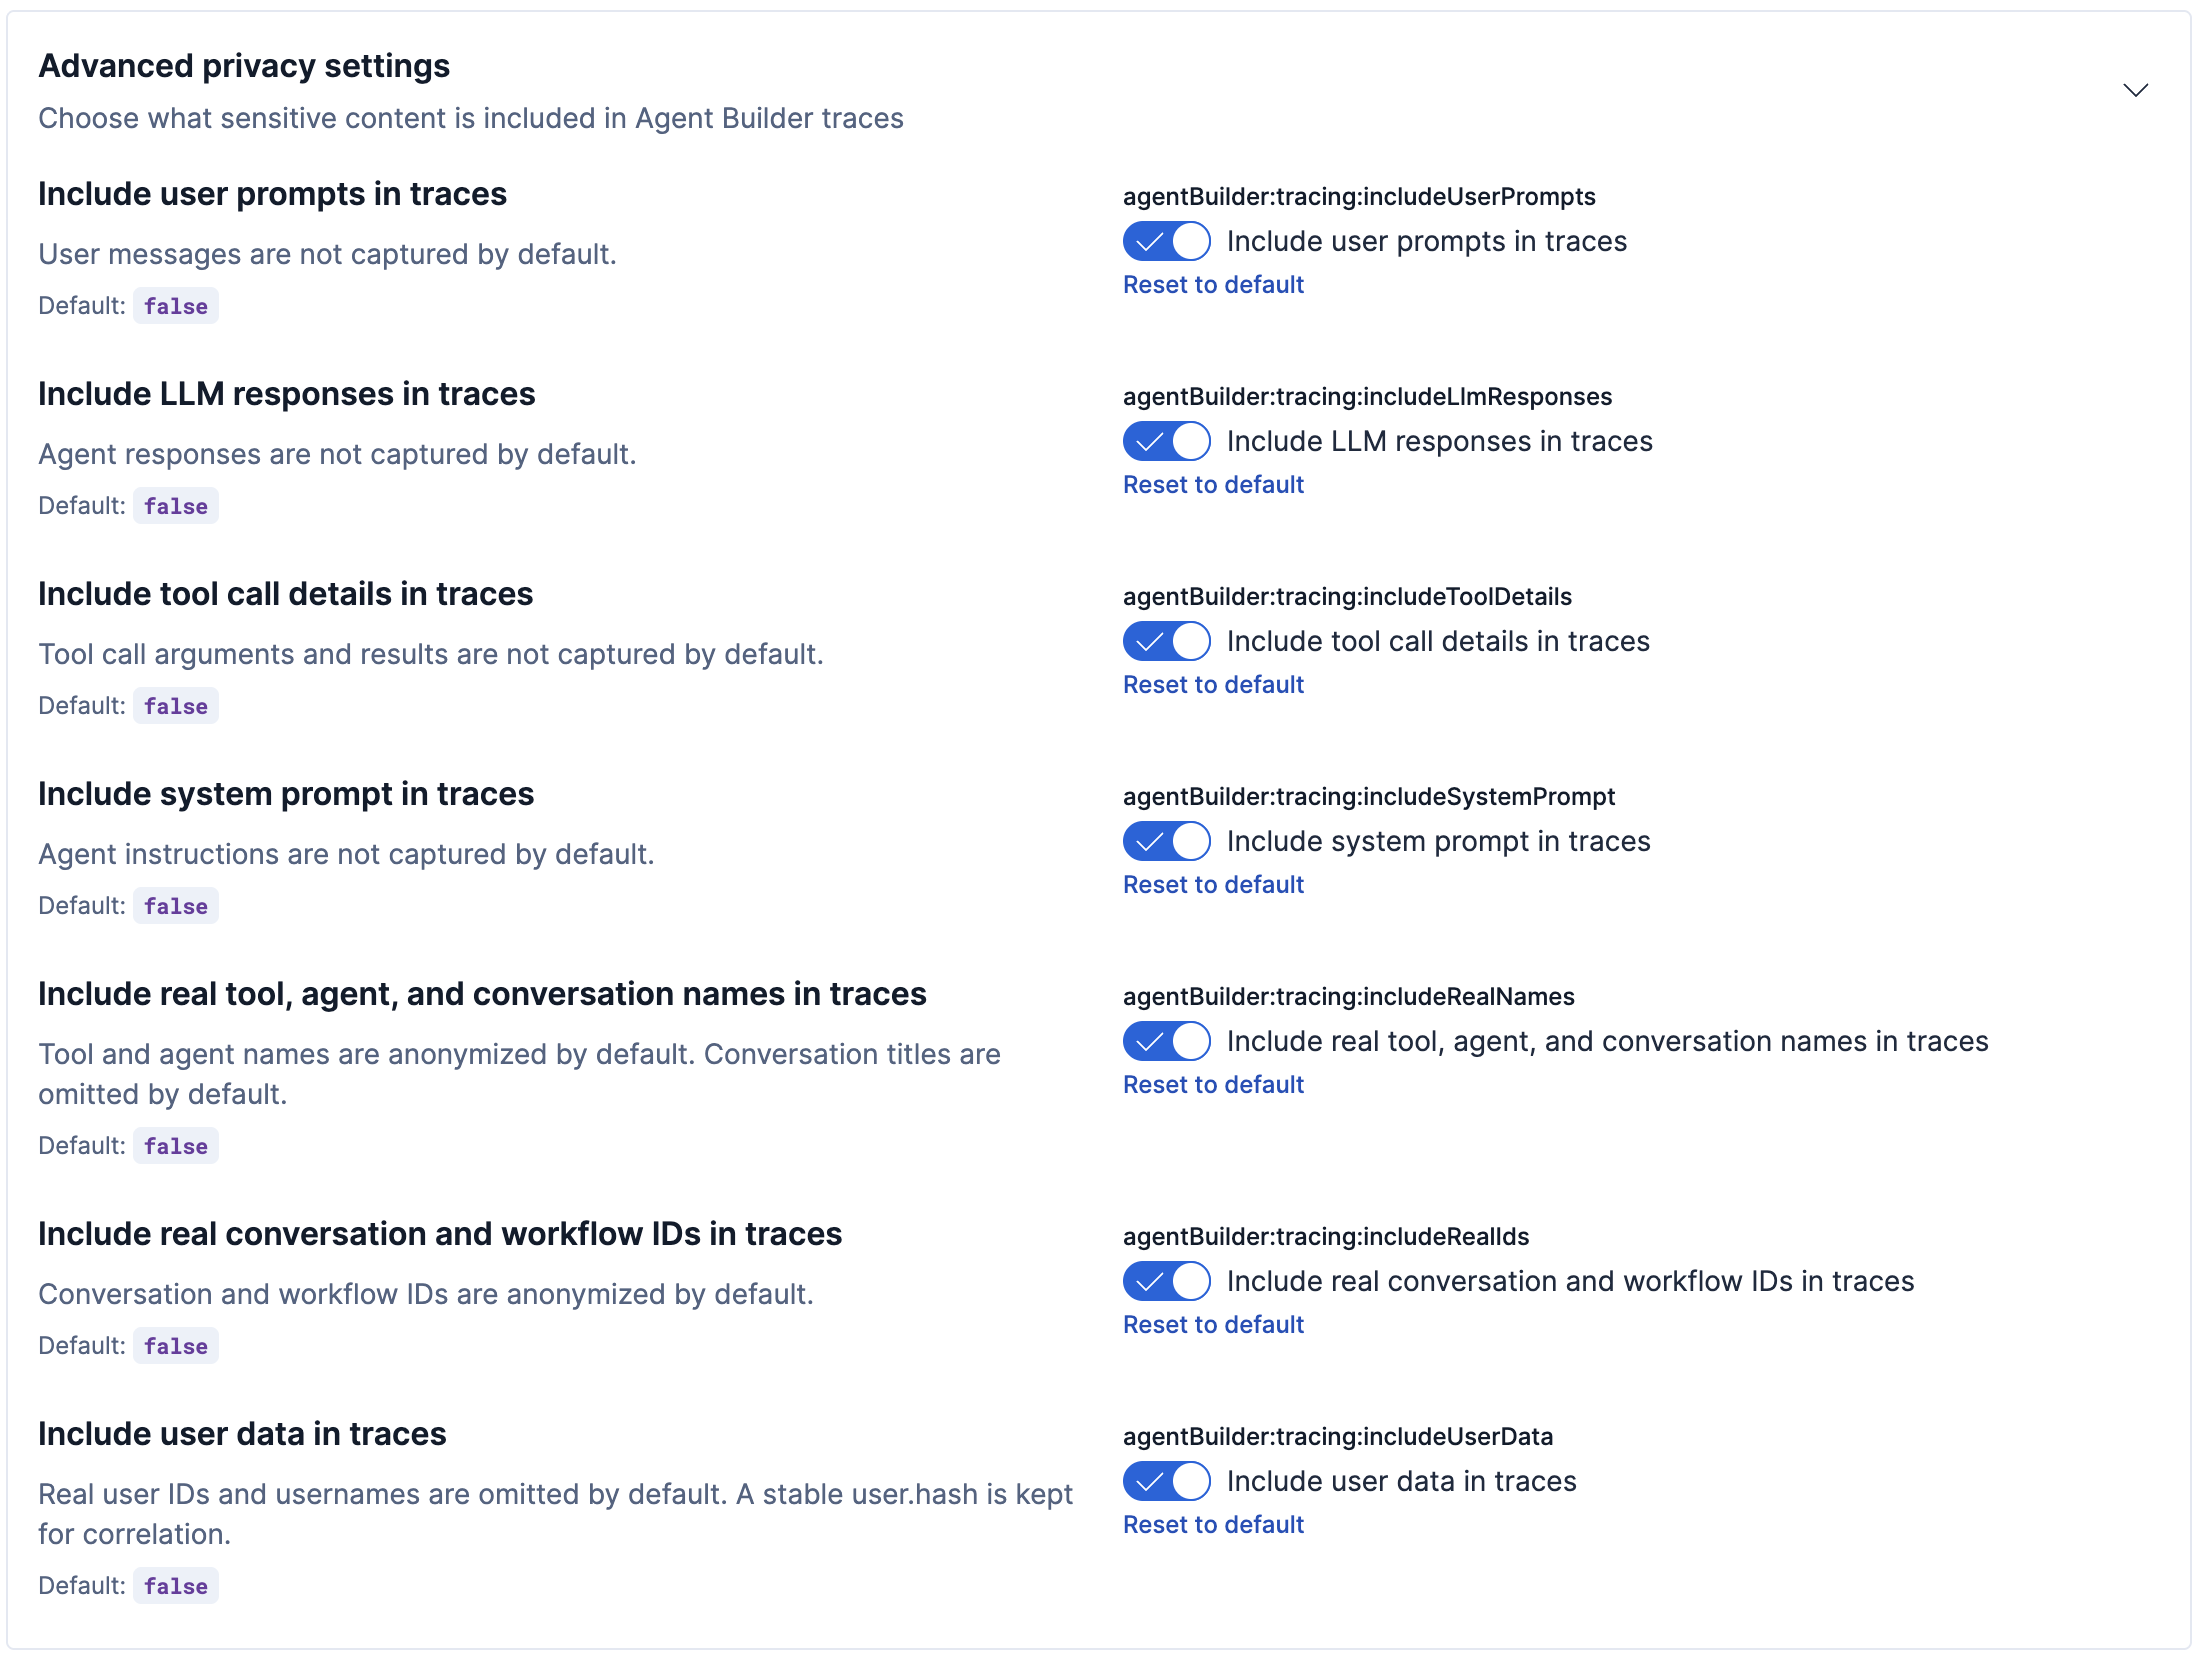
| Setting | Setting ID | Effect when enabled |
|---|---|---|
| Include user prompts in traces | agentBuilder:tracing:includeUserPrompts |
Captures user messages. |
| Include LLM responses in traces | agentBuilder:tracing:includeLlmResponses |
Captures agent responses. |
| Include tool call details in traces | agentBuilder:tracing:includeToolDetails |
Captures tool call arguments and results. |
| Include system prompt in traces | agentBuilder:tracing:includeSystemPrompt |
Captures agent instructions. |
| Include real tool, agent, and conversation names in traces
Include real tool and agent names in traces |
agentBuilder:tracing:includeRealNames |
Records real tool, agent, and workflow names instead of anonymized values, and keeps the full tool definitions and descriptions. |
| Include real conversation and workflow IDs in traces | agentBuilder:tracing:includeRealIds |
Records real conversation and workflow IDs instead of anonymized values. Also controls the agent ID and the workflow execution ID, which the setting name does not mention. |
| Include user data in traces
|
agentBuilder:tracing:includeUserData |
Records the real user ID and username of the person who ran the agent, instead of a hash alone. |
Built-in tools and agents always appear under their real names. Anonymized names are replaced with the literal value custom, so every custom tool, agent, and workflow shares one value and you cannot tell them apart by name. Anonymized IDs are different: they are replaced with a stable hash, so you can still group and correlate traces by conversation or agent ID. A real conversation ID is a UUID, and an anonymized one is a 16-character hash, so you can tell at a glance which you are looking at. An anonymized custom agent ID keeps a custom- prefix, as in custom-10a91bfdfac987f2.
User data is the exception to that pattern. Every other setting anonymizes a value in place, keeping the same field. The user fields swap instead. When Include user data in traces is off, the username is dropped and the user ID is replaced by a stable hash in attributes.user.hash. When the setting is on, attributes.user.id and attributes.user.name are recorded and attributes.user.hash is absent. Account for that if you build dashboards that group by user.
On Elastic Cloud Hosted and Elastic Cloud Serverless, the username recorded for a user who signs in with Elastic Cloud SSO is a numeric Elastic Cloud user ID rather than a readable name. For the field details and how to resolve a display name, refer to User attributes.
Changing a privacy setting affects only traces recorded after the change. Existing traces are not rewritten. Elastic Agent Builder refreshes these settings every 30 seconds, so allow up to that long for a change to take effect, then run a new conversation round to see it.
Content is stored across different span types:
chatspans: Store prompts, responses, and the system prompt in theattributes.gen_ai.input.messages,attributes.gen_ai.output.messages, andattributes.gen_ai.system_instructionsattributes.execute_toolspans: Store tool call details inattributes.gen_ai.tool.call.argumentsandattributes.gen_ai.tool.call.result.- The conversation round span
: Stores the conversation title and the user identity. Only the root invoke_agentspan carries these, one per conversation round. The nested agent, model, and tool spans do not. For the field names, the settings each one depends on, and how to select that span, refer to User attributes.
Two limits apply to the conversation title:
- It is recorded only for runs that create or continue a saved conversation. Chats always save, and so do runs through the conversation APIs. The
ai.agentworkflow step is the exception: unless it creates a conversation or continues an existing one, nothing is saved and the run has no title attribute. - Renaming a conversation does not update titles already recorded. Rounds recorded before the rename keep the old title, and the new one appears from the next round onward. A conversation's rounds share the same
attributes.gen_ai.conversation.id, so to find the current title, take the title from its most recent round.
Anonymization also rewrites the span name, not only the attributes. A custom agent's round appears as invoke_agent custom rather than invoke_agent <your agent name>, and a custom tool call appears as execute_tool custom. Filters that match on a real name in span.name return nothing while the names are anonymized.
Anyone who can read the trace data stream can read this content, so review Grant access to trace data before you turn these settings on. For the field-level details, refer to Message content attributes.
Trace data is stored in the traces-agent_builder.otel-* data stream. To read it, a role needs read and view_index_metadata on that pattern.
Access is granted at the index level. Any user who can read these data streams can read all collected traces, so trace access is not scoped per user. To control who can read traces, configure index privileges through roles in Stack Management → Roles.
For the full privilege model, including Kibana feature and cluster privileges, refer to Permissions and access control.
When trace collection is on, Elastic Agent Builder provides a prebuilt overview dashboard for agent activity and token usage. You install or reinstall it per space from the Agent Builder Traces settings section. For what each panel shows and the full span and attribute reference, refer to Agent Builder traces overview dashboard.
Because traces are stored in regular data streams, you can also build your own visualizations with Dashboards and Lens, or query the data with ES|QL. To explore traces in natural language, use the built-in traces skill.