Indexing Tier view in AutoOps for Serverless
The Indexing Tier view in AutoOps for Serverless provides visibility into your indexing activities and performance. This view helps you understand how indexing rate and latency change over time, with both high-level project summaries and detailed index-level and data stream-level breakdowns.
To get to the Indexing Tier view, access AutoOps in your project and then select Indexing Tier from the navigation menu.
The top half of the Indexing Tier page offers general insights at the project level.
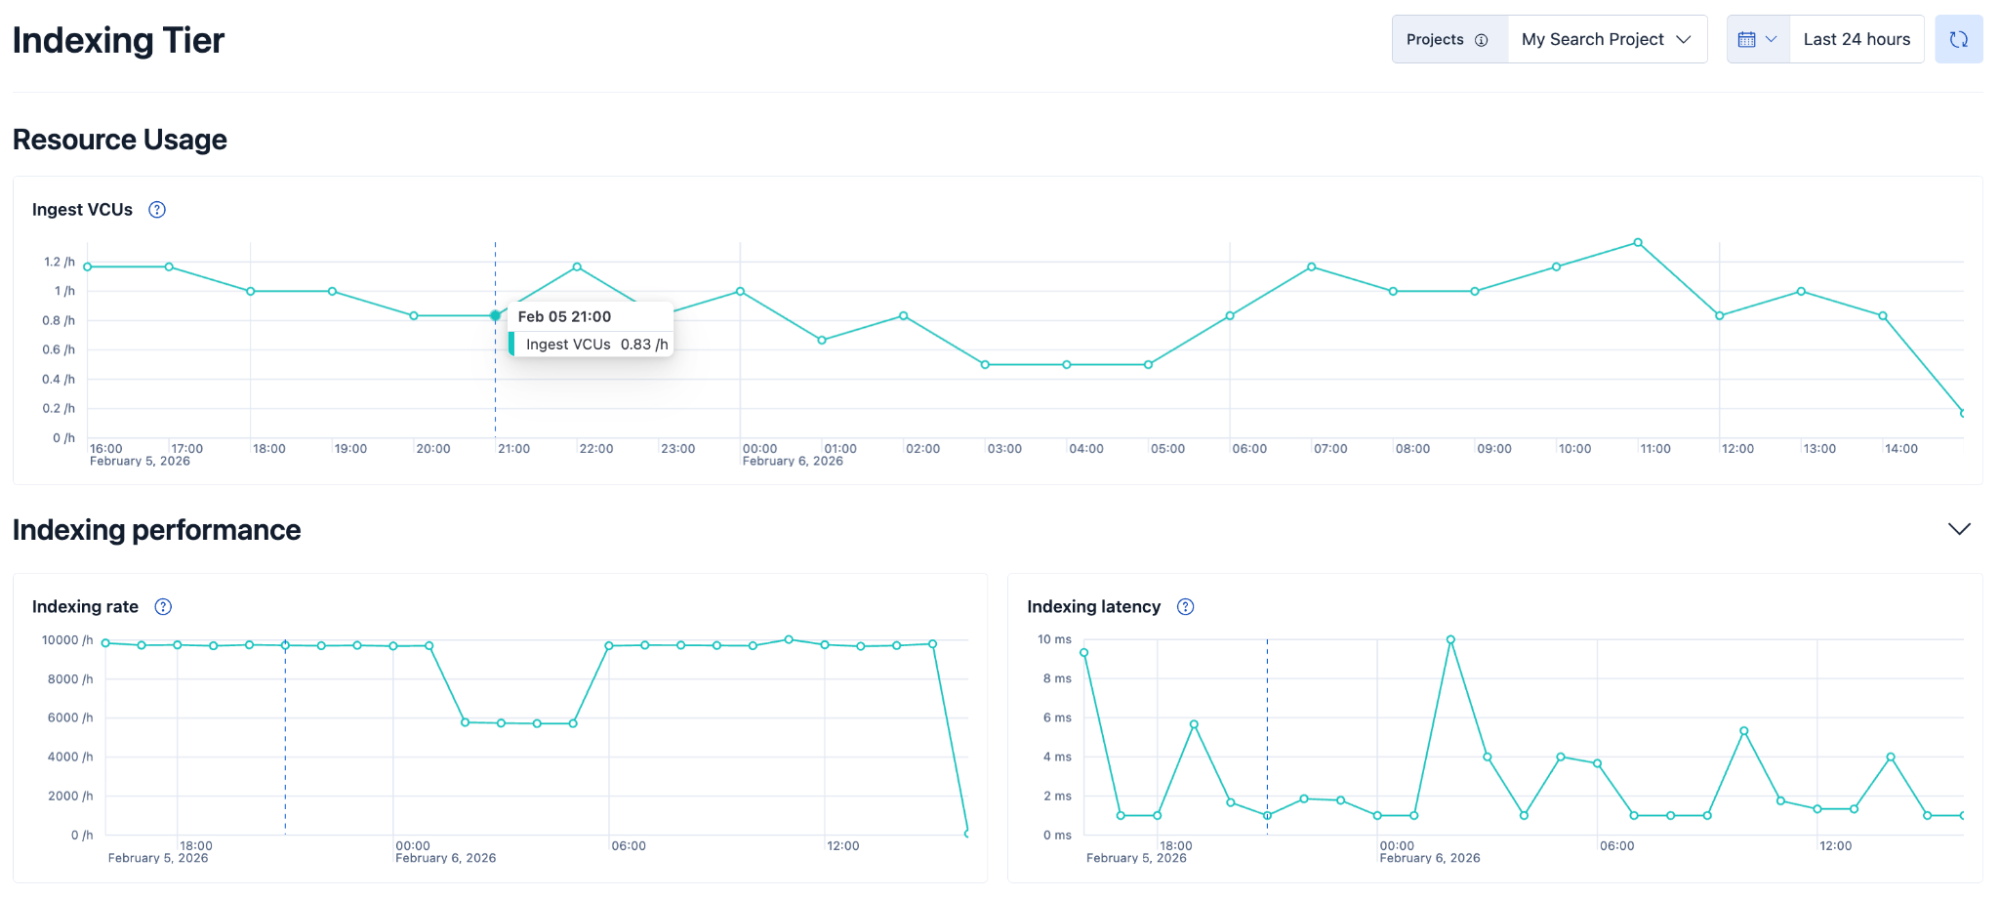
- Use the built-in project picker to switch between projects. This allows you to make quick context changes without needing to navigate back to your Elastic Cloud home page to select a different project.
- Select custom time windows to explore usage and performance data up to the last 10 days. For time periods up to 72 hours, the data on the chart is displayed per hour. For time periods greater than 72 hours, the data is displayed per day.
- Gain insights from performance charts depicting indexing rate and latency trends over time.
-
Explore the Ingest VCUs chart to see how ingest VCU usage compares to indexing rate and latency.
The bottom half of the Indexing Tier page offers a more granular breakdown of index-level and data stream-level insights into indexing performance.
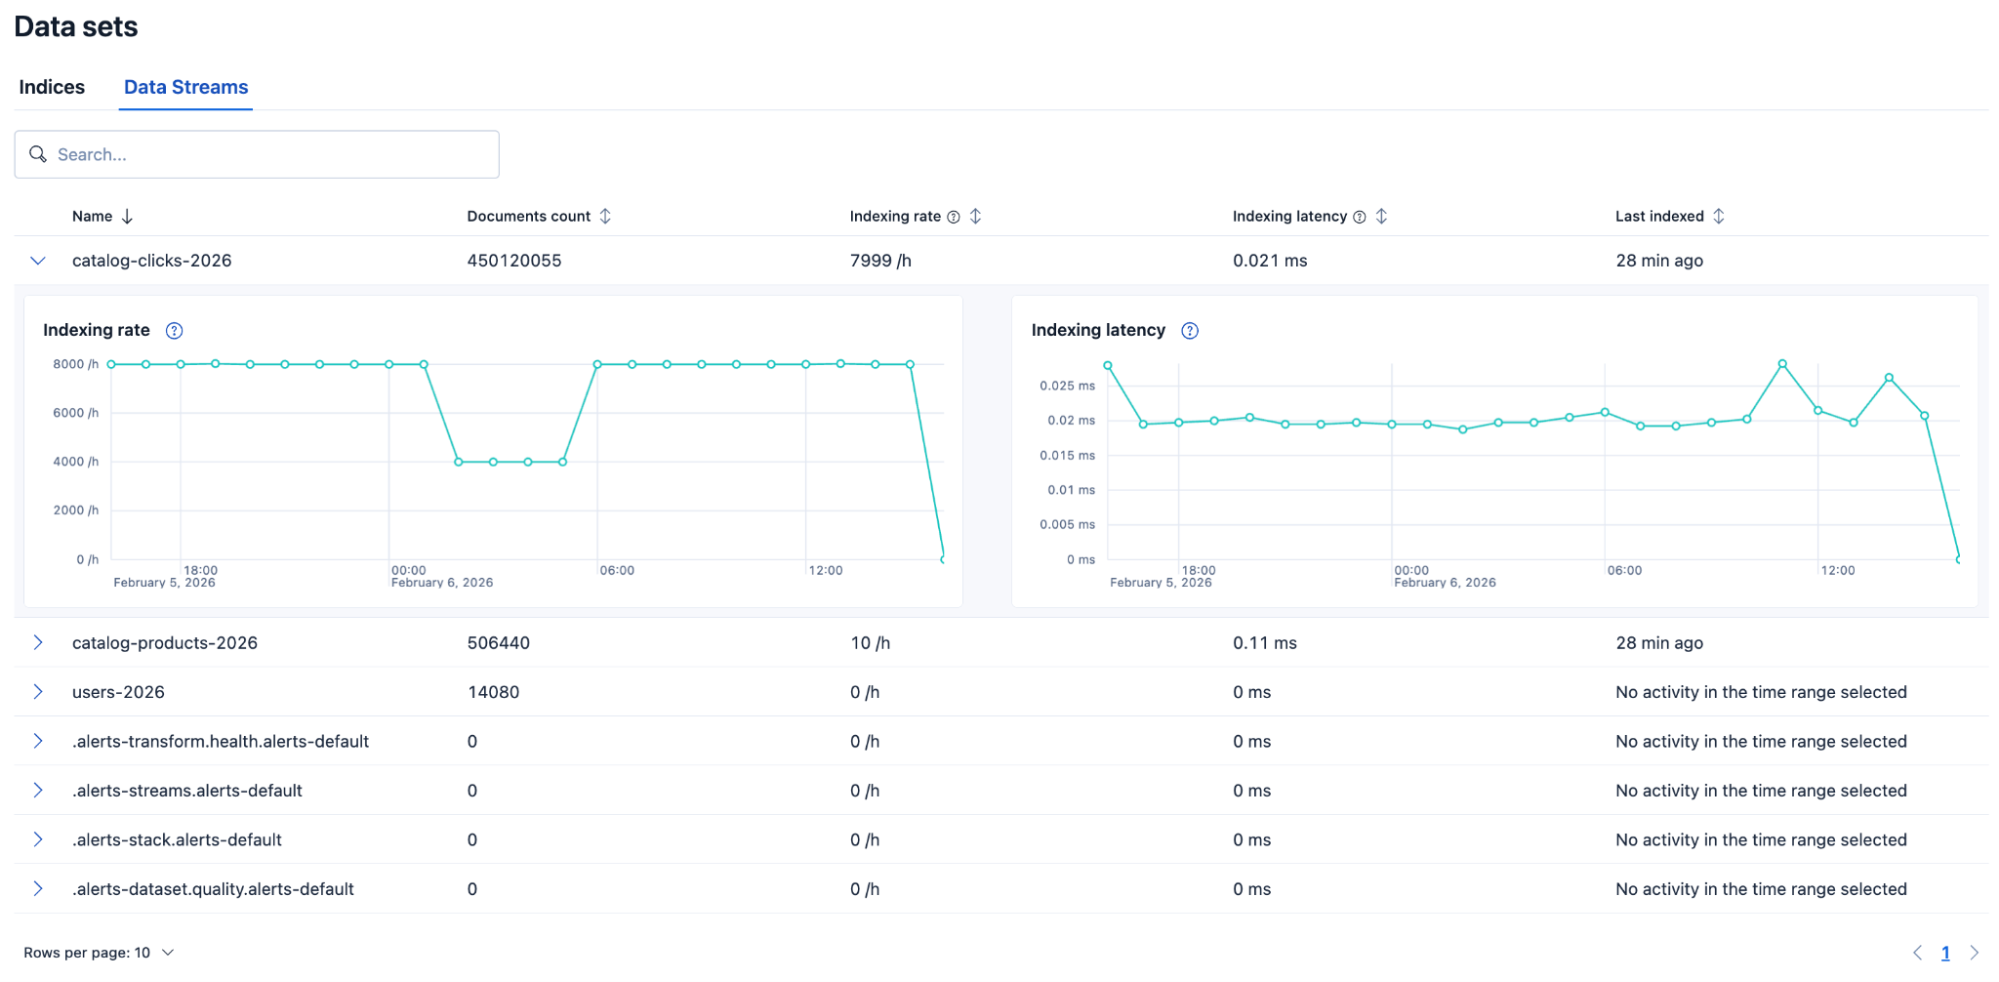
A table lists all of your indices and data streams, with each row providing the following information:
- The number of documents in the index or data stream.
- The latest indexing rate in the selected time period.
- The latest indexing latency in the selected time period.
- The timestamp of the last indexing operation on the index or data stream.
Using this table, you can detect which of your indices or data streams is currently being ingested and at what rate and latency. This helps you identify which indices have a high ingestion load, so that you can deduce where that load is coming from and manage it accordingly.
For historical analysis, you can also expand each row to reveal performance trends over time. These help you detect patterns or anomalies in indexing performance for each index and data stream individually.
This table is interactive and can be:
- filtered by index or data stream name.
- sorted by index or data stream name, documents count, indexing rate, indexing latency, or last indexing time.
- paginated to handle large sets of indices or data streams.
The Indexing Tier view shows how your project's indexing rate and latency change over time. This section explains what might cause those changes so you can manage your indexing workload.
A higher indexing rate leads to a larger ingestion load. A lower indexing rate reduces that load.
The indexing rate on your project can increase for many different reasons, such as when more clients start issuing indexing requests at the same time, or when you have transforms scheduled to run too frequently.
When that happens, the indexing tier tries to respond to all requests as quickly as possible, but might not be able to serve them all with the currently allocated resources. As a result, indexing requests start backing up in the queue and indexing latency starts rising.
Indexing latency can increase even when the indexing rate stays steady, for example when computationally heavy indexing requests run for several minutes and prevent the tier from serving newer requests.
A number of things could cause this:
- You might have a lot of small indices (less than 1GB) that are creating computational overhead
- Indexed documents might need to be processed by resource-intensive ingest pipelines, such as pipelines with complex grok patterns or inference requirements
- Transforms might be running on large amounts of data
- Index mappings might be inefficient or they might be defining too many fields, causing higher memory consumption
As a result, the indexing tier slowly becomes saturated and the new indexing requests get queued up waiting for the long-running ones to complete.
We plan to display long-running indexing requests in the Indexing Tier view so that you can learn which requests are causing increased indexing latency and improve their performance.