Add drilldowns
A drilldown is a navigation action on a dashboard panel. When you select a value, it opens a destination you define: another dashboard, a URL, or Discover.
The destination keeps the context of that selection. That includes the value you selected, the filters on the dashboard, and the time range.
Selecting a value can also filter the dashboard you have open, for example when you select a slice or drag a time range. Add a drilldown when you want that same selection to open another view.
To add drilldowns to dashboard panels, you need:
- All privilege for the Dashboard feature in Kibana
- An existing dashboard with at least one panel that supports drilldowns
- For dashboard drilldowns: A target dashboard to navigate to
- For URL drilldowns: A URL template. Variables can come from the dashboard and from the value you select
A drilldown uses a value from a field in the data source. You cannot filter on a value created at query time, because that value has no field in the index. This includes a Lens formula, an aggregation result, and an ES|QL EVAL or STATS result.
When the value comes from an ES|QL query:
-
The visualization explains that the value relies on a field created at query time, and you cannot use Filter for or Filter out. On a chart, a date value does not show those actions or the explanation. If the column only renames an index field, you can still filter and open a drilldown. Add drilldowns to an ES|QL visualization describes where the explanation appears. -
The drilldown option is not available.
For more information about filter pills, refer to Add pills by interacting with visualizations.
You can add three types of drilldown:
- Dashboard: Open another dashboard from a panel. For example, open a host dashboard from a summary dashboard, with a filter for the host name you selected.
- URL: Open a website from a panel. For example, open a search page that includes the host name you selected.
- Discover: Open Discover from a Lens panel. For example, open the documents for one slice of a pie chart.
A dashboard drilldown opens another dashboard and can carry the time range, filters, and query with it. Use one to continue from a summary into a more specific view.
For example, a dashboard can show logs and metrics for several data centers. A drilldown can open a dashboard for the one data center or server you select.
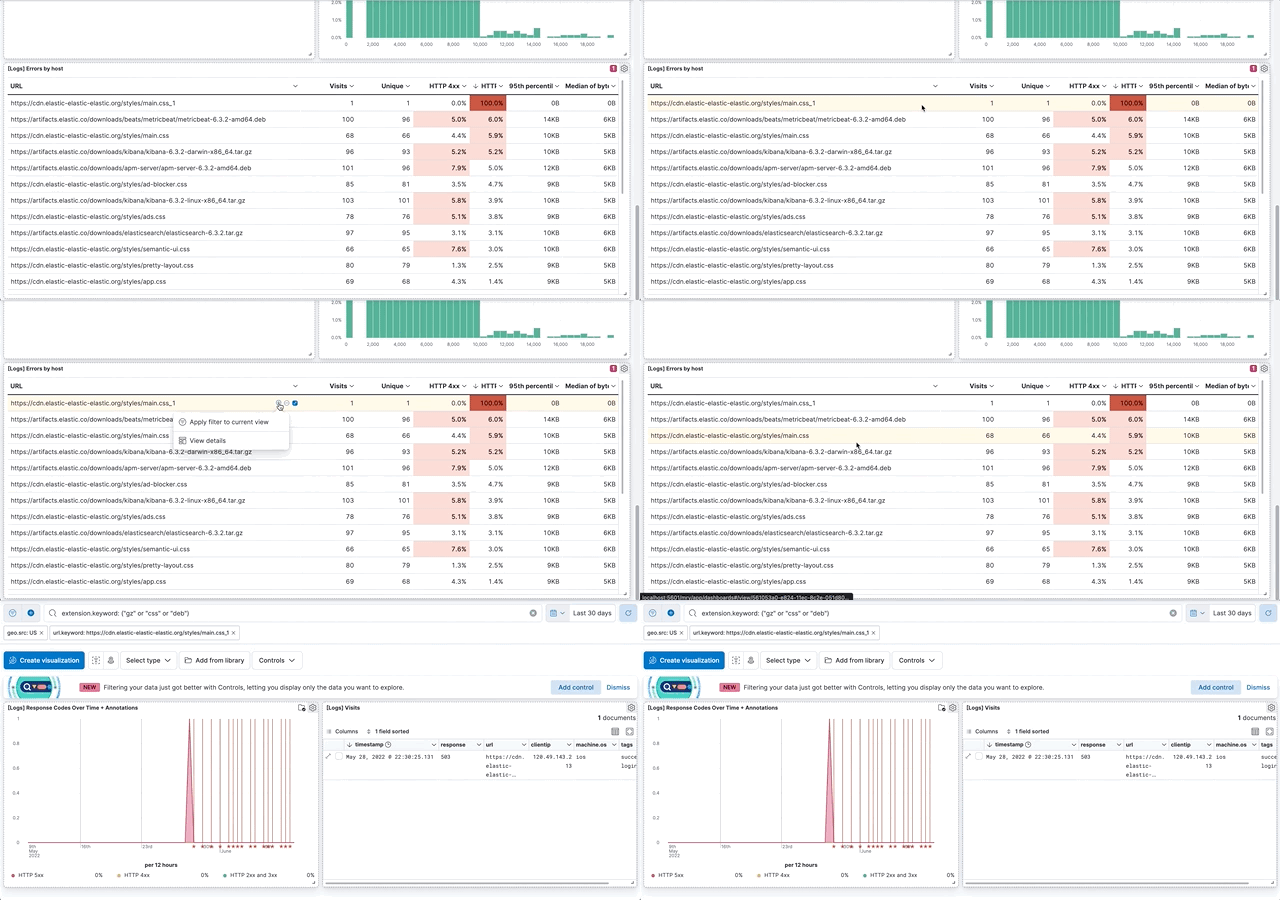
The following panel types support dashboard drilldowns:
- Lens visualizations that use a data view
-
Lens visualizations built with ES|QL - Maps
- TSVB
- Vega
- Aggregation-based area chart, data table, heat map, horizontal bar chart, line chart, pie chart, tag cloud, and vertical bar chart
- Timelion
Use the Sample web logs data to create a dashboard and add panels, then set a search and filter on the [Logs] Web Traffic dashboard.
Add the Sample web logs data.
Create a new dashboard.
-
In the application menu, select Add → From library. -
In the application menu, select Add from library.
-
Add the [Logs] Visits panel.
Set the time filter to Last 30 days.
Save the dashboard. In the Title field, enter
Detailed logs.Open the [Logs] Web Traffic dashboard, then set a search and filter.
Search:
extension.keyword: ("gz" or "css" or "deb")
Filter:geo.src: US
Create a drilldown that opens the Detailed logs dashboard from the [Logs] Web Traffic dashboard.
Open the panel menu for the [Logs] Errors by host data table, then select Create drilldown.
Select Go to dashboard.
- In Name, enter a name. For example,
View details. - From Choose destination dashboard, select Detailed logs.
- To keep the
geo.srcfilter, the KQL query, and the time filter, select Use filters and query from origin dashboard and Use date range from origin dashboard. - Select Create drilldown.
- In Name, enter a name. For example,
Save the dashboard.
In the data table panel, select + on a value, then select View details.
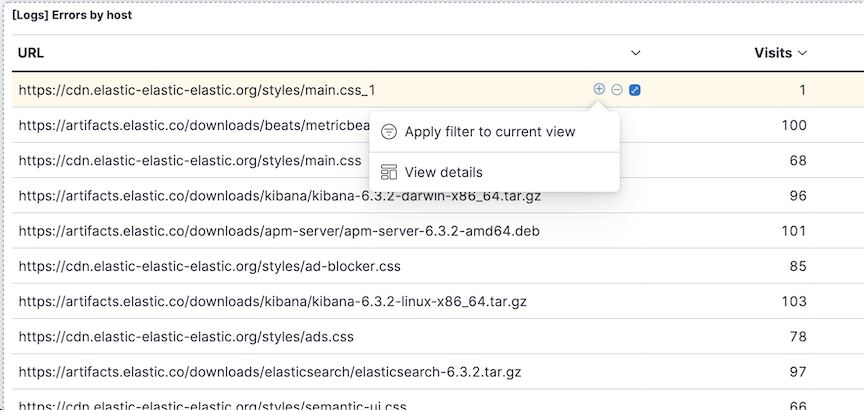
The Detailed logs dashboard opens with the geo.src filter, the KQL query, and the Last 30 days time range.
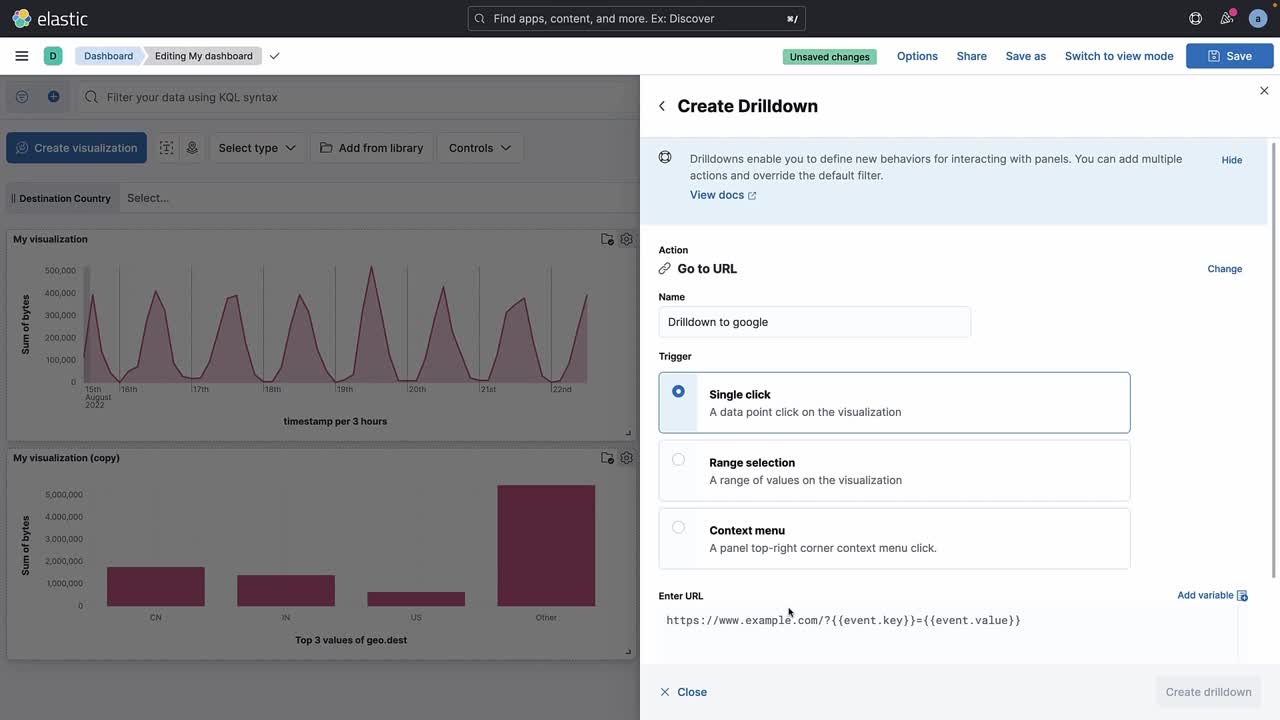
A URL drilldown opens a website from a panel. The URL can change with the dashboard time range, the dashboard filters, and the value you select. You build that URL with variables in a URL template.
Some panels support more than one interaction. Under Trigger, select when the drilldown runs. The variables you can use depend on that choice. URL drilldowns support these triggers:
- Single click: One data point in the panel. The template can use
{{event.value}}and{{event.key}}. - Table row click: One row in a table. The template can use
{{event.values.[x]}}, wherexis the column number, starting at 0. - Range selection: A range of values in the panel. The template can use
{{event.from}}and{{event.to}}.
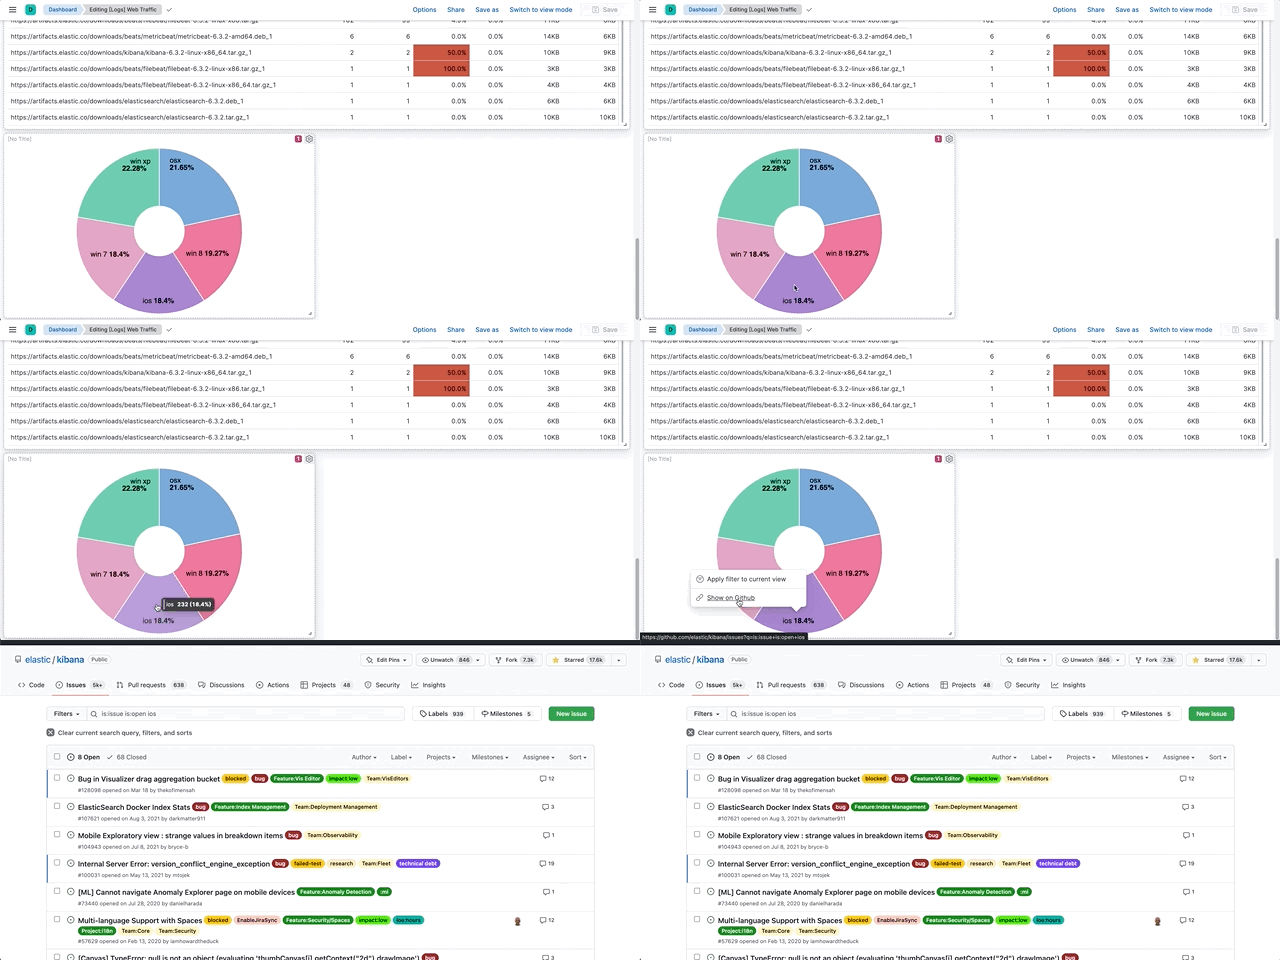
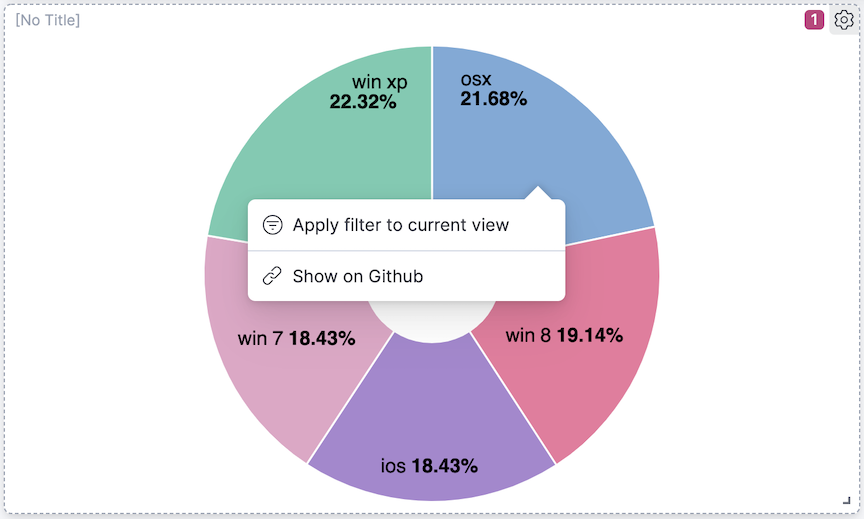
If a pie chart breaks down values from a GitHub repository, a URL drilldown can open the matching GitHub search from the slice you select.
Add the Sample web logs data.
Open the [Logs] Web Traffic dashboard.
Select Edit.
Add a pie chart.
-
In the application menu, select Add → Visualization. -
In the application menu, select Create visualization.
-
Set the visualization type to Pie.
From Available fields, drag machine.os.keyword to the workspace.
Select Save and return.
Open the pie chart panel menu, then select Create drilldown.
Select Go to URL.
In Name, enter a name. For example,
Show on GitHub.For Trigger, select Single click.
To open Kibana issues on GitHub, enter this URL in Enter URL:
https://github.com/elastic/kibana/issues?q=is:issue+is:open+{{event.value}}Kibana replaces
{{event.value}}with the pie slice you select.Select Create drilldown.
Save the dashboard.
On the pie chart panel, select a slice, then select Show on GitHub.
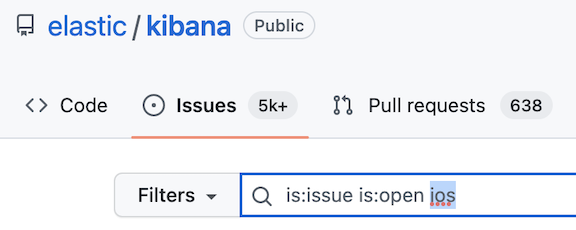
In the list of Kibana repository issues, confirm that the slice value appears in the search.
Use variables to pass the dashboard time range, the dashboard filters, or a table cell in the URL. Select Add variable to insert a variable for the panel and the trigger you selected. Save the dashboard, then select a value on the panel and confirm the URL before you share the drilldown.
Time range. context.panel.timeRange.from and context.panel.timeRange.to are the panel time range when the panel has its own time range. Otherwise they are the dashboard time range. Format them with the date helper when the site expects a calendar date:
https://example.com/search?from={{date context.panel.timeRange.from "YYYY-MM-DD"}}&to={{date context.panel.timeRange.to "YYYY-MM-DD"}}
Dashboard filters and query. context.panel.filters is the list of filters on the dashboard. Filters that exist only on the panel are not included. context.panel.query.query is the dashboard query, and context.panel.query.language is the language of that query. Use the rison helper when the destination stores Kibana state in the URL:
{{rison context.panel.filters}}
Start internal links with {{kibanaUrl}}, which is the Kibana base URL.
Table row. For a Table row click trigger, event.values.[0] is the first cell in the row. event.keys.[0] is the field name for that column, and event.columnNames.[0] is the column label. This URL puts the first cell in the path:
https://example.com/host/{{event.values.[0]}}
The variables reference lists every variable, including event.points for a Single click that returns more than one data point.
A Discover drilldown opens Discover from a Lens panel and can carry the time range, filters, and query with it. Use one to read the documents behind a chart value.
For example, a Discover drilldown on a pie chart can open only the documents for the slice you select.
The following panel types support Discover drilldowns:
Lens visualizations that use a data view
Lens visualizations built with ES|QL On ES|QL panels, dashboard filters and the dashboard KQL or Lucene query are translated into a
WHEREclause in the panel's ES|QL query, so the same context applies in Discover. Filters that can't be expressed in ES|QL are dropped. The Explore in Discover panel action applies the same translation.
You can open Lens dashboard panel data in Discover without setting up a drilldown.
Create a drilldown that opens Discover from the Sample web logs data [Logs] Web Traffic dashboard.
Select Edit, open the panel menu for the [Logs] Bytes distribution bar vertical stacked chart, then select Create drilldown.
Select Open in Discover.
In Name, enter a name. For example,
View bytes distribution in Discover.To open Discover in a new tab, select Open in new tab.
Select Create drilldown.
Save the dashboard.
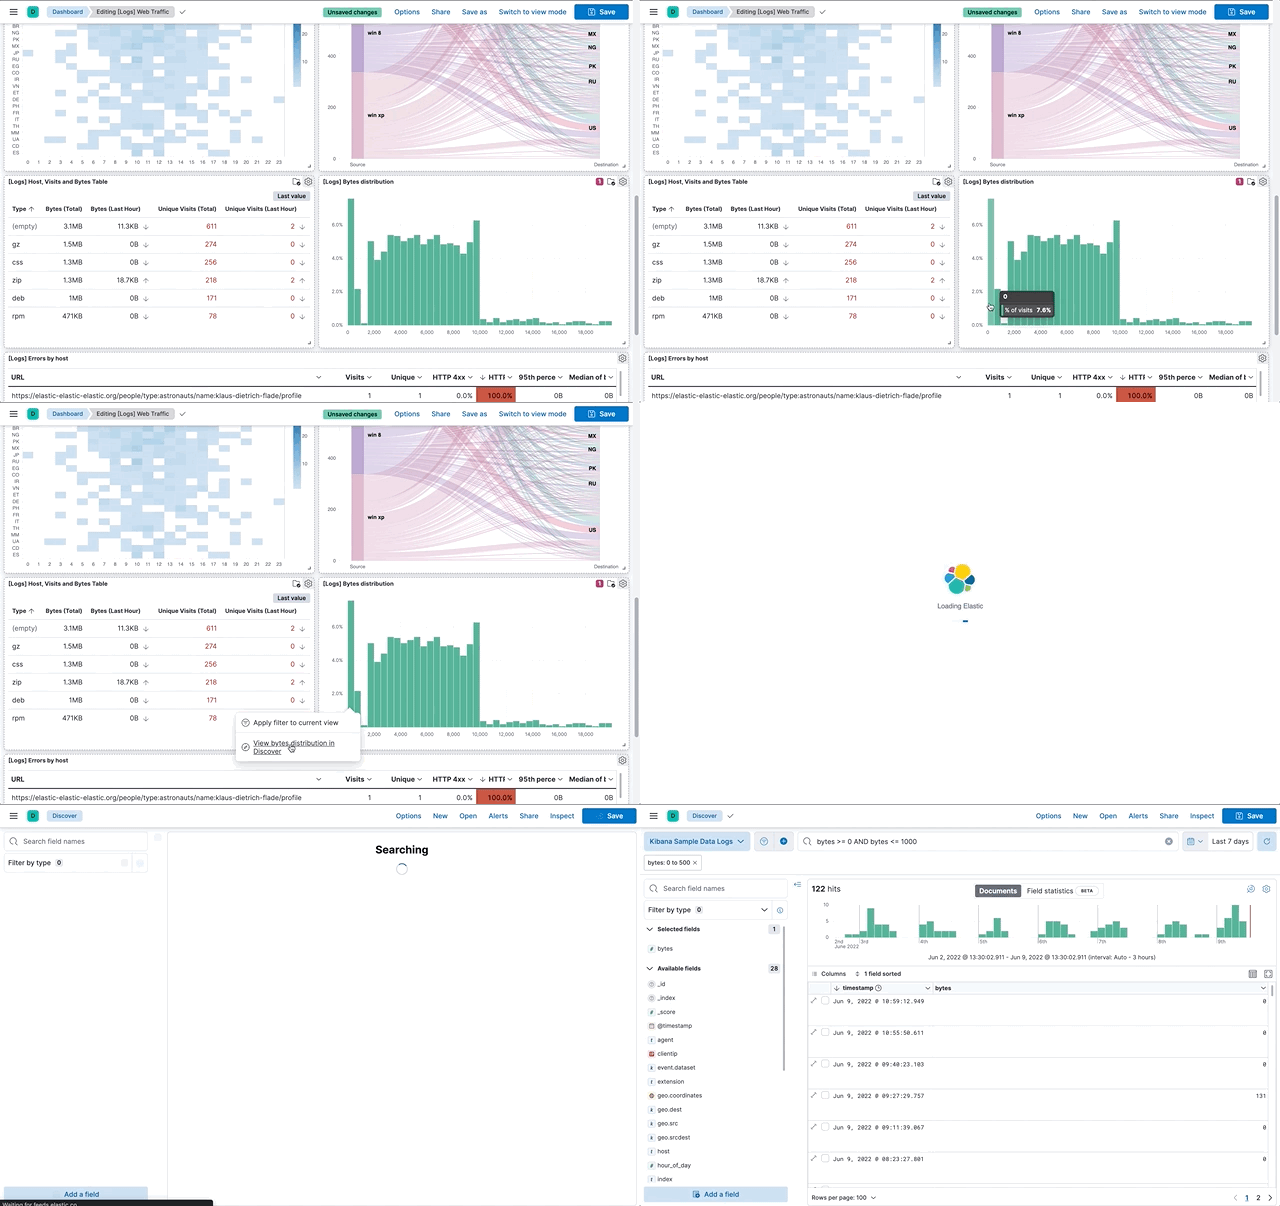
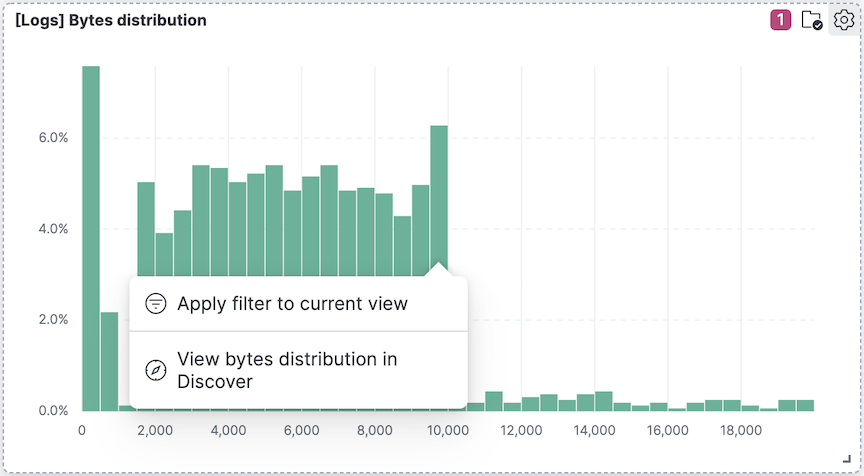
On the [Logs] Bytes distribution bar vertical stacked chart, select a bar, then select View bytes distribution in Discover.
Discover opens in a new tab and shows the documents for the bar you selected.
You can edit a drilldown, copy it to another panel, or delete it.
Open the panel menu that includes the drilldown, then select Manage drilldowns.
On the Manage tab, use the following options:
- To change a drilldown, select Edit, make your changes, then select Save.
- To copy a drilldown, select Copy, enter the drilldown name, then select Create drilldown.
- To delete a drilldown, select it, then select Delete ({count}).
The URL template input uses Handlebars, a templating language. A template looks like regular text with Handlebars expressions embedded in it.
https://github.com/elastic/kibana/issues?q={{event.value}}
A Handlebars expression starts with {{, contains a value or helper, and ends with }}. When you run the drilldown, Kibana replaces each expression with a value from the dashboard and from the interaction.
In addition to built-in Handlebars helpers, you can use the custom helpers on this page.
Refer to the Handlebars documentation for advanced use cases.
json
Serialize variables in JSON format.
Example:
{{json event}}
{{json event.key event.value}}
{{json filters=context.panel.filters}}
rison
Serialize variables in rison format. Rison is a common format for Kibana apps for storing state in the URL.
Example:
{{rison event}}
{{rison event.key event.value}}
{{rison filters=context.panel.filters}}
date
Format dates. Supports relative date expressions (for example, now-15d). Refer to the moment docs for formatting options.
Example:
{{date event.from "YYYY MM DD"}}
{{date "now-15"}}
formatNumber
Format numbers. Numbers can be formatted to look like currency, percentages, times or numbers with decimal places, thousands, and abbreviations. Refer to numeral.js for formatting options.
Example:
{{formatNumber event.value "0.0"}}
lowercase
Convert a string to lower case.
Example:
{{lowercase event.value}}
uppercase
Convert a string to upper case.
Example:
{{uppercase event.value}}
trim
Remove leading and trailing spaces from a string.
Example:
{{trim event.value}}
trimLeft
Remove leading spaces from a string.
Example:
{{trimLeft event.value}}
trimRight
Remove trailing spaces from a string.
Example:
{{trimRight event.value}}
mid
Extract a substring from a string by start position and number of characters to extract.
Example:
{{mid event.value 3 5}} extracts five characters starting from the third character.
left
Extract a number of characters from a string, starting from the left.
Example:
{{left event.value 3}}
right
Extract a number of characters from a string, starting from the right.
Example:
{{right event.value 3}}
concat
Concatenate two or more strings.
Example:
{{concat event.value "," event.key}}
replace
Replace all substrings within a string.
Example:
{{replace event.value "stringToReplace" "stringToReplaceWith"}}
split
Split a string using a provided splitter.
Example:
{{split event.value ","}}
encodeURIComponent
Escape a string using the built-in encodeURIComponent function.
encodeURIQuery
Escape a string with the built-in encodeURIComponent function, but leave @, :, $, ,, and ; unchanged.
The URL drilldown template has three sources for variables:
- Global: Static variables that do not change with the panel or the interaction. For example,
{{kibanaUrl}}. - Context: Variables from the panel on the dashboard. For example,
{{context.panel.filters}}is the list of filters on the dashboard. - Event: Variables from the trigger. Kibana reads them from the interaction when you run the drilldown.
Save the dashboard and test the drilldown on the panel before you rely on it. To see every variable for the current panel and the selected trigger, select Add variable in the URL template field.
| Source | Variable | Description |
|---|---|---|
| Global | kibanaUrl | Kibana base URL. Use it to open another Kibana page. |
| Context | context.panel | Context from the current dashboard panel. |
| context.panel.id | ID of the panel. | |
| context.panel.title | Title of the panel. | |
| context.panel.filters | Filters on the dashboard. Filters that exist only on the panel are not included. Tip: Use the rison helper to pass these filters in a Kibana URL. |
|
| context.panel.query.query | Dashboard query string. | |
| context.panel.query.language | Language of the dashboard query. | |
| context.panel.timeRange.from context.panel.timeRange.to |
Panel time range when the panel has its own time range. Otherwise, the dashboard time range. Tip: Use the date helper to format the date. |
|
| context.panel.indexPatternId context.panel.indexPatternIds |
The data view IDs used by the panel. | |
| context.panel.savedObjectId | ID of the saved object behind the panel. | |
| Single click | event.value | Value of the selected data point. |
| event.key | Field name of the selected data point. | |
| event.negate | Boolean that indicates whether the selected data point resulted in a negative filter. | |
| event.points | Some visualizations return more than one data point for the value you select. Use the list when a single value is not enough. Example: {{json event.points}}{{event.points.[0].key}}{{event.points.[0].value}}{{#each event.points}}key=value&{{/each}}Note: {{event.value}} is a shorthand for {{event.points.[0].value}}{{event.key}} is a shorthand for {{event.points.[0].key}} |
|
| Table row click | event.rowIndex | Number of the selected row, starting from 0. |
| event.values | All cell values for the selected row. To access a column value, use {{event.values.[x]}}, where x is the column number. |
|
| event.keys | Field names for each column. | |
| event.columnNames | Column names. | |
| Range selection | event.from event.to |
Start and end of the selected range, as numbers. Tip: Use the date helper to format a date. |
| event.key | Aggregation field behind the selected range, if available. |