Visualize OpenTelemetry data
To ingest OpenTelemetry data, refer to Quickstart: Send OTLP data to Elastic Serverless or Elastic Cloud Hosted.
Discover allows you to quickly search and filter your data, get information about the structure of the fields in your data, and display your findings in a visualization. Find Discover in your Elastic Observability Serverless project's UI under Analyze --> Discover.
Attributes and resource attributes are prefixed with attributes.* and resource.attributes.*.
You can correlate all signals with a single resource.attributes.*.
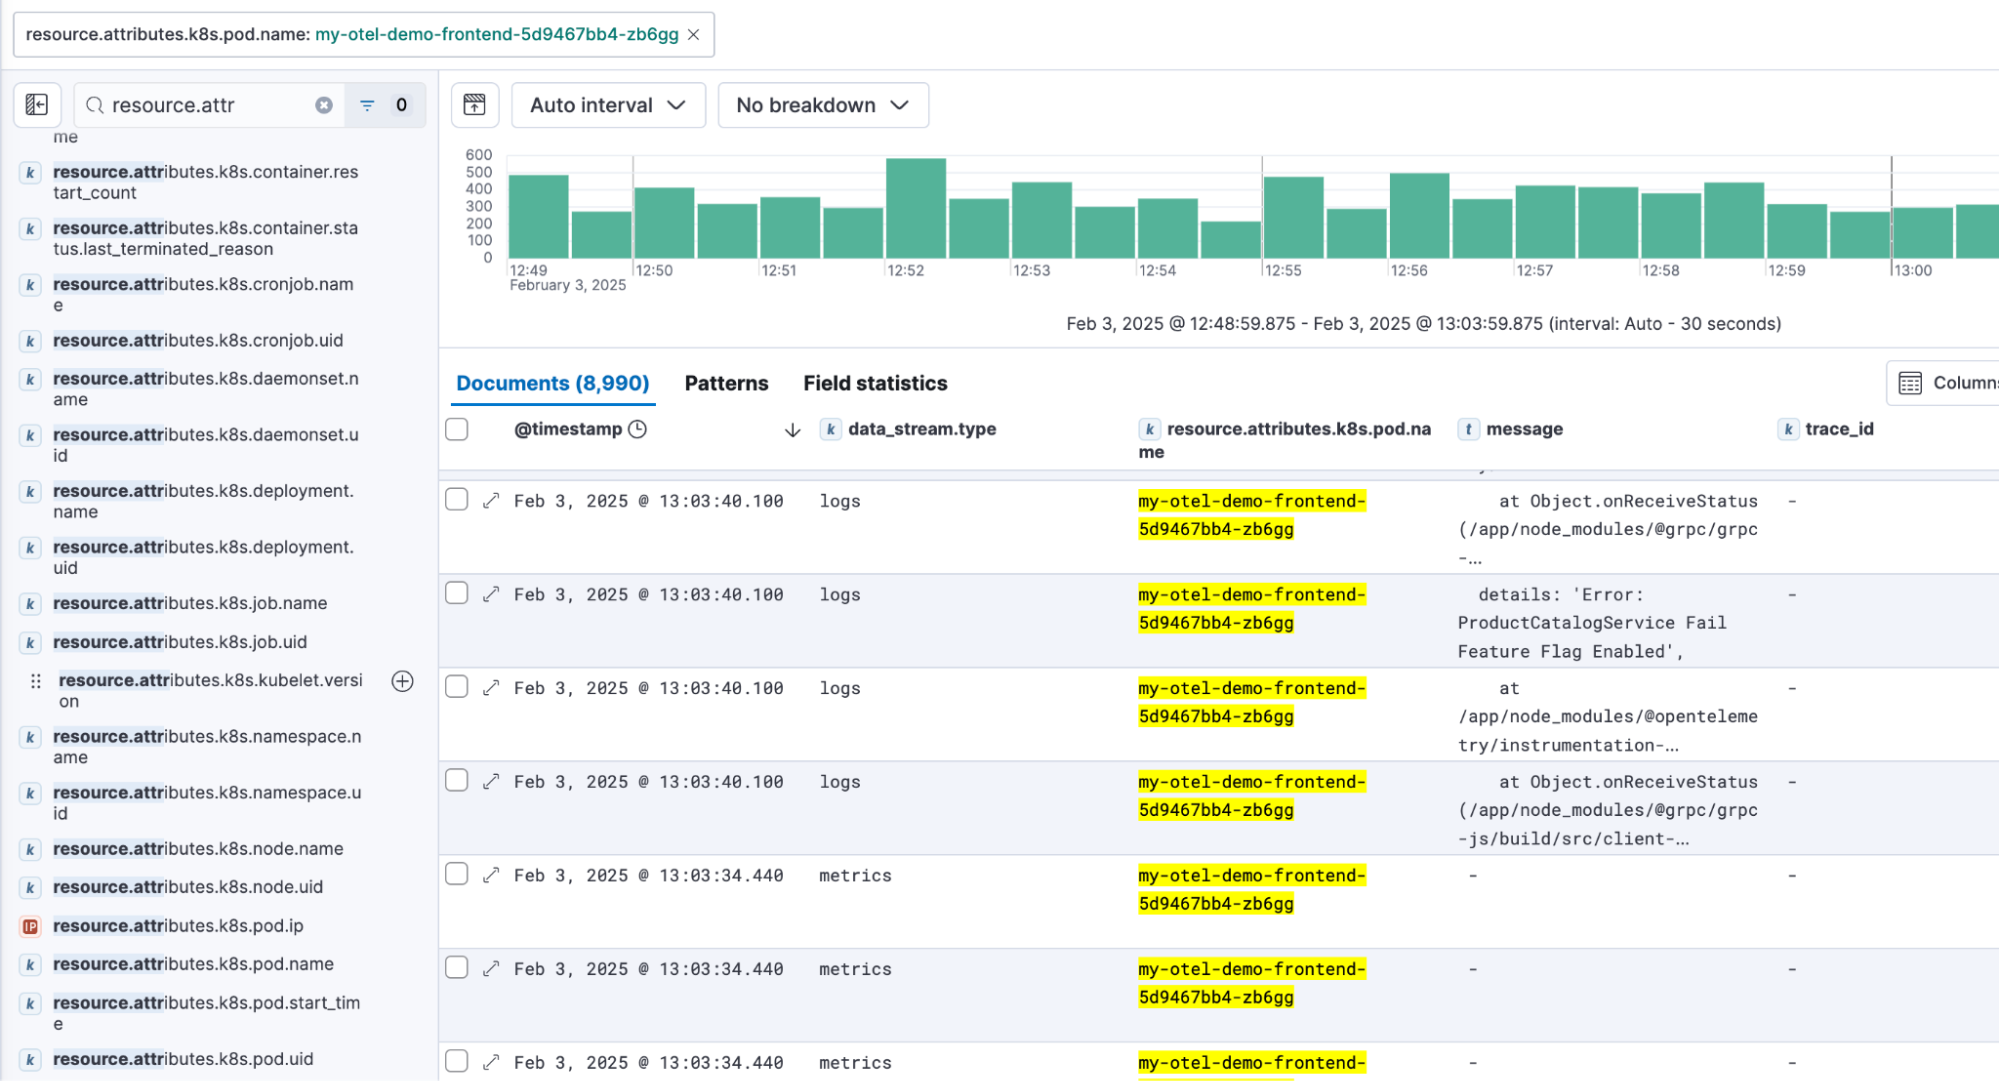
Refer to Discover to learn more.
The Applications UI allows you to monitor your software services and applications in real-time. You can visualize detailed performance information on your services, identify and analyze errors, and monitor host-level metrics.
To access the Hosts page, in your Elastic Observability Serverless project, go to Infrastructure → Hosts.
On the Hosts page, you can view health and performance metrics to help you quickly:
- Analyze and compare hosts without having to build new dashboards.
- Identify which hosts trigger the most alerts.
- Troubleshoot and resolve issues quickly.
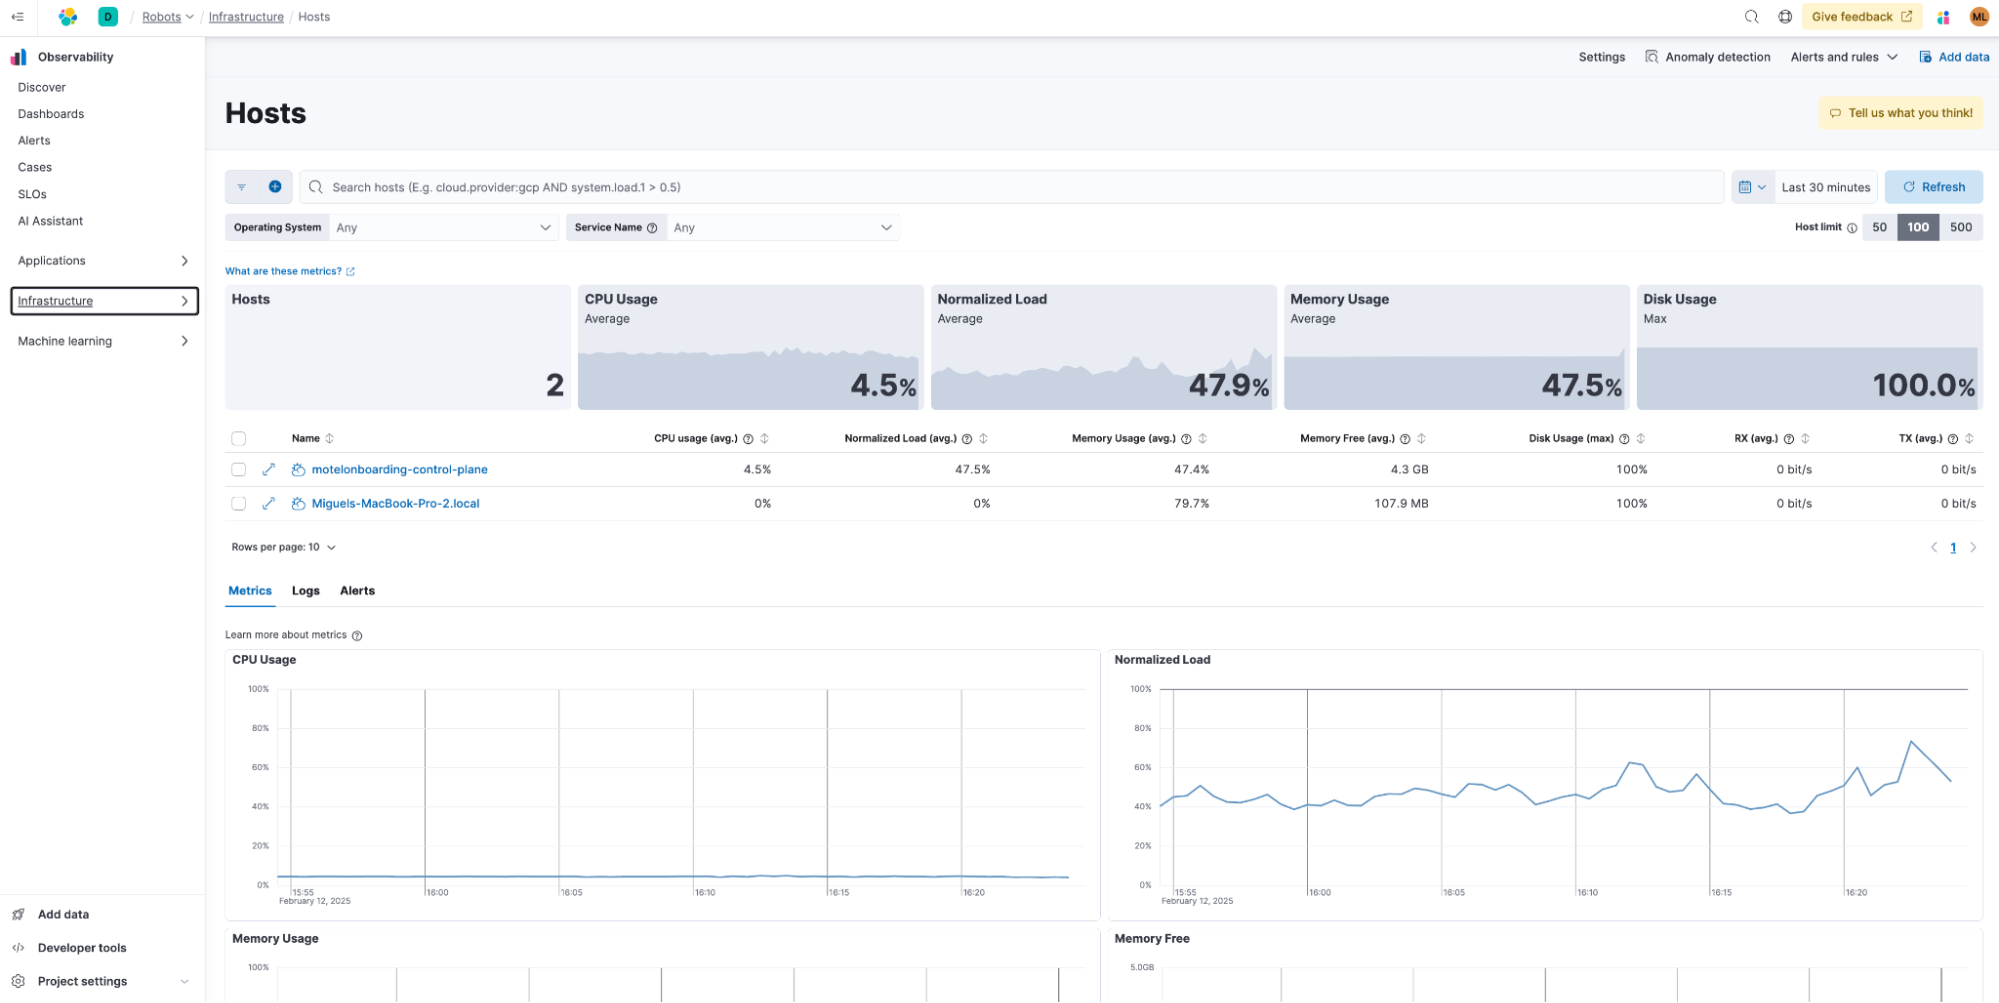
See Analyze and compare hosts to learn more.
Install the OpenTelemetry Assets integrations to access the "[OTEL][Metrics Kubernetes] Cluster Overview" dashboard.
In your Elastic Observability Serverless project, go to Integrations and toggle Display beta integrations. Search for "OpenTelemetry" to select and install Kubernetes OpenTelemetry Assets.